The COVID-19 pandemic led to a marked increase in absence from schools.
Aspire Attendance Tracker
Schools can track, analyse and compare their attendance data against 1,000s of other FFT schools using Aspire Attendance Tracker.
Log in to Aspire to access Attendance Tracker – log in here.
Not an FFT Aspire user? Learn more here.
But although COVID-19 has not gone away, there was a lot less absence in schools in the first half-term of 2022/23.
In this blogpost, we analyse data collected from 10,000 schools to present a broad but up-to-date overview of absence in schools.
Absence by week
In the chart below, we show the week-to-week trend for primary age pupils (Years 1 to 6) and secondary age pupils (Years 7 to 11) both this year and last year.
Note that we leave aside the first week of term (weeks ending 3rd September 20221 and 2nd September 2022) as the data tends to be a bit noisy.
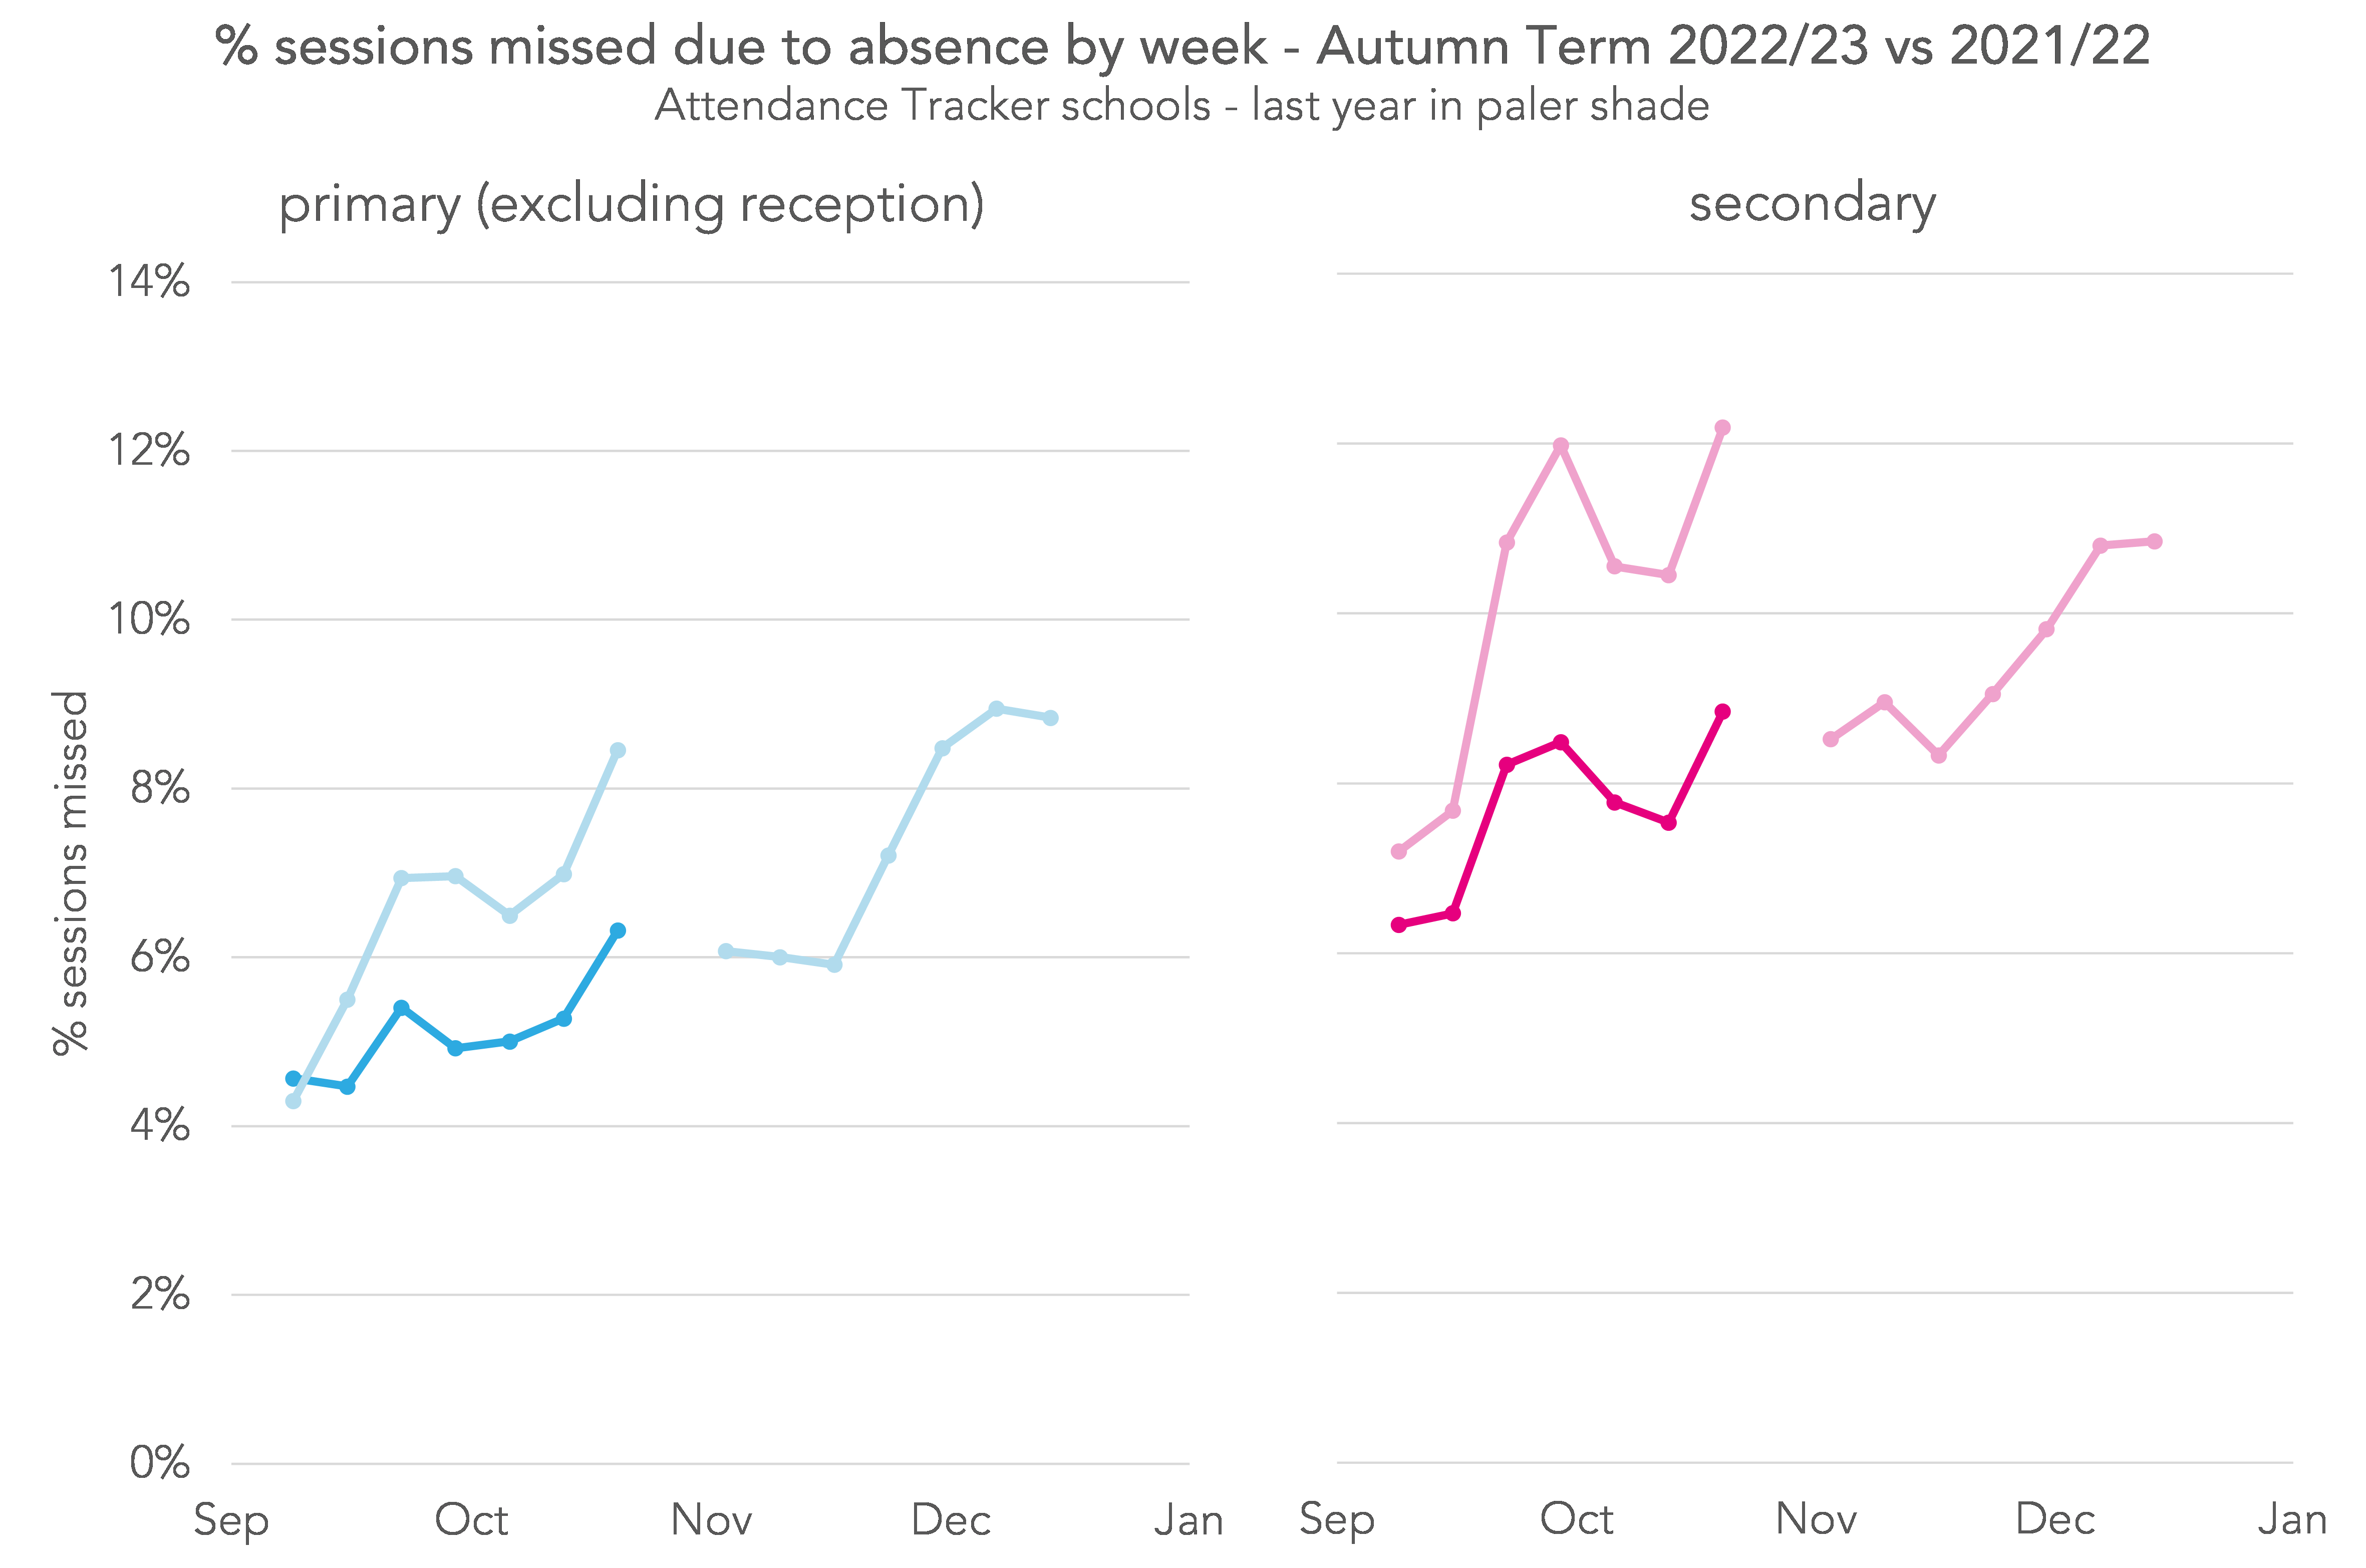
For both primary-age and secondary-age pupils, the charts present a similar picture. The trends are similar to last year in that there is a gradual increase in absence as term starts, followed by a dip, followed by an increase in the final week before half-term.
However, there has been much less absence throughout the term so far.
The overall absence rate for primary-age pupils for the half-term was 5.1% and for secondary age pupils 7.7%.
This compares with pre-pandemic absence rates from Autumn 2019 of 4.3% in primary schools and 5.6% in secondary schools.
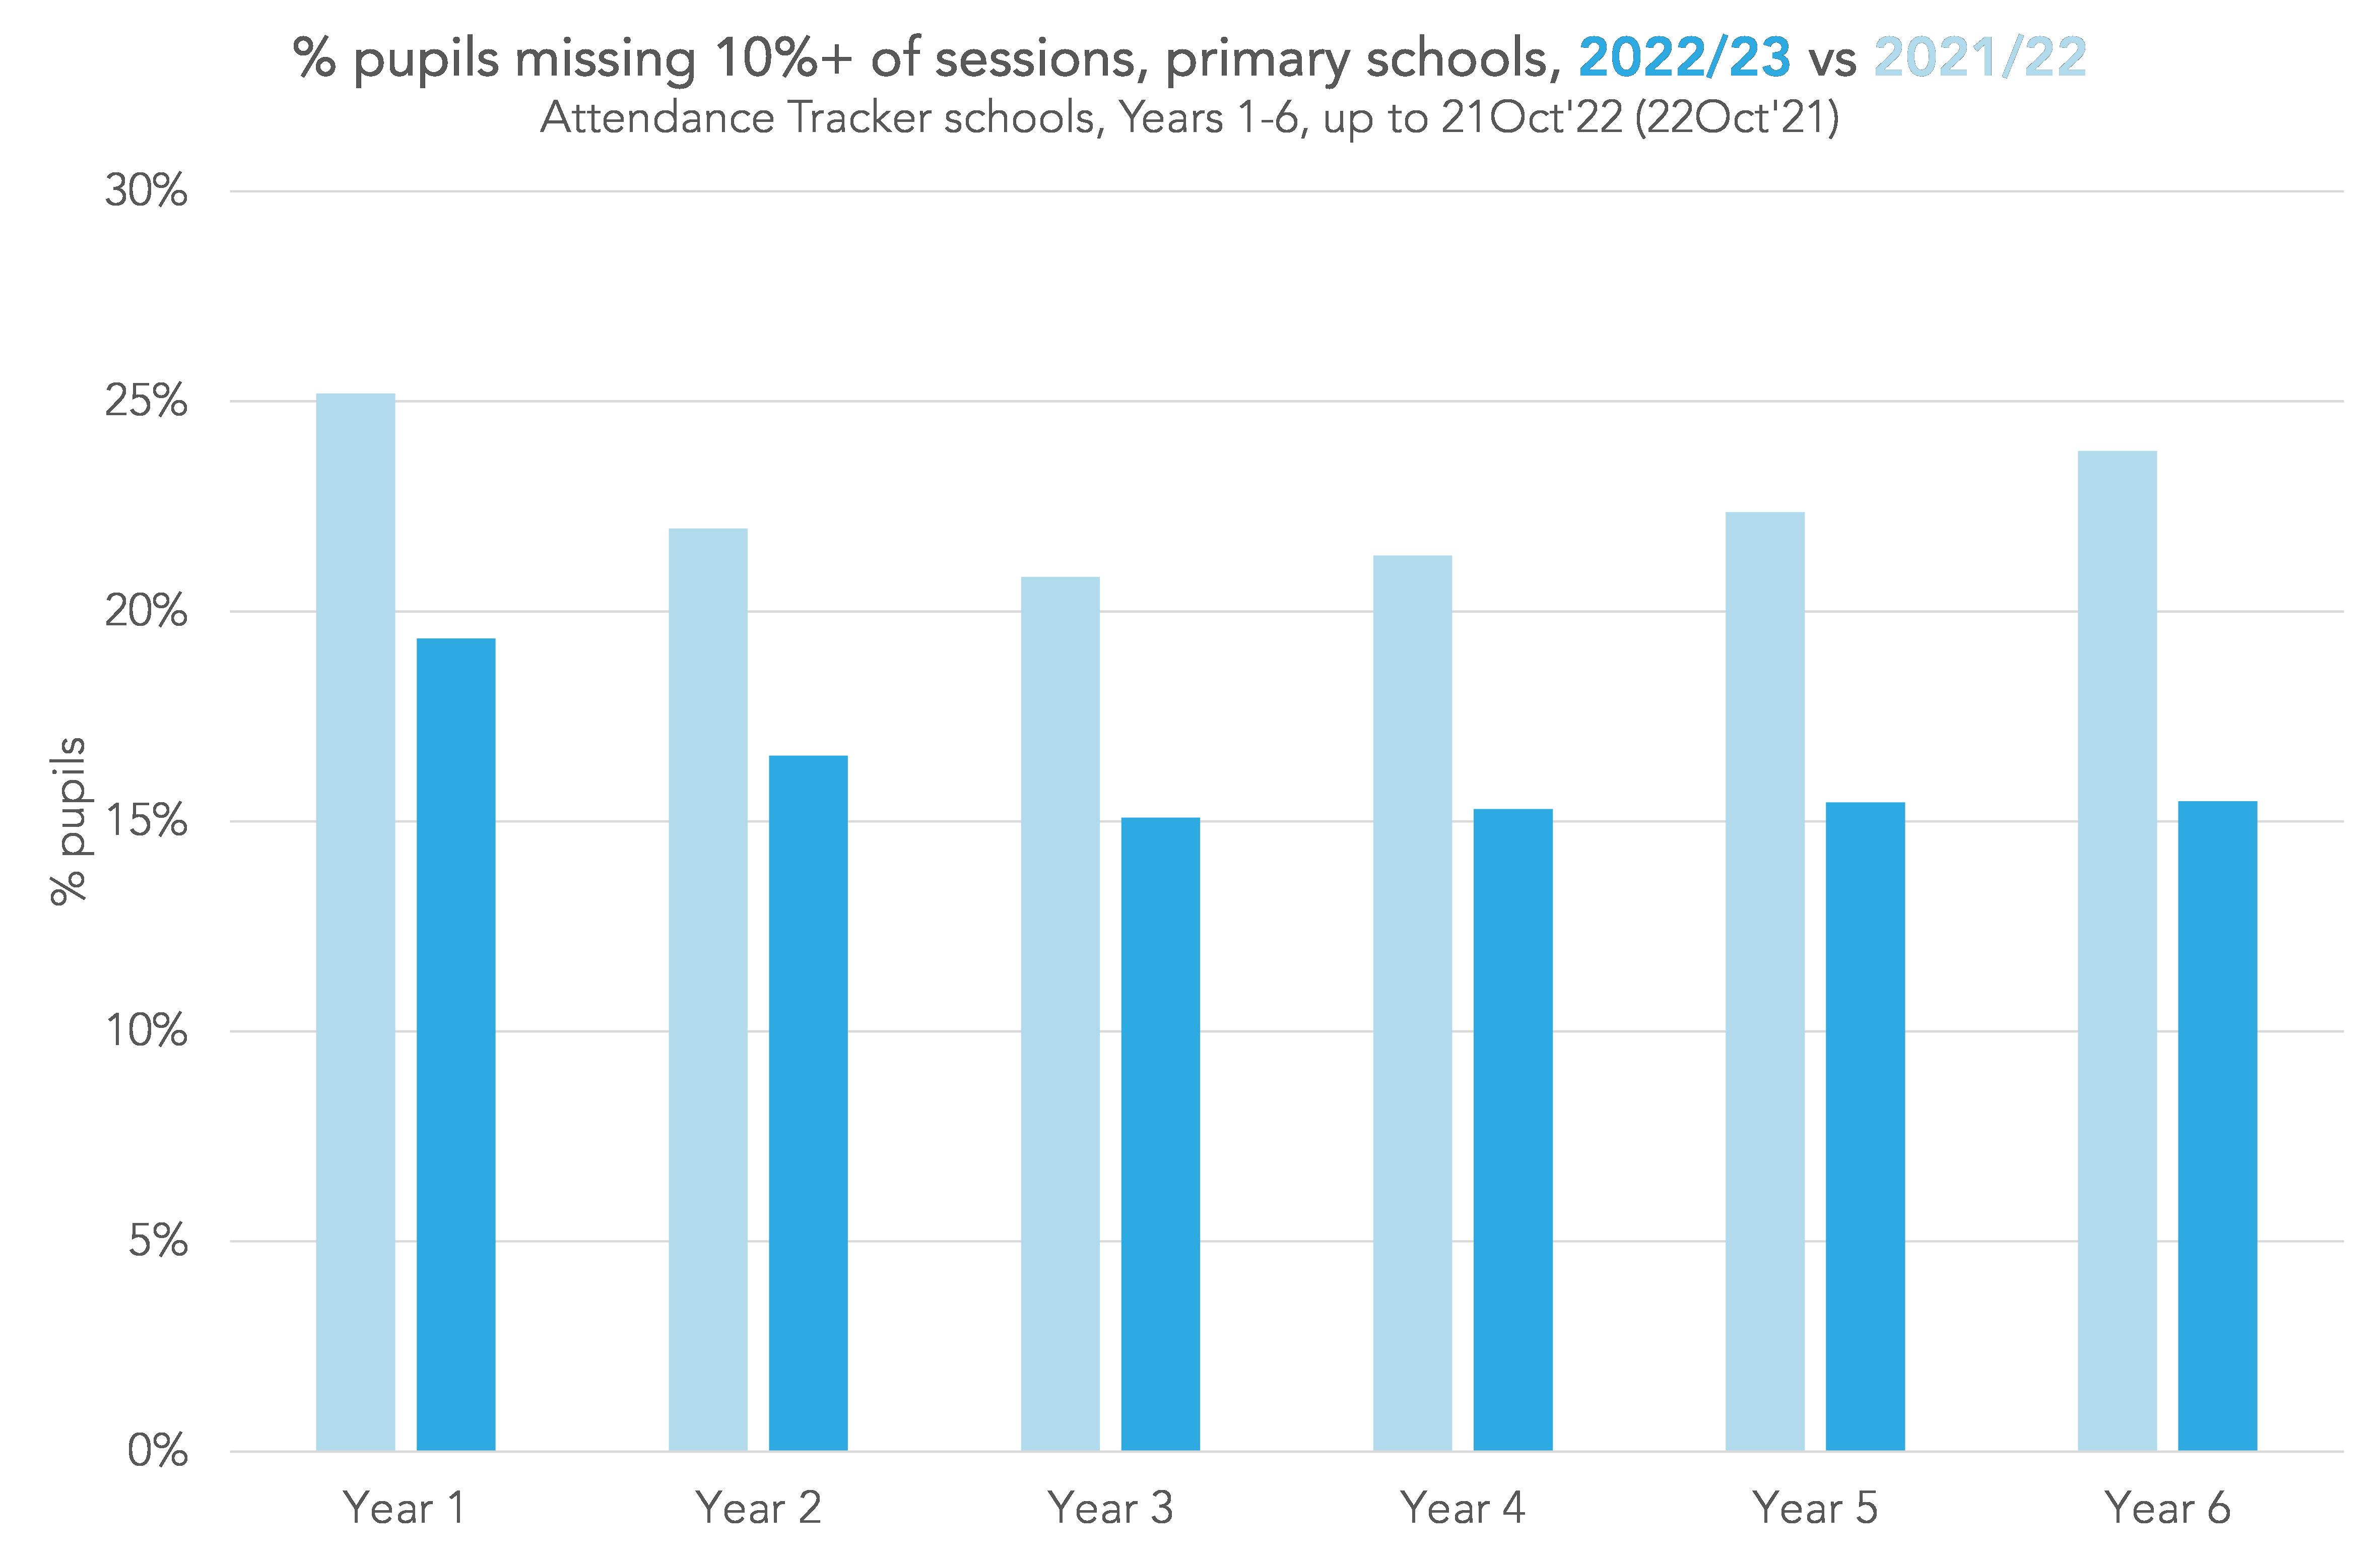
Absence by year group
Now let’s see how absence varies by year group. Again, we compare absence this year to last year.
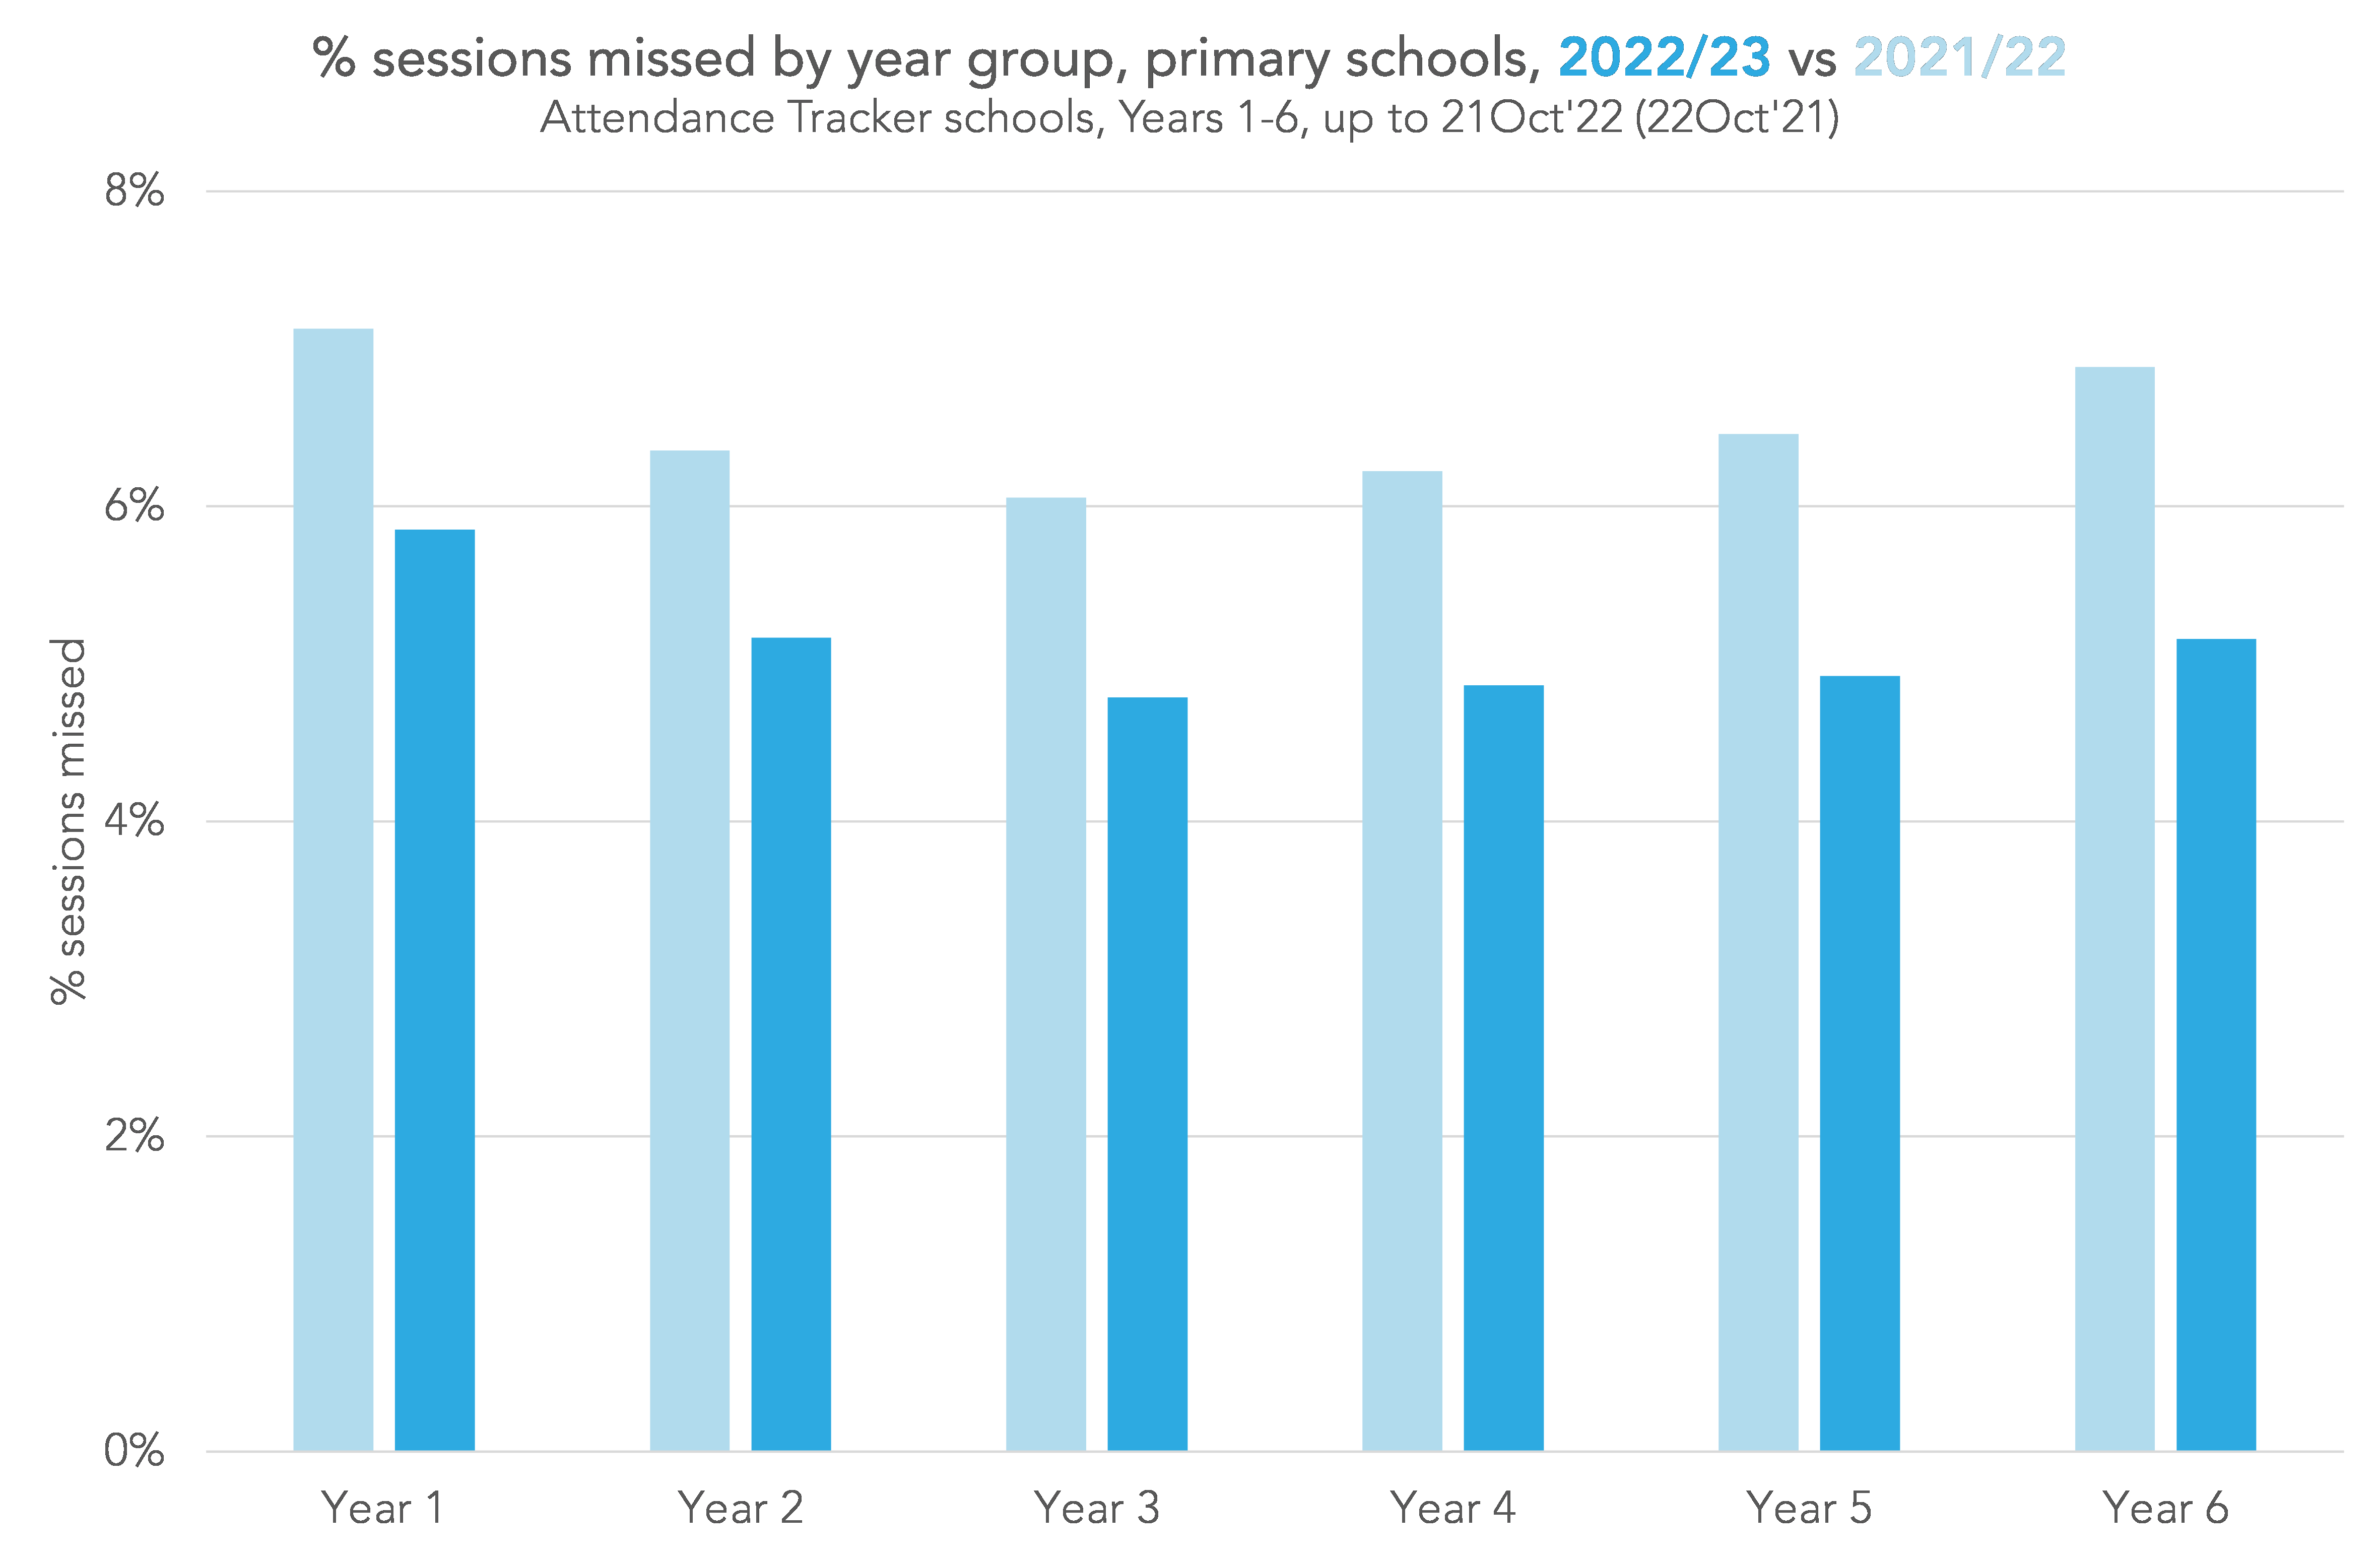
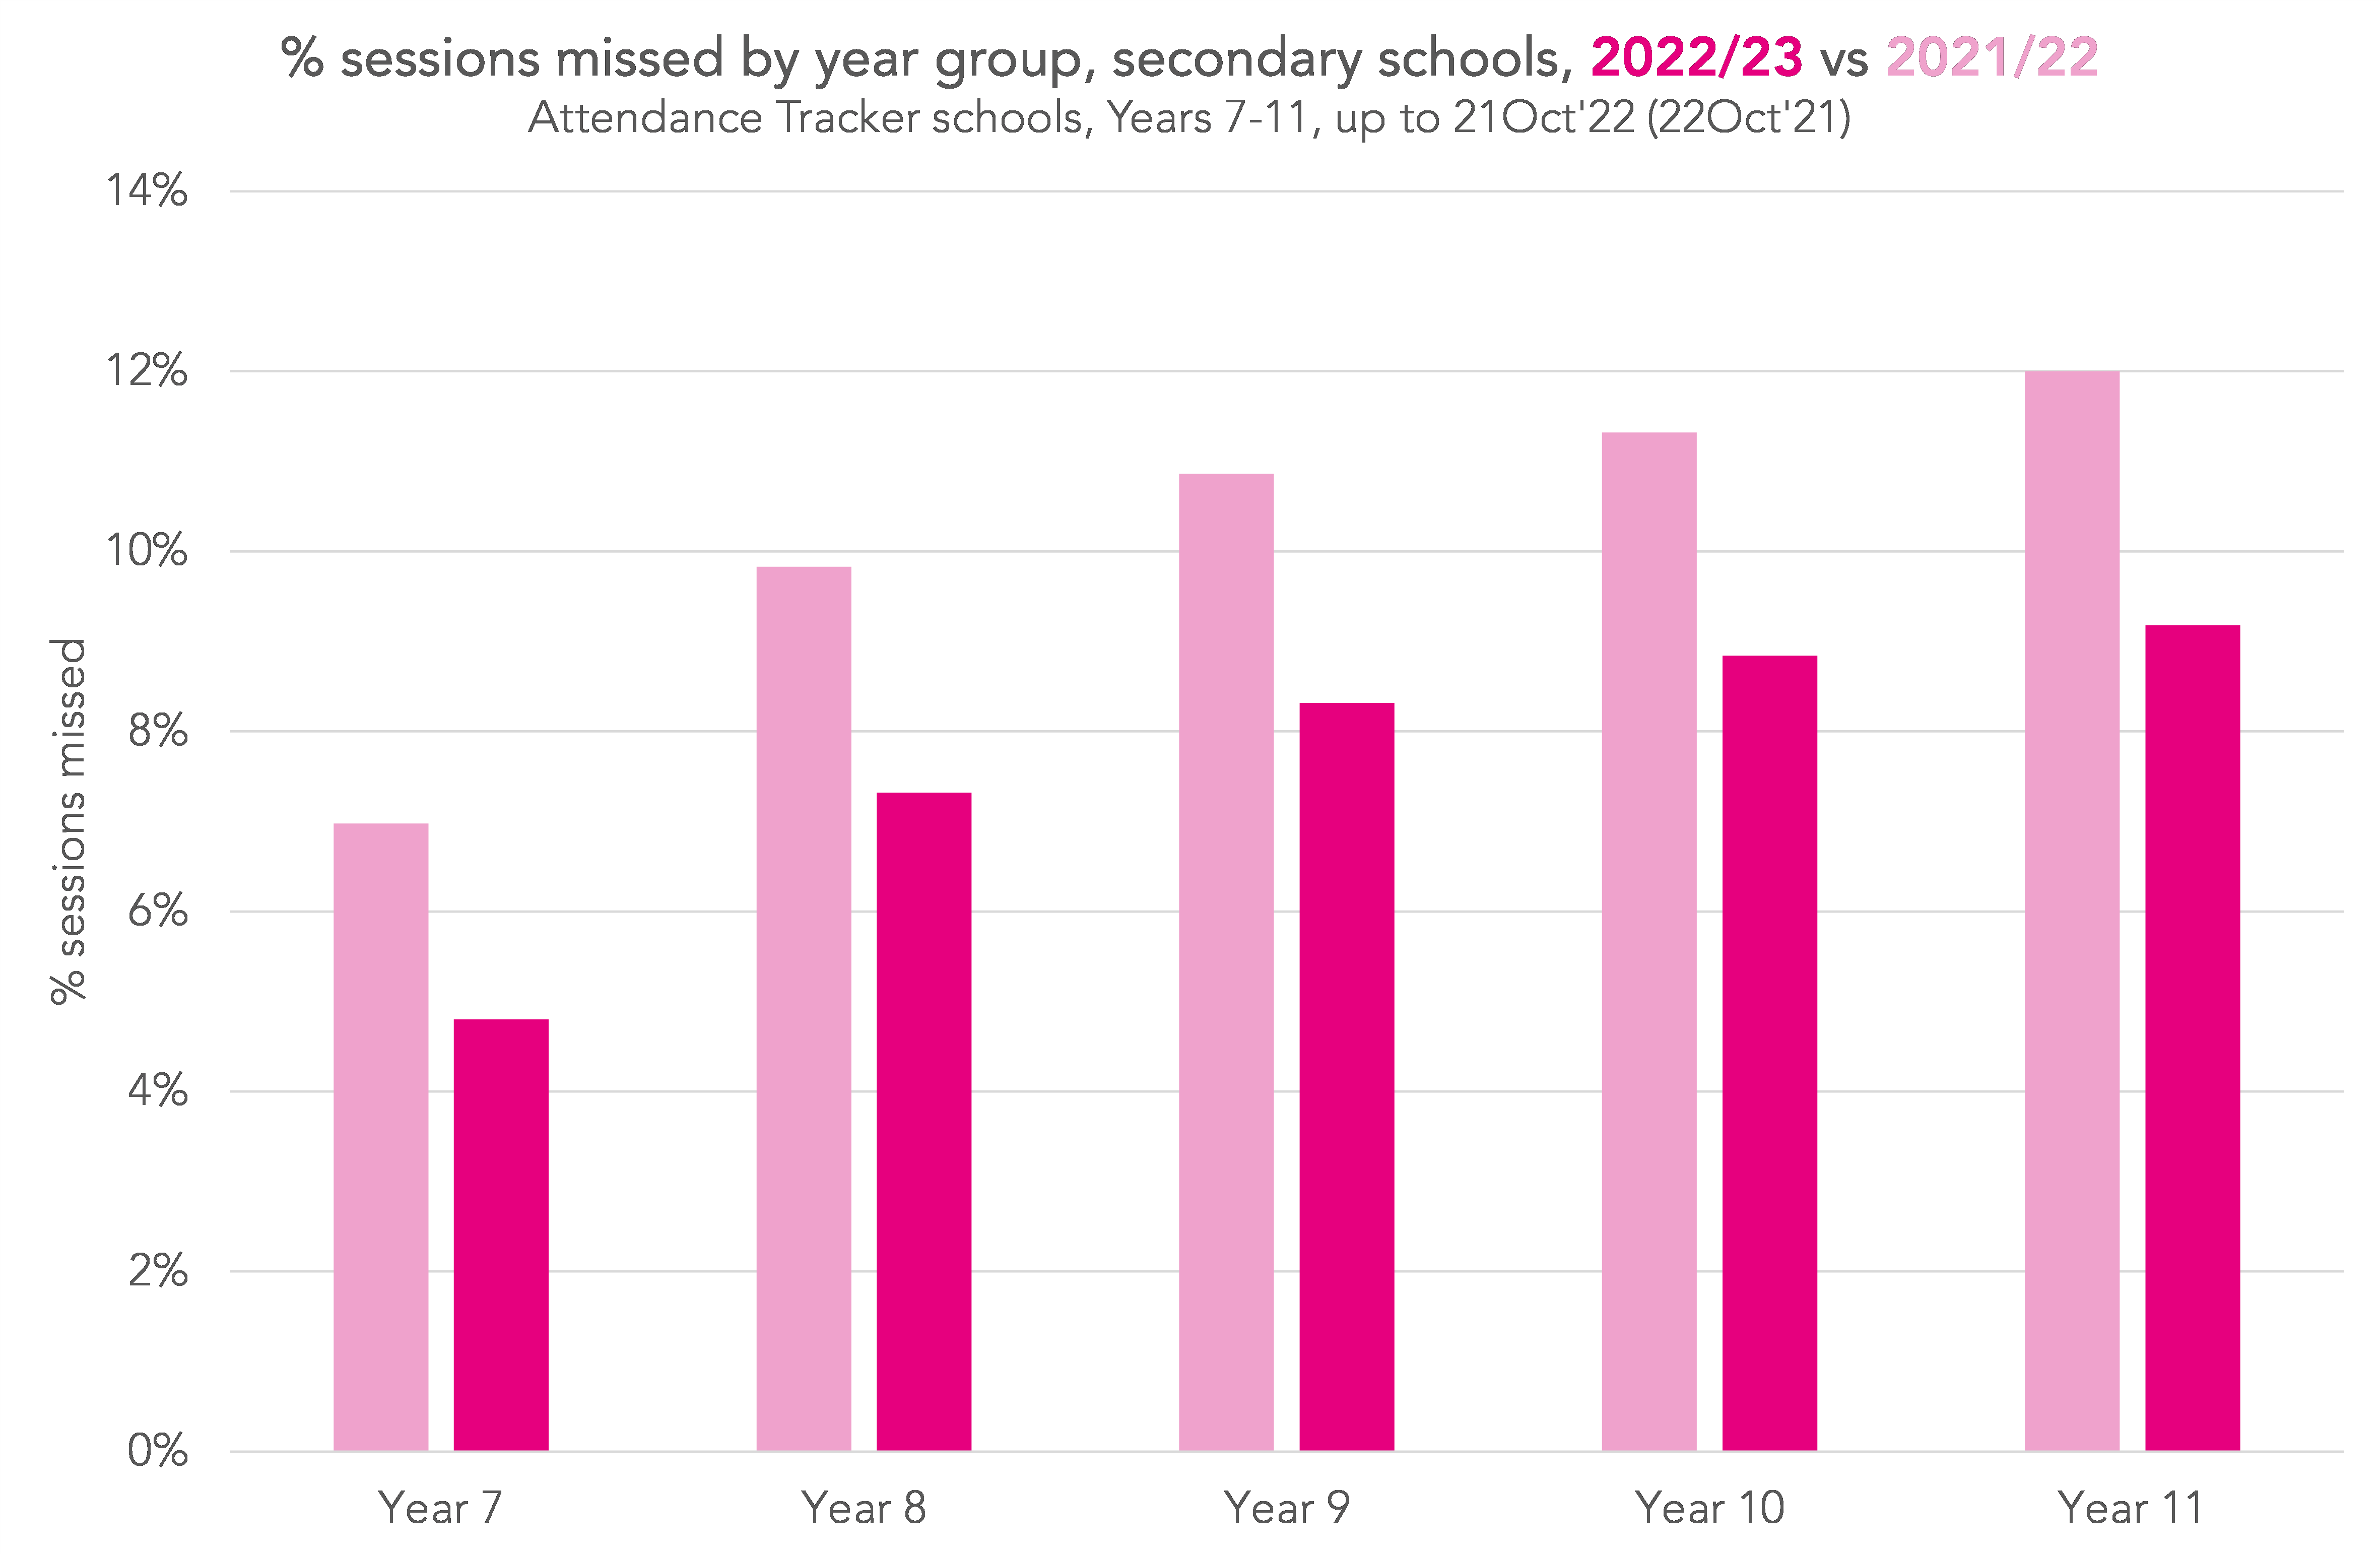
Absence has fallen for all year groups but the patterns of absence remain the same. Among primary-age pupils, absence is lowest among those in Year 3 and highest among those in Year 1. Among secondary-age pupils, absence increases with age.
Year 11 pupils tend to miss more school than other year groups. However, the rate of absence this year (9.2%) has been much lower than last year (12.0%).
We have collected data on absence in Reception this year for the first time but we will leave this for another day.
Absence by region
Apart from the end of the Autumn term in 2020 when the alpha variant took hold, rates of absence in London schools have tended to be lower than elsewhere in the country.
As the following charts show, absence rates in London are now more similar to the rest of the country. Or put another way, absence has fallen by a larger amount in other regions.
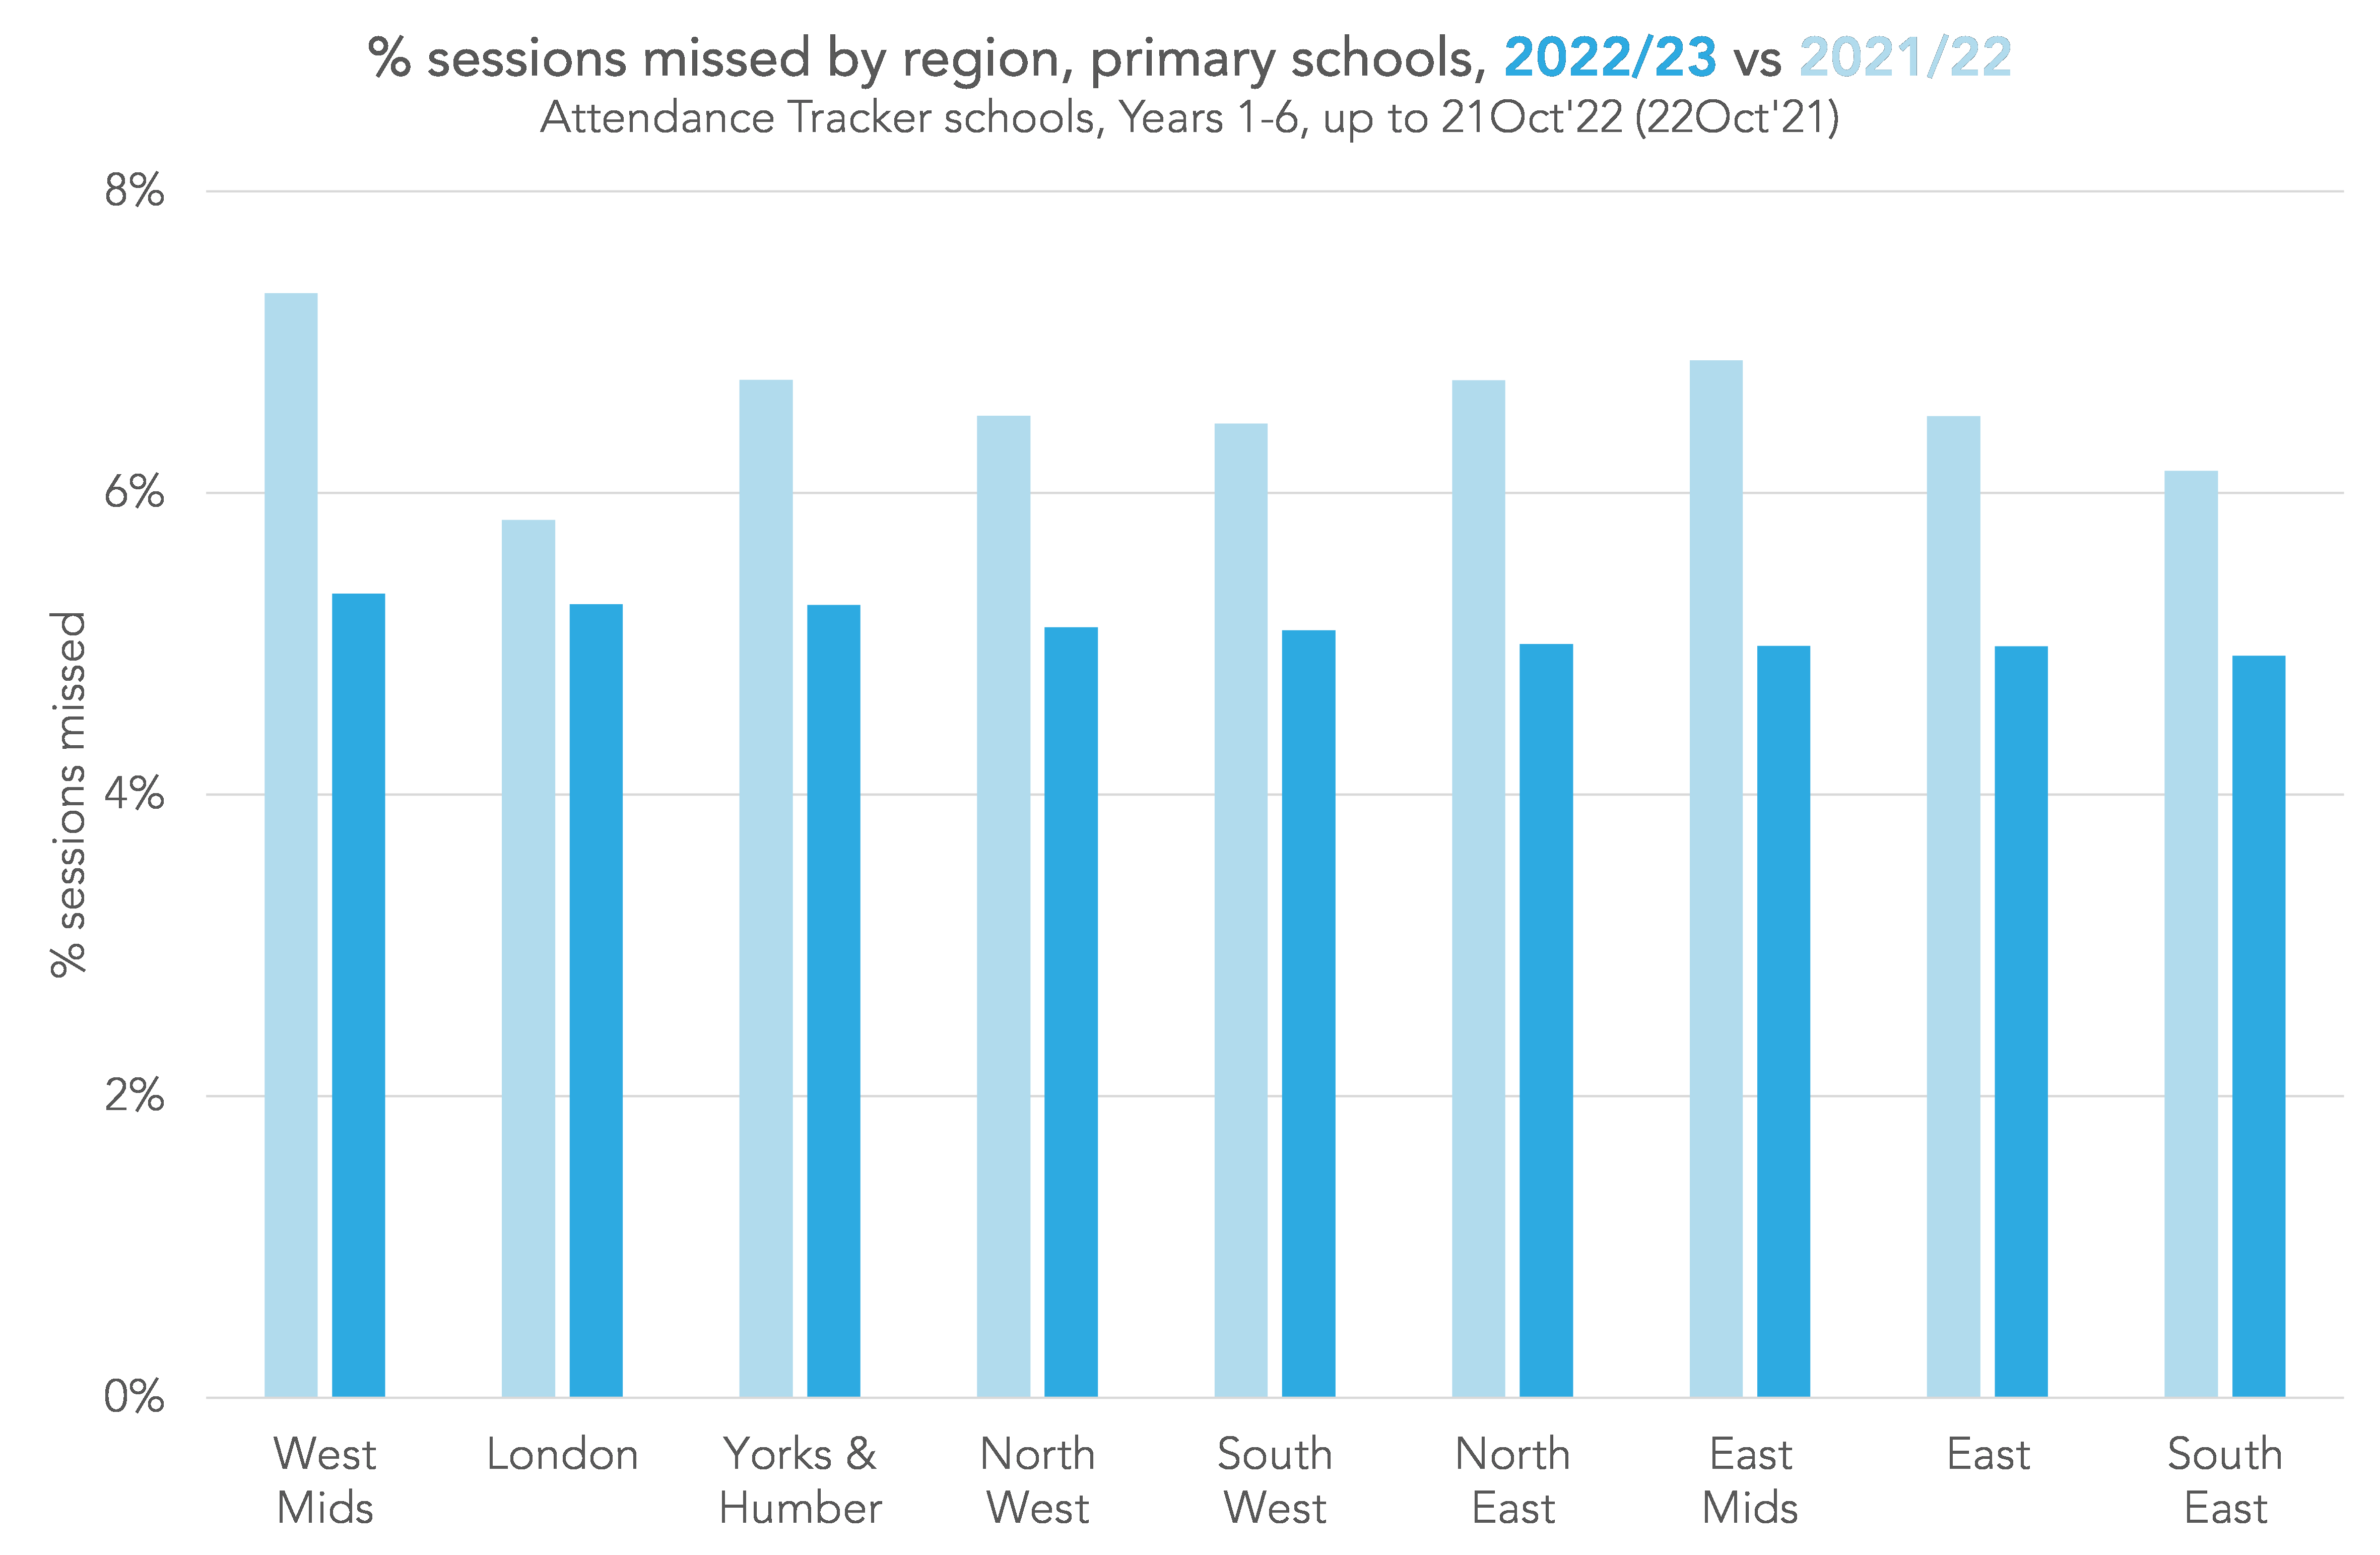
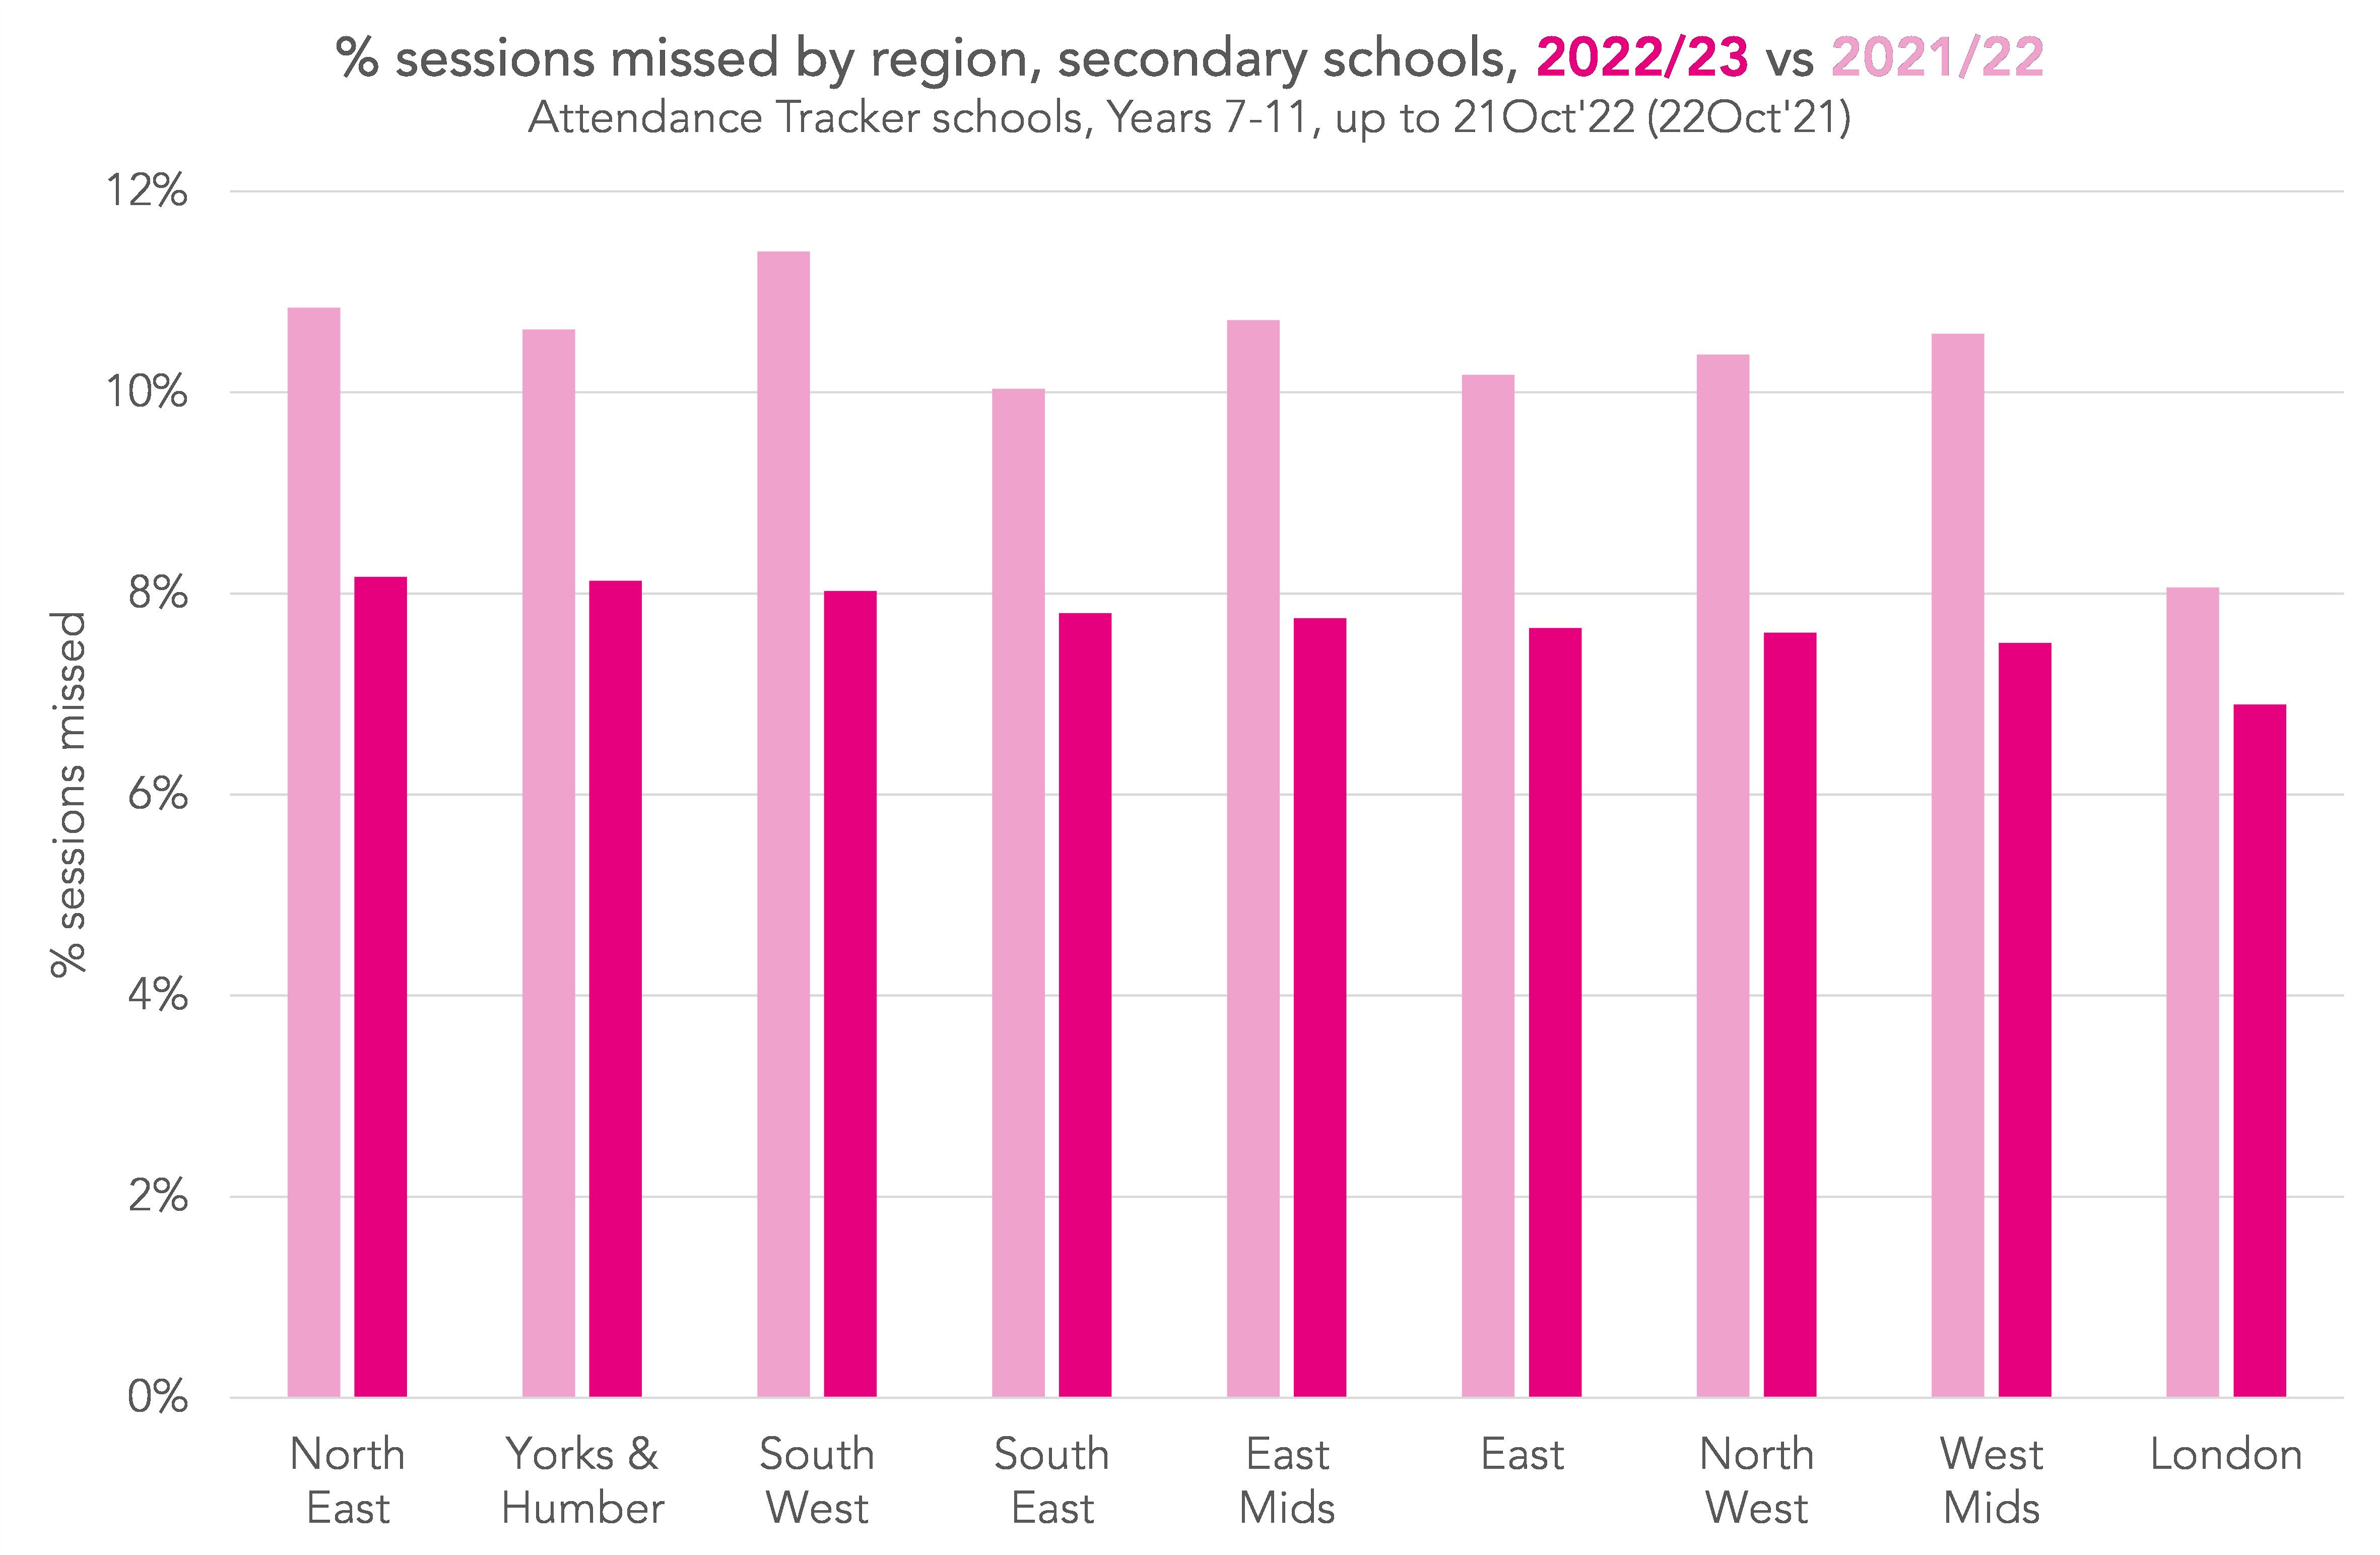
London remains the region with the lowest rates of secondary absence. But it now has the 2nd highest rate of primary absence although as the first of the two charts immediately above shows, there is not much difference between the regions.
Persistent absence
Prior to the pandemic, the Department for Education defined persistent absence as missing 10% or more of sessions (equivalent to one day a fortnight).
As we have previously showed, the pandemic led to a significant rise in the percentage of pupils missing 10% or more of sessions. Last year, over the Autumn and Spring terms, 25% of primary-age pupils and 33% of secondary-age pupils would have been classified as persistent absentees. For that reason, we suggested some alternative measures of persistent absence.
It’s probably a bit too early in the year to be looking at persistent absence since pupils unlucky enough to be off sick for a short spell in the first half-term will (at the moment at least) be counted as a persistent absentee even if they have few more spells of absence during the rest of the year.
Nonetheless, and as you might expect from the falling absence rates, there has been a fall in persistent absence so far this year compared to last year.
Over the first half-term, 16% of primary-age and 22% of secondary-age pupils missed 10% or more of sessions.
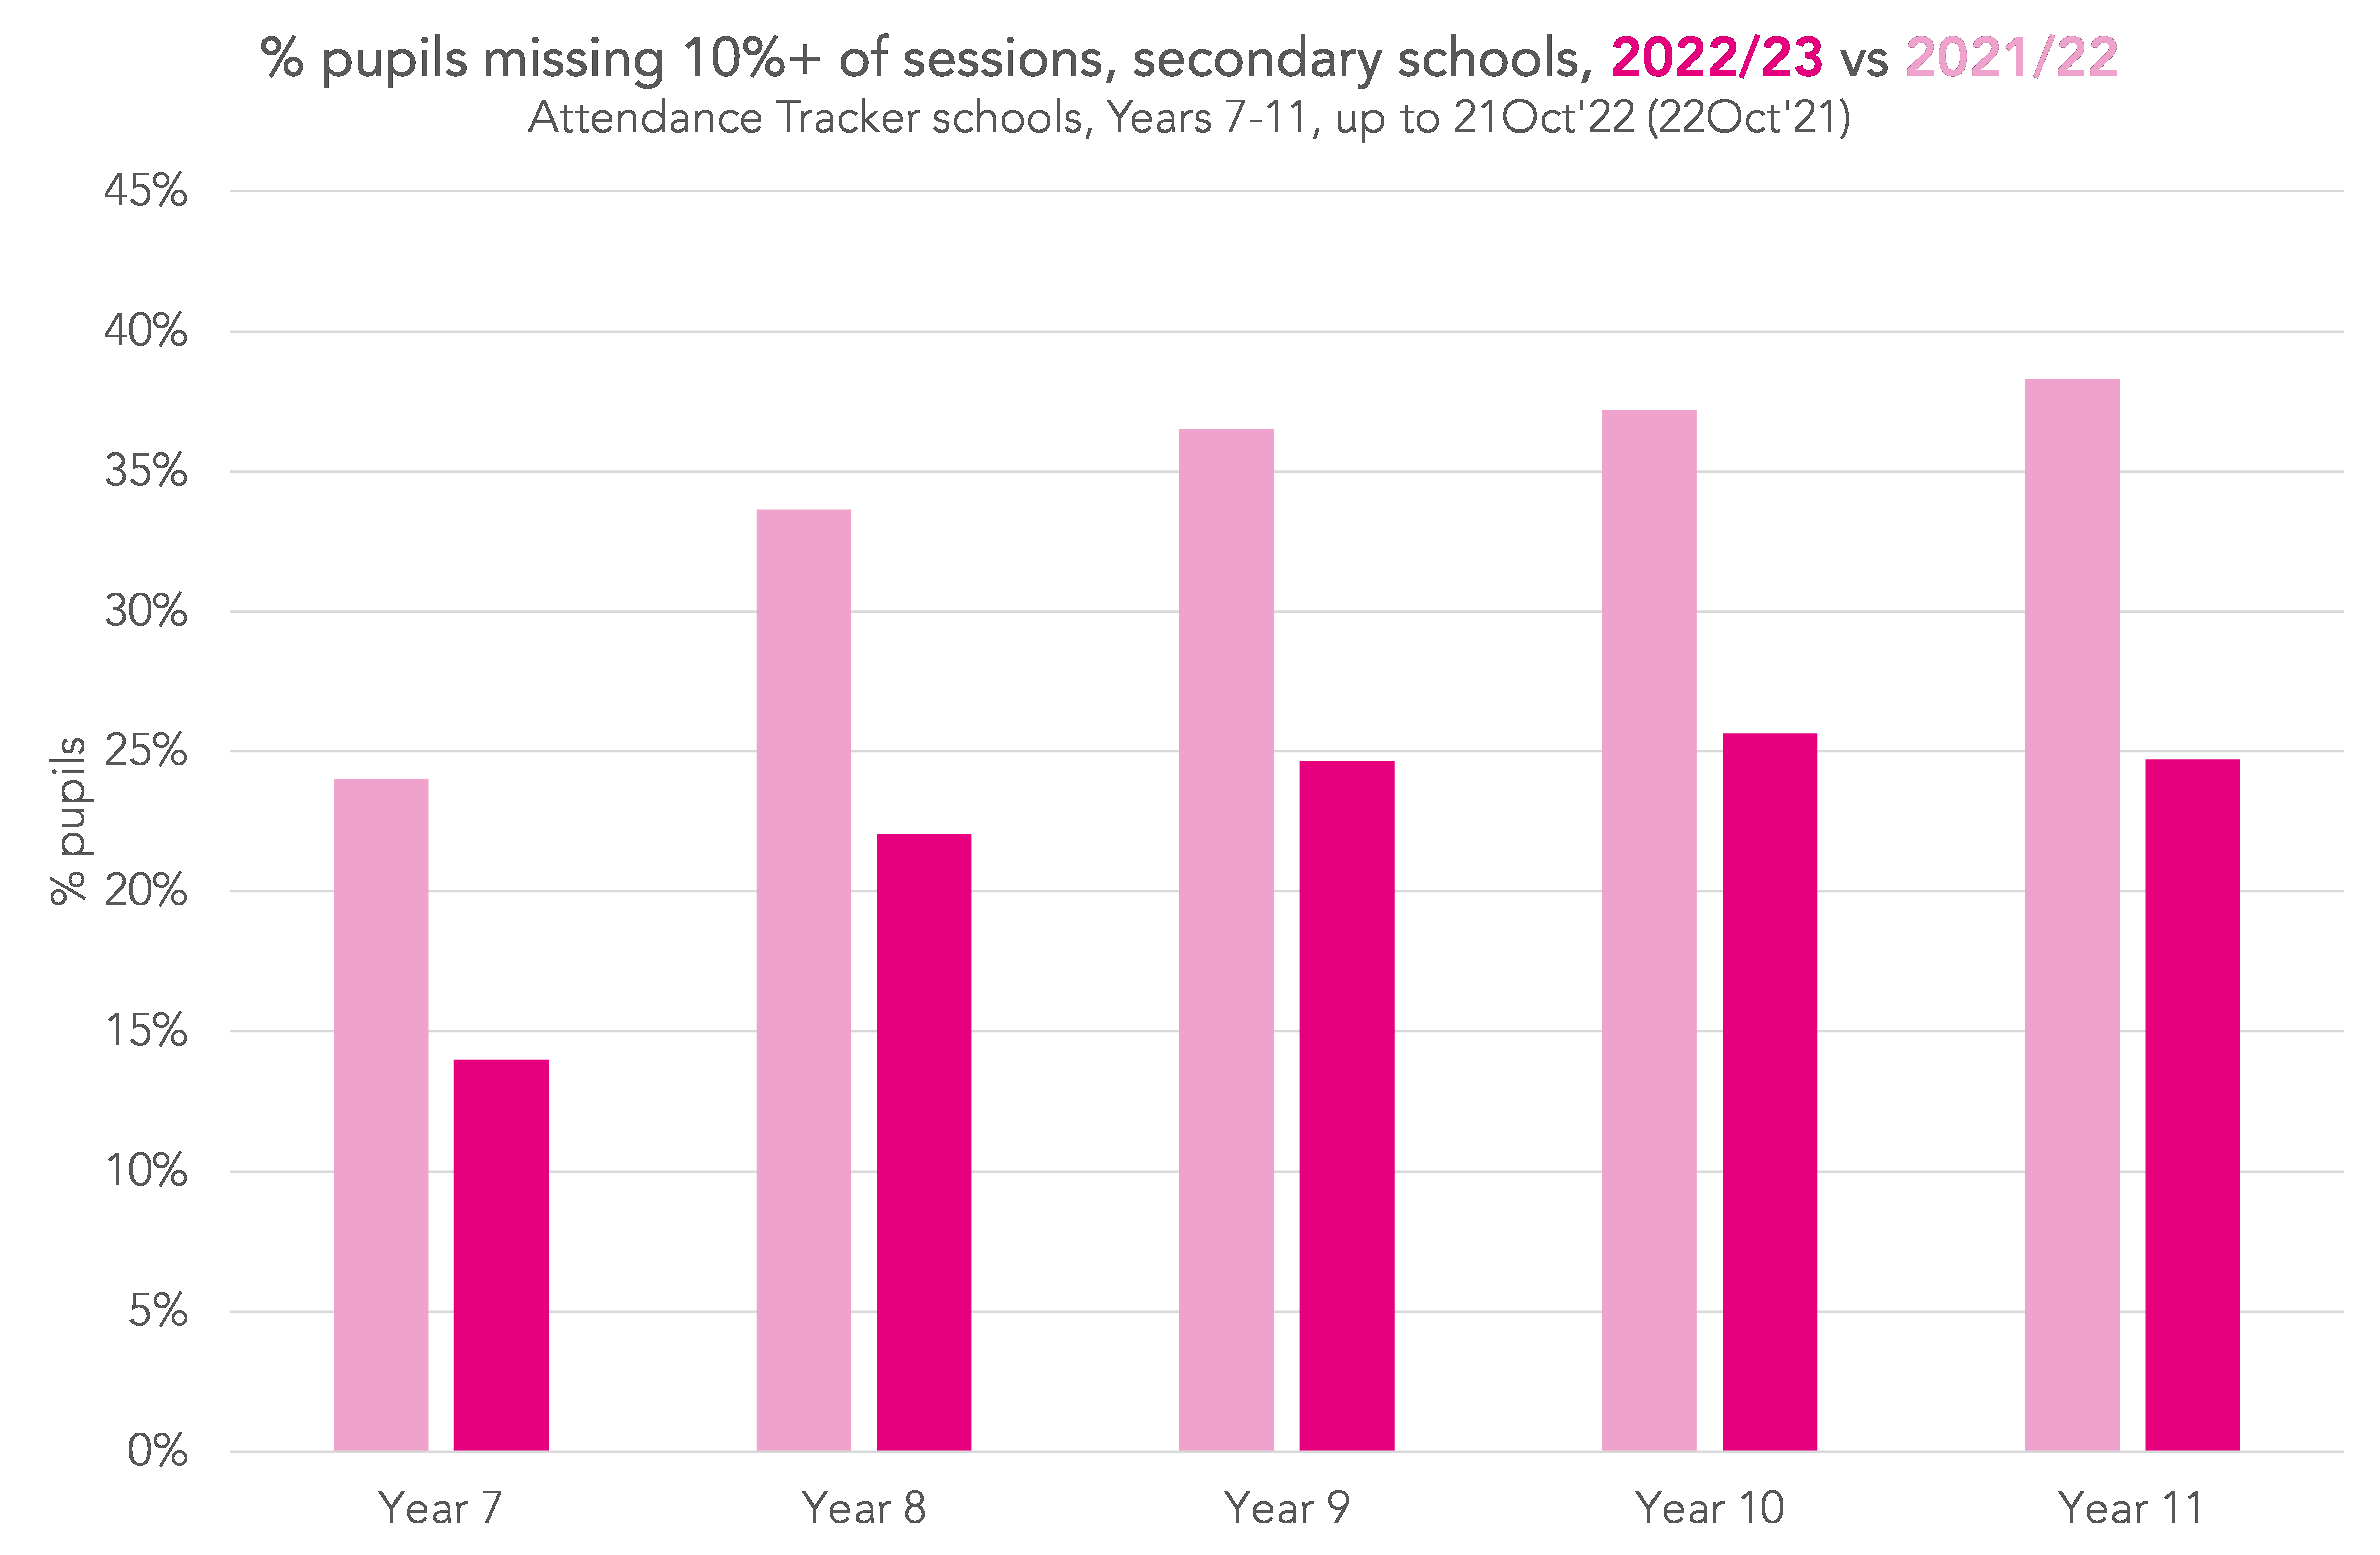
However, despite the improvement, we do still sound a note of caution that 25% of pupils in Years 9 to 11 missed 10% or more of sessions during the first half-term.
Summing up
So far this term, rates of pupil absence have been much lower than last year.
Put another way, there has been an improvement in attendance.
Clearly there has been a lot of noise and activity around absence from schools since the pandemic. This includes the Department for Education collecting daily data from schools, fines for parents and attention from the Children’s Commissioner and Education Select Committee among others.
Has any of this made any difference? At this stage we cannot say: we would have needed some estimate of what would have happened in the absence of it all to arrive at a view. Perhaps absence would have fallen anyway as we gradually adapt to a world with COVID. Perhaps there are other policy responses (e.g. more widespread use of air filters) that would be more effective.
Improving absence further will increasingly mean tackling the root causes of absence. As this article in the Financial Times (£) makes clear, these reasons may be multifactorial and not within the gift of schools to resolve on their own.
Want to stay up-to-date with the latest research from FFT Education Datalab? Sign up to Datalab’s mailing list to get notifications about new blogposts, or to receive the team’s half-termly newsletter.
Leave A Comment