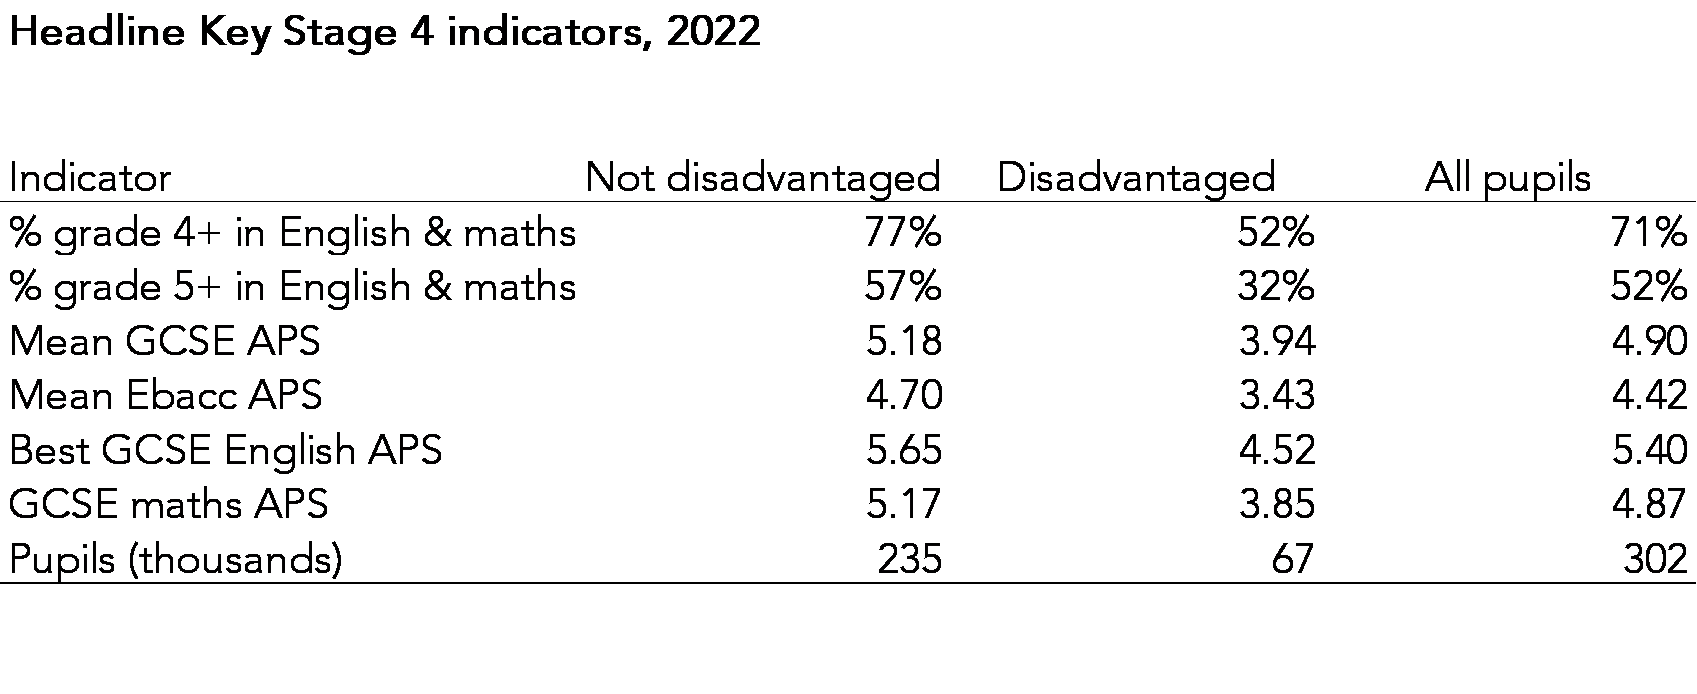
To coincide with making available reports from the 2022 Key Stage 4 Early Results Service, we’re publishing some headline Key Stage 4 indicators for 2022.
This is based on data provided by 1,700 state-funded secondary schools. All bar 30 are mainstream schools.
The data used in this blogpost is from our 2022 GCSE Early Results Service. As well as providing a full national analysis of your school’s GCSE results, this year’s reports include attendance data collected via Attendance Tracker. This means that schools can assess the impact of absence on students’ results.
Any other FFT schools wanting an early GCSE analysis can log in to FFT Aspire and upload their results. The final closing date is 9 September with reports available on 16 September.
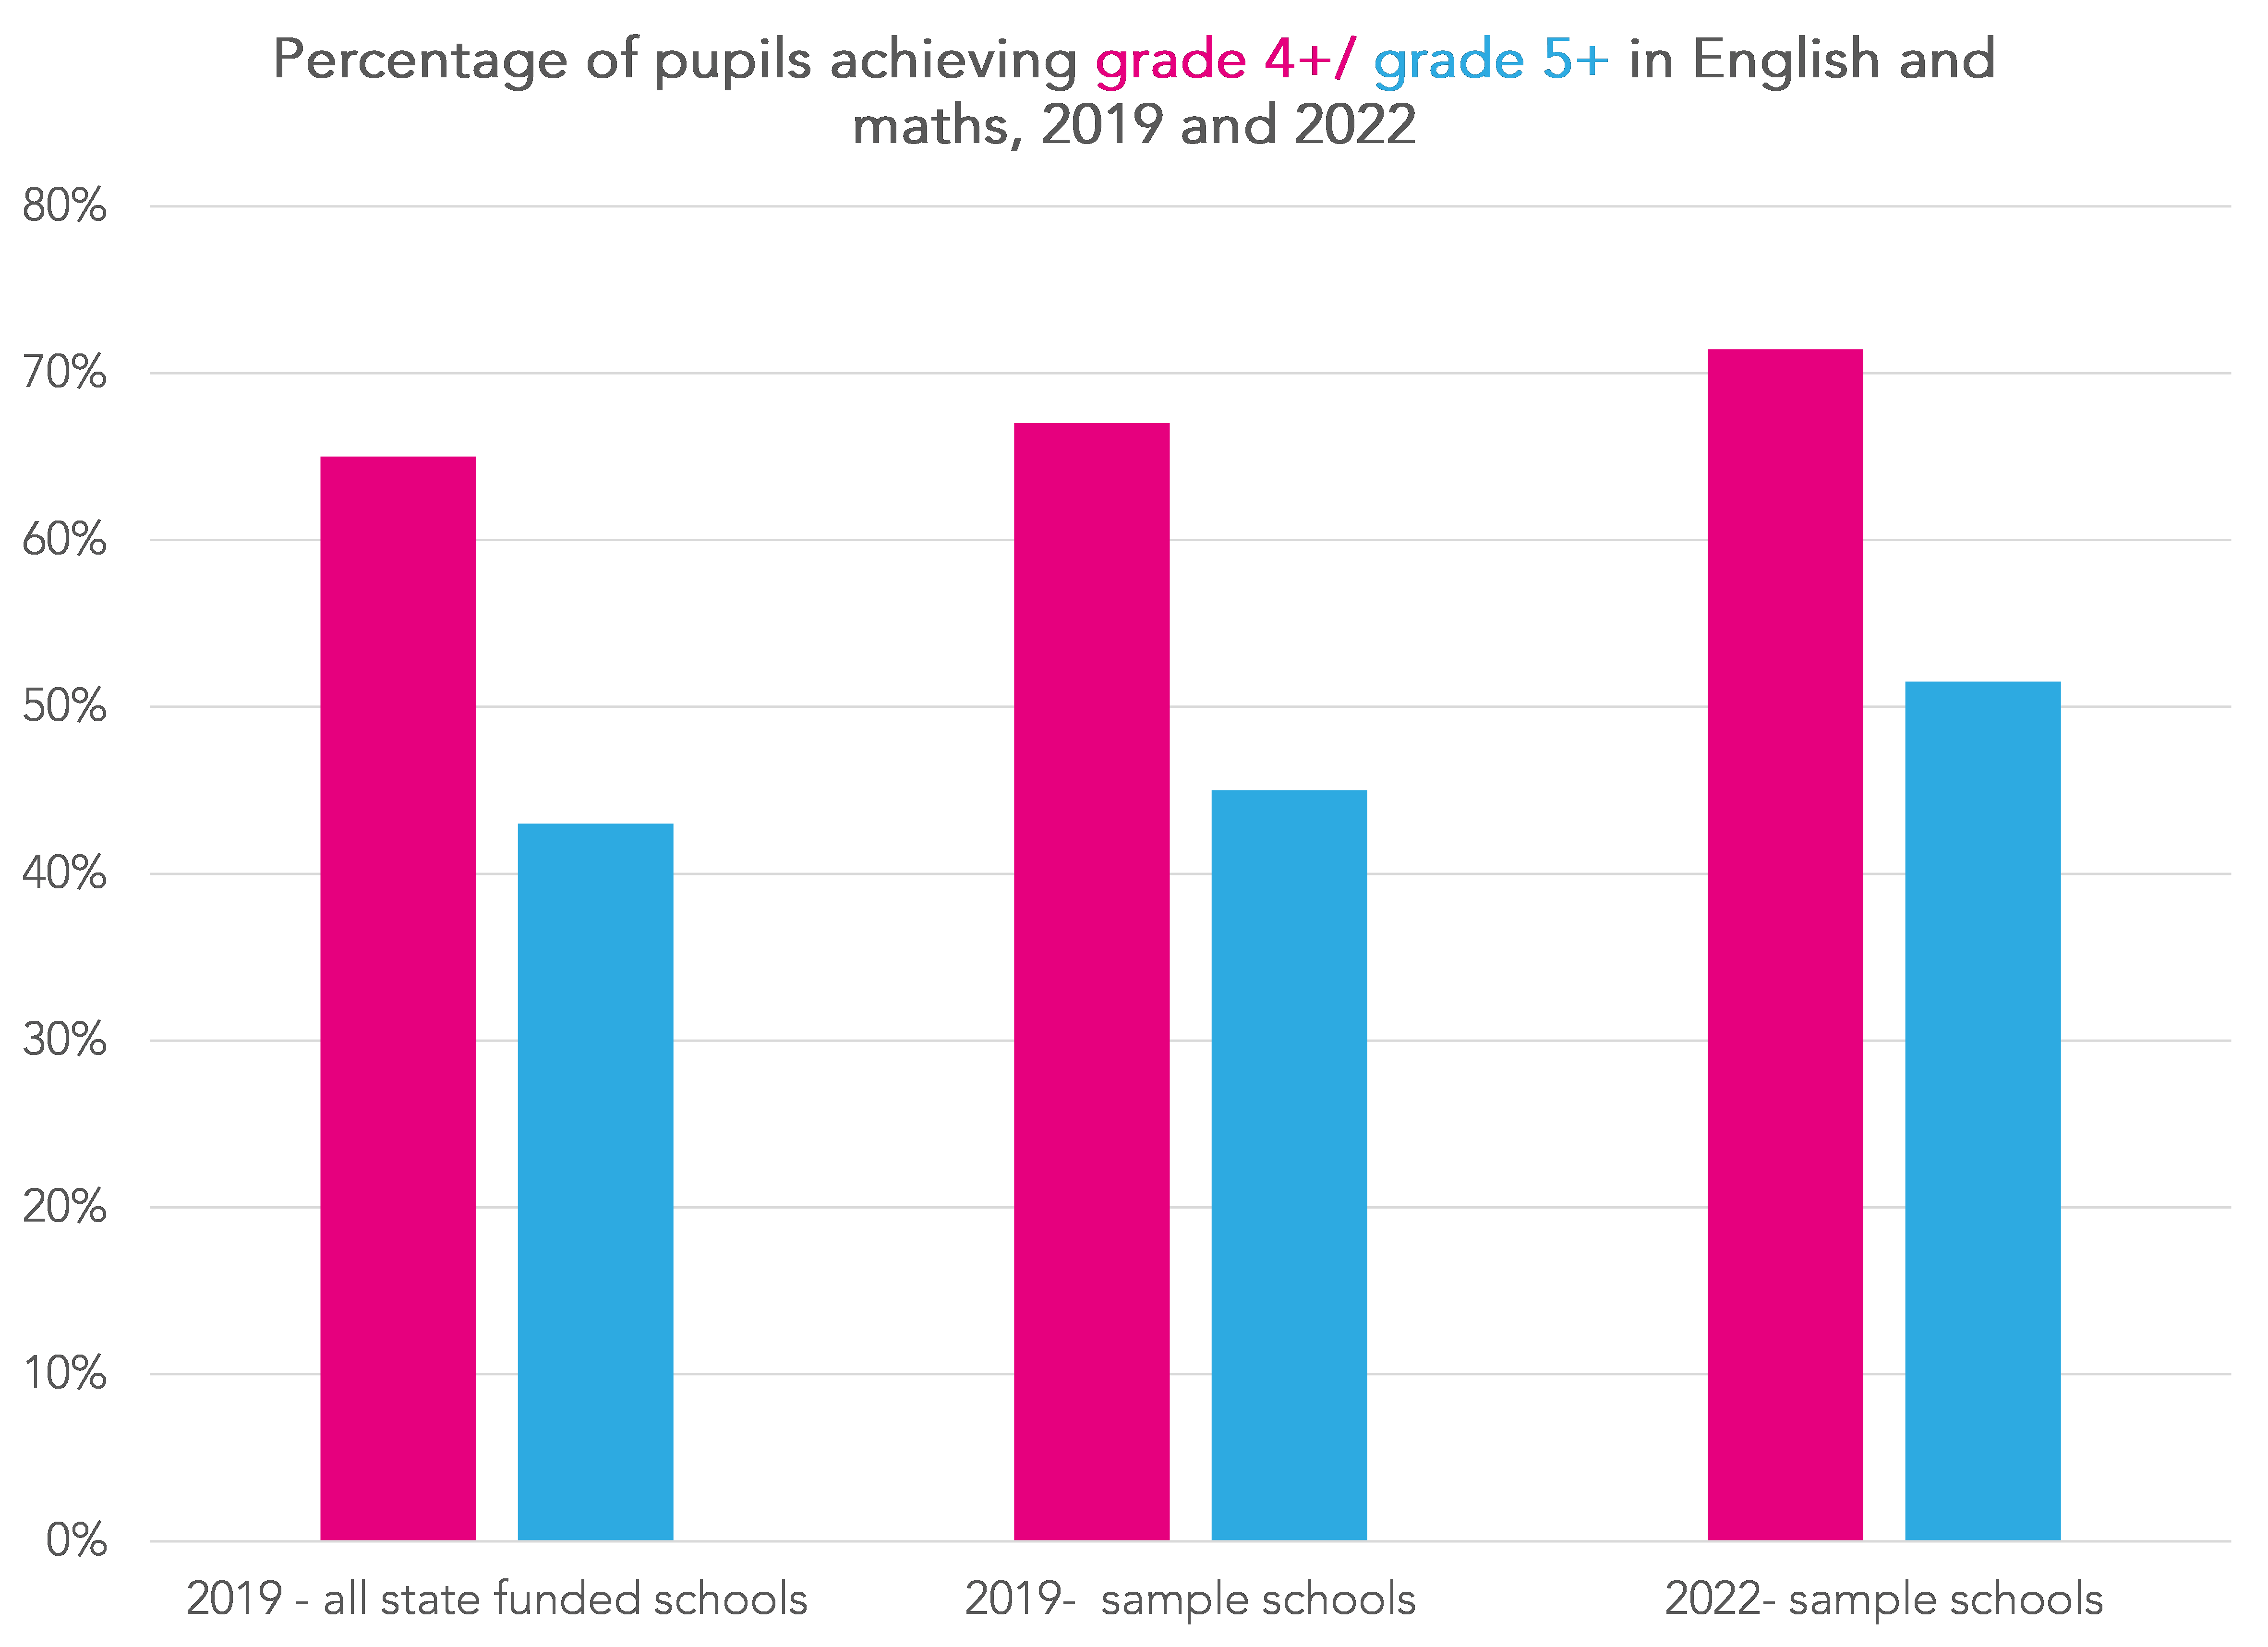
Based on 2019 data for this same set of schools, the percentage of pupils achieving grade 4 in English and maths has increased from 67% in 2019 to 71% in 2022.
The national average for all state-funded mainstream schools in 2019 was 66%. Therefore we might expect national averages for 2022 to be slightly lower than those presented above. Including special schools the 2019 national average stood at 65%.
Again based on 2019 data for this same set of schools, the percentage of pupils achieving grade 5 in English and maths has increased by a larger margin, from 45% in 2019 to 52% in 2022. The national average for all state-funded mainstream schools in 2019 was 44% (43% including special schools).
The average point score (APS) in EBacc subjects increased from 4.20 to 4.42, equivalent to between a fifth and a quarter of a grade.
Progress 8
No doubt many schools were keen to know their Progress 8 score for 2022 when they received their results last week.
However, to calculate it you need to know not only the GCSE and equivalent results (linked to Key Stage 2 results) of pupils at your school, you also need to know them for every other pupil in the country. DfE are currently working on assembling the data and running the calculations.
Provisional scores for 2022 will be released in early October. This will reflect an updated methodology which reflects the shift from Key Stage 2 tests measured using national curriculum test fine grades to scaled scores between 2015 and 2016.
It is highly likely that the methodology they use will be very similar to the existing method. The guidance to secondary school accountability from last year said that DfE would wait until this year to decide how to allocate scaled scores to prior attainment groups.
I imagine that they will calculate the average scaled score in reading and maths rounded to the nearest whole number. Pupils without scaled scores will be allocated notional scores based on teacher assessments in English and maths. Some grouping of scores will be necessary for the lower end of the distribution (scores of 85 or below) due to small numbers of pupils.
When Progress 8 scores are released, it’s worth bearing in mind two things
- It is not a measure of school effectiveness
- The Progress 8 scores of most schools aren’t that different
Progress 8 is a measure of the average attainment at each school adjusted for differences in prior attainment. In that sense, it is a much fairer measure than a simple (unadjusted) average attainment measure as it recognises that school intakes differ.
But Progress 8 is influenced by other factors that vary between school intakes, including levels of disadvantage, as we show here.
To isolate the effect of individual schools on pupil attainment we would need to adjust for other differences between schools. This might include resources, levels of parental support, access to tutoring and so forth.
Even if Progress 8 were a measure of school effectiveness, the scores of most schools aren’t that different. Tiny changes in score can lead to large changes in rank position.
Think about two schools, one with a score of 0.48 and one with a score of 0.38. What does the difference of 0.1 mean in terms of pupil attainment?
It’s the difference between two pupils (with the same level of prior attainment) one of whom has (for example) eight grade 6s and another who has seven grade 6s and one grade 5 [1].
In the context of grades only being reliable to one grade either way, that may not be a particularly meaningful difference.
And finally, there is more variation in pupil attainment between different subjects within schools than there is between schools.
[1] Assuming the grade 5 is not in either English or maths
Want to stay up-to-date with the latest research from FFT Education Datalab? Sign up to Datalab’s mailing list to get notifications about new blogposts, or to receive the team’s half-termly newsletter.

Leave A Comment