By Christopher Monckton of Brenchley
Amid all the fabricated panic about an imagined “climate emergency” caused by global warming, one fact will be found almost nowhere but here. As the totalitarians tighten their fell grip on all the news and internet media, any truth inconvenient enough to run counter to the ruthlessly-enforced Party Line is suppressed. Here, however, you will find the still, small voice of calm. Here is the truth. There has been no global warming – none at all – for 7 years 7 months. Yet, during that time, a significant fraction of the influence of humanity’s energetic industries and enterprises on the climate has occurred, without so much as a flicker of response from global mean surface temperature.

The revisionists are, of course, maintaining that long Pauses are exactly what one would expect even with an underlying warming trend. But they can only get away with that by saying that each Pause begins with a prominent el Niño Southern Oscillation warming in the tropical eastern Pacific, such as those which occurred in 2016 and, to a somewhat lesser extent, in 2020.
That, however, is an admission that, at least on the decadal scale, the natural variability of the climate is sufficient to mask the long-run trend. But it can only do that because the long-run warming trend is so very small. Here it is: just over half a Celsius degree per century:

“Aha!” they say, “But just look at the steepening of the trend from 1976 onward.” Well, yes, but did the CO2 concentration surge in the 1970s compared with previous decades? No: it continued to increase at much the same rate as before. It was another natural event – this time the Great Pacific Shift of 1976 – that coincided with, and inferentially had no small influence upon the more rapid increase in temperature over the 20 years to the late 1990s, when the trend leveled off to zero for almost 19 years, only to resume in the run-up to the Great El Niño of 2016, since when there has been no global warming at all.
As Willis Eschenbach has recently pointed out in one of his distinguished columns analysing the data, it is quite hard to detect any particular signal, whether natural or anthropogenic, once one describes that signal either as an absolute temperature (in which event the entire warming since 1850 amounts to an increase of less than 0.2% in global mean surface temperature) or as a trend plotted against the annual variability in regional temperature (in which event the trend is barely distinguishable from the noise). Willis rightly concludes that in a rational world this sort of common-sense perspective would apply.
My favorite example of a regional temperature record is the Central England record, which in fact encompasses almost all the English landmass, and has been kept since 1659. Here is that record since 1945:

Sure enough, the entire 1.1 C° warming trend since 1945 is not even a tenth of the annual variability. Global warming, then, is proving to be a non-event. There is simply not enough of it to justify the childish panic that has gripped those scientifically-illiterate politicians who, through craven fear of the unpersoning to which all of us who have dared to question the climate-Communist Party Line have been subjected, have failed to ask the rational questions that would at once expose the scam for the nonsense it is: immensely profitable to Messrs. Putin and Xi, whose agents of influence captured the environmental movement some decades ago, and just as immensely costly to the rest of us.
Now, one cannot expect anyone as cognitively challenged or as temperamentally totalitarian as Mr Biden, or anyone as scientifically challenged or as temperamentally totalitarian as Mr Johnson, to understand just what pseudo-scientific nonsense the climate-Communist case is. However, the White House has an army of advisors, and so – these days – does 10 Downing Street. When I was a policy wonk there in the Golden Age of Thatcher and Reagan and Pope John Paul II, there were just six of us in the Prime Minister’s policy unit. Now there are 43. Surely at least one of these effete drones can do an elementary macroeconomic analysis. Surely one of them can count how many beans make five. Hint: The answer is five.
Margaret Thatcher was sharp as a tack (but she was the exception). One method I used when explaining to the thicker sort of Minister (for he was the rule) what his proposed moonbeams-to-cucumbers policy would cost was to show how much an average family of four would have to pay for it.
So let us hold our noses and pretend that global warming will actually occur at the officially predicted midrange rate of 3 C° per century or per CO2 doubling (the two are about the same). Of course it won’t be anything like that much, but let us humor these nitwits.
IPeCaC’s current estimate is that every 4 units of radiative forcing will cause 3 degrees of eventual or equilibrium global warming. So each unit abated will abate three-quarters of a degree of warming that would otherwise have occurred. In the last three decades, between us we have all added just 1 unit of forcing in total, in more or less a straight line at one-thirtieth of a unit per year.
In the next 30 years, then, we should add another unit on business as usual. Therefore, if the whole world went from here to net-zero emissions by 2050 we should abate about half of that unit, and thus three-eighths of a degree of warming. With me so far, Minister? Here are some nice pretty counters, so that you can follow right along. If you pay attention, the Private Secretary will bring you some nice chocolate with your milk at teatime.
Trouble is, the whole world is not going to go to net zero by 2050. For the most striking feature common to the plethora of international treaties and agreements, accords and concordats and protocols about global warming is that every single one of them is directed solely at the West, using the flimsy pretext that our past sins of emission constitute a “historic climate debt”. Everyone else is exempt.
No, Minister, I’m not going to go into the strategic reasons why the Western economies have been made the sole targets of the climate treaties: you should have read the daily intelligence digest and attended the weekly briefings, but, like Mr Johnson and Mr Biden, you haven’t bothered.
Let’s play “Let’s Pretend”, Minister. Let’s pretend that the West accounts for as much as a third of all emissions, and that the West will actually reach net zero by 2050. No, of course it doesn’t and it won’t, Minister, but let’s pretend.
In that event, the warming abated by 2050, compared with what would have occurred on business as usual, will be just one-eighth of a degree. Yes, Minister, that’s right! One-eighth of a degree is one-third of three-eighths of a degree. Aren’t fractions exciting?
Now, Minister, let’s take Britain as an example of how much all this is going to cost. Britain emits about 1% of the world’s emissions each year. So our contribution to the West’s abatement of global warming would be 1% of three-eighths of a degree, or less than 1/250 degree. No, it isn’t a lot, Minister.
After correcting climatology’s elementary error of physics (they forgot the Sun was shining, Minister, and they added together the feedback responses from the Sun’s warmth and from warming by greenhouse gases and blamed them both on the greenhouse gases alone), the abatement of global warming by British net zero emissions would be not much more than a thousandth of a degree.
How much would that minuscule abatement cost us? That’s the right question, Minister. The Government’s climate change committee says £1 trillion (if you will believe it is as little as that, you will believe anything, as the Duke of Wellington used to say). The national grid corporation says £3 trillion. McKinsey, a leading consultancy firm, says £4 trillion, at a profoundly conservative estimate.
Let’s go with McKinsey’s figure. In that event, applying the UK abatement cost globally, abating the 3 degrees’ warming that IPCC predicts will occur over the 21st century would cost 3 times 1000 times £4 trillion. That’s £12 quadrillion, Minister.
Global annual GDP is £85 trillion, or £8.5 quadrillion over a century. Of course, were it not for the economic devastation caused by global net-zero emissions policies, GDP might be expected to grow over the century. But, as it is, the whole of global GDP, and then some, will have to be spent on emissions abatement. So nobody will be able to eat or do anything else. That’s how silly all this net-zero nonsense is.
There are 8 billion people in the world, or about 2 billion families of four. So the cost of global-warming abatement this century will be $6 million in total, or £60,000 a year, per family of four. In dollars, that’s $75,000 per year for each household, which comfortably exceeds the global mean annual household income.
Of course, none of that spending is in any way necessary because, after correcting climatology’s silly error of physics, there will not be enough global warming to do net harm. It will be net-beneficial.
So why are we doing any of this global-warming abatement? That, too, is the right question, Minister. It would be well worth your while to attend the intelligence briefings from now on. Then you’ll find out the answer. Well, all right, I’ll give you a clue: where do you think Mr Putin got enough billions over the decades to rebuild the Soviet armed forces that are now bogged down in Ukraine in pursuit of his special military massacre?
That’s right, Minister: sales of Siberian gas in ever larger quantities and at ever higher prices to nations that Putin’s agents of influence have persuaded to close down the competition from coal-fired power stations that used to generate electricity at not much more than quarter of the cost of gas. Did you really think that Greenpeace and Extinction Rebellion were genuine environmental groups? Don’t be silly, Minister.
And why do you think Mr Xi has spent so much time and effort buying up and controlling very nearly all the global output of lithium carbonate for electric buggies?
Now you’ve got it, Minister. The two most brutal Communist regimes in the world have been profiteering from Western governments’ woeful, wilful ignorance of elementary science and economics, and from Ministers’ fear of being unpersoned. Xi and Putin have been laughing all the way to the Moscow Narodny Bank.
Ought we to stop them by scrapping all this climate-emergency nonsense that they have so sedulously peddled, and by getting rid of the net-zero-emissions policies on both sides of the Atlantic?
Yes, Minister.
Deliberately ignoring math and economics is a requirement to be a green.
Tom, it is altogether possible that they aren’t ignoring math and economics, but rather that they are simply ignorant of math and economics. That would seem to apply to both Biden and BoJo neither of whom can apparently do simple arithmetic sums, let alone real math of the sort Monckton refers to.
Or, Rud, they are simply using a poorly crafted fictional crisis to seize power and wealth. I’m quite sure that the two fools in question (or their puppeteers) can do Rocko math (from the Edward G. Robinson villian in the Key Largo movie): they just want MORE.
It is also entirely possible that they, like Griff, are well aware of the economics and are doing this deliberately to destroy the Western economies.
I don’t think so.
The scientific denialism that is “climate science” is a monomania: they only tink of one thing, “global warming”, or “climate change”, or any of their aliases, and ignore everything else under the sky. They reduce everything to that one idea and it occupies all their minds, nothing left to process other ideas. So, for them math and economics are non-existent.
yes, deliberate…nothing fails like success. The west is done. Be interesting to see how many westerners will be allowed to live.
I would say – follow the money .
How will the Davis elite benefit .
Sell windmills and solar – then before it all collapses sell out and buy ( the now cheap and undervalued ) fossil fuel companies .
I don’t think they are ignoring the facts; they are scared of admitting that they have got it wrong and they think that admitting it will make them look silly which would never do.
But now we know who the script writer was for “Yes, Minister”.
Deliberately ignoring math and science are requirements for being a WUWT cultist denier.
This is weak even for you paid trolls. The drive by shootings from you CCCP employees never contain any math. Ignoring math and science is your forte.
Those who blindly accept the anti-science propaganda vomited daily by WUWT are the ones who ignore math and science, Harkle.
Are yes, and ignorance is a bliss for those who blindly follow others off the cliff.
Once again, the trolls declare that only those who agree with their religion are capable of doing science.
Care to actually refute anything written, or is that beyond your limited abilities?
All he knows are argumentative fallacies or religious dogma from the CAGW priests. He’s like the old tattered man on the street corner holding a cardboard sign saying “Repent”.
Tim, I’m just saying stop being bamboozled by pseudo-scientific WUWT propaganda and learn some real science for a change.
Perhaps you could show us what Mr. Monckton has gotten wrong in the case at hand, so as to demonstrate that you are here to save us from our bamboozlement? Talk is cheap as they say, and we will need to hear more than just insults to deliver us from our lack of panic over projected cataclysmic consequences incoming, which you apparently feel is preventable by the “West” becoming a sacrificial offering for our “sins of emission”.
To me, nobody special, you seem to be common mudslinger, doing your mudsling thing. Pffft
The issue is not that Monckton got the 91 month 0 C/decade trend wrong. It’s not wrong. I get the same result. The issue is that it is not any more or less meaningful than the +0.26 C/decade trend that is now 184 months long or the +0.13 C/decade trend that is 522 months long.
What he is definitely wrong about in these updates is his claim that the IPCC prediction from 30 years ago is 2x higher than what is observed. As I have been pointing out in the last couple of updates the IPCC prediction is pretty close and if anything they it appears they actually underestimated the warming slightly.
He is also wrong about the expectation of pauses. He implies that the existence of the pauses undermines model predictions. Except that models say pauses of this nature are common and expected. In fact, the CMIP5 prediction for the frequency of pauses is not significantly different than what is observed in the UAH data.
“What he is definitely wrong about in these updates is his claim that the IPCC prediction from 30 years ago is 2x higher than what is observed.”
So, nothing along the lines of what I actually asked for, then?
“Perhaps you could show us what Mr. Monckton has gotten wrong in the case at hand, so as to demonstrate that you are here to save us from our bamboozlement?”
Do you agree that it’s essentially meaningless for the “West” to spend many trillions to very slightly lower the eventual global temps (ASSUMING the climate modelers are doing something more than kidding themselves and/or us about the efficacy of their models)?
PS- I really don’t care about your claims otherwise, if you don’t provide at least some evidence that you’re not just playing word games. Why no quote of “the IPPC prediction from thirty years ago” that you’re referring to? Not doing so simply sparks my suspicion that you’re not self-aware enough to take seriously . .
John Larson said: “PS- I really don’t care about your claims otherwise, if you don’t provide at least some evidence that you’re not just playing word games. Why no quote of “the IPPC prediction from thirty years ago” that you’re referring to?”
The IPCC AR1 (FAR) WG1 Physical Science Basis report from 1990 is available here. Sometimes Monckton says the prediction is 2x higher than observed, sometimes 3x higher, and sometimes 6x higher depending on which post we look at.
Here is what the IPCC FAR actually said. In terms of emissions humans selected a path far below business-as-usual (scenario A). As of 2020 there was 413 ppm of CO2 which puts us a hair above scenario B but well below scenario A. There was 1900 ppb of CH4 which puts us right on scenario C. And there was 225 ppt of CFC11 which puts us well below scenario C/D. A big part of this is the result of the Montreal Protocol.

In terms of forcing for all GHG species via W/m2 humans selected a path even below D. Again, this is due in part to the Montreal Protocol.

Based on the information contained in the IPCC FAR a reasonable assignment of human behavior is scenario C. The warming the IPCC predicted for scenario C is 0.55 C. HadCRUT shows that it actually warmed 0.65 C from 1990 to 2020. Based on this the IPCC did not overestimate the warming by a factor of 6x, 3x, or even 2x but actually underestimated it by about 15%. Even if you think humans went down a course closer to B that would be about 0.65 C of warming as to the observed warming of about 0.65 C or nearly spot on.

John Larson said: “Do you agree that it’s essentially meaningless for the “West” to spend many trillions to very slightly lower the eventual global temps (ASSUMING the climate modelers are doing something more than kidding themselves and/or us about the efficacy of their models)?”
I have no idea. This is a policy related question which I have little knowledge to speak intelligently and have absolutely zero desire to do so anyway. I strongly dislike policy and politically oriented discussions and so I bow out when the discussion moves in that direction.
John Larson said: “PS- I really don’t care about your claims otherwise, if you don’t provide at least some evidence that you’re not just playing word games. Why no quote of “the IPPC prediction from thirty years ago” that you’re referring to?”
I’m just letting you know here that I posted a thorough response to this topic. It is currently pending approval by the moderators so it might not show up for a few hours. Usually the moderators let my posts through so I do expect it to show up eventually. If in the unlikely event they reject it I can see if I can post a screenshot as long as it does not violate WUWT policies.
“I have no idea. This is a policy related question which I have little knowledge to speak intelligently and have absolutely zero desire to do so anyway.”
Then why are you commenting here (to me of all people)? This article is clearly about policy, based on the ASSUMTION that what you seem to believe the IPCC got right, is right.
(And, the IPCC “predicting” that mild warming would happen by now if nothing much changed in terms of human CO2 emissions, is pretty much the same to me, as them agreeing with those who said/say that mild warming is to be expected in the natural course of things.
(YOU NEED TO SHOW SOME NONORDINARY THING WAS PREDICTED AND THEN CAME TO PASS, for me to even consider it scientifically relevant to much of anything ; )
PS. I am not aware of any claims Mr. Monckton made about the IPCC gang predicting too much warming (in realityland), but am aware of him claiming that they overstated the role that CO2 et al play in causing whatever warming occurs. A misuse/misunderstanding of “control theory” at a fundamental level, as I understand it.
Is it possible that you are conflating one sort of claim for the other?
John Larson said: “Then why are you commenting here (to me of all people)?”
Because you asked a question in good faith which I thought desired an answer in good faith. Generally speaking though I do so to discuss the Monckton Pause, relevant statistical techniques and their results when applied to the rest of the UAH data, and to participate in tangentially related scientific topics.
“Because you asked a question in good faith which I thought desired an answer in good faith.”
I did ask a question, but the question I asked was;
“Perhaps you could show us what Mr. Monckton has gotten wrong in the case at hand…”
?
And in the case at hand, Mr. Monckton said;
“That, however, is an admission that, at least on the decadal scale, the natural variability of the climate is sufficient to mask the long-run trend. But it can only do that because the long-run warming trend is so very small. Here it is: just over half a Celsius degree per century”
It seems to me, nobody special, that sans the now decades long alarm of impending doom sounding from the IPCC gang, the current “climate” situation would have been seen as a very good state of affairs. A relatively warm period, with relatively high CO2 levels. What’s not to like?
John, in another post I made in these comment threads, I outlined (in more detail than I will provide here) three things … at least … that Monckton got wrong:
1- Monckton’s claim of “no global warming … none at all … for 7 years 7 months” is wrong, because he considers only atmospheric warming. The vast majority of the warming heat content goes into the oceans, and they have not stopped accumulating heat at all.
2- Monckton’s claim that CO2 content in the air has been a “linear” increase since the 1970s is wrong. Current CO2 increase rate is over 2.5 times more than it was prior to the 1970s.
3- Monckton’s handwaving about ocean cycles shifts being a major factor in the atmospheric warming trend since the 1970’s is also wrong. The oceans have been accumulating heat, not dispersing it to the atmosphere. There is something else (CO2 influence) warming both air and ocean.
“John, in another post I made in these comment threads..”
That’s fine, I have no beef with people making arguments they think are germane to the post at hand, that’s the whole point of having comments at all . . but simply hurling insults on this post, without comment on this post, is not a good way to get people to believe you’re here to save anyone from potential bamboozling, I suggest. It looks like you’re not able to intelligently challenge what the author has presented, so you went “special snowflake” instead ; )
No bamboozling here. I gave you a whole list of reasons why. You didn’t refute any of them. You just used the argumentative fallacies of False Appeal to Authority and Argument by Dismissal to avoid actually having to come up with something as refutation.
That’s how con men work!
I see. And what are we denying exactly?
Get lost, smelly troll.
Oops, someone hit your button.
Cheer up and enjoy the nice weather!
Are you the same MGC who used to post lies on Yahoo! before they terminated comments because too many people were challenging their false narratives? The same fool who wrote that climate change would cause fresh water to become a scarce resource followed almost immediately by a post that claimed global warming would cause us to be inundated with rain? That fool?
How many times, Meab, are you going to reveal your shamefully willful ignorance with that same tired old stupid comment?
Climate change is producing more rain in some locations but less rain in others. We are already seeing exactly that: heavier and more extreme rainfall in the eastern U.S. (Hurricane Harvey for example) while the western U.S. remains in severe drought.
Why is it so difficult for you WUWT anti-science cultists to comprehend something so simple?
The largest areas of “severe drought” today are SEMI-ARID deserts! Places like central California and New Mexico!
There is a *reason* these places are identified as DESERTS! There is no “remains in severe drought” for these places. Non-drought conditions in these places are NOT the norm!
History didn’t just start the day you were born, you know, right?
More childish handwaving and pretending from Gorman. The trend in these locations is toward less and less rainfall and more and more drought … exactly as projected decades ago by those climate models that you foolishly pretend to be “inaccurate”.
Pick your period, pick your trend.
When the next “atmospheric river” comes to those places, you’ll tell us the mudslides are also ’caused by climate change,’ and insist the ‘models’ also predicted THAT.
“The trend in these locations is toward less and less rainfall and more and more drought
Once again since you apparently can’t read!
These areas are SEMI-ARID deserts! What does the word “desert” mean to you? A tropical paradise?
Why do you think the truck farms in central California are so dependent on irrigation and always have been?
from https://www.independent.com/2019/01/10/greening-sahara/
“The Sahara Desert, an expanse comparable in size to the U.S., is one of the hottest and most arid regions of the planet. Up until the 1990s, global warming seemed to be causing more frequent and severe Sahara droughts. But in the last three decades, a surprising transformation has been occurring: increased rainfall, more plant growth, and an overall greening of the desert.”
Like I said, you apparently think history began when you were born!
Wow are you stupid, Tim. I’m so embarrassed and ashamed for you.
Just because a region is already semi-arid and already has a relatively low amount of rainfall, that doesn’t mean that it can’t trend toward even more aridity and even less rainfall.
That’s what’s happening in the U.S. Southwest. Water resources that are already scarce there are becoming even more scarce. And what’s happening there is just as projections made decades ago said would happen. Projections made by those nefarious climate models that you lying WUWT cultists claim are “always wrong”.
And here you are now, wallowing in your intentional ignorance, apparently imagining that by just blindly babbling “bu bu bu bu bu bu water is already scarce there” that you can simply pretend away the trend in the U.S. Southwest toward even more water scarcity.
So deliberately dumb. But that’s what WUWT does to people.
Pure projection and abject fantasy.
Alleged tight water supplies in the Southwest, yet the golf courses use plenty of water.
The Southwest and West abuse their water supplies.
Those areas have minimal water available, yet the population is skyrocketing, cities are growing and confused Departments of Wildlife release scarce water for no real benefit.
Droughts in the Southwest are recorded as lasting centuries. The abundant, relatively, water of the 19th and 20th centuries are likely the peak of water supply, ever.
Yet, the things you refer to, are not climate!
They are simply weather events! Weather that comes from a chaotic atmospheric system.
Here’s AtheoK pretending (lying to himself) that the measured and proven fact of declining precipitation in the southwestern U.S., a fact that even his propaganda puppet master, Anthony Watts himself, admits is true in his latest book, is merely “pure projection and abject fantasy.”
Such tragic head in the sand foolishness.
Declining rainfall from a high normal for a semi-arid desert does *not* mean climate change. It is the natural variation of a semi-arid desert that has seen century long droughts in the past!
“It is the natural variation of a semi-arid desert”
BECAUSE I SAY SO!
BECAUSE I SAY SO!
BECAUSE I SAY SO!
Tim has zero evidence to demonstrate that it is “only” natural variation. None. Zilch. Zippo. Nada. Diddly-squat. Squa-doosh.
Moreover, Timmy Boy won’t bother to investigate why science professionals conclude otherwise, that a human influence is likely. He’s too devoted to being an intentionally ignorant and deliberately dumb anti-science propaganda puppet.
Maybe some day he’ll finally stop letting propaganda outlets like WUWT fill his head with anti-science disinformation and for the first time actually take a real and honest look at the scientific evidence.
You sound deranged and obsessed
I had to work in phoenix last summer. the greens had burned all the saguaro around the city. it was humid and raining. invasive water loving plants thriving in the bright green desert…it did not look like that in the 80’s…esp the population explosion
I can only ask one more time – what does the term “desert” mean to you? A tropical paradise?
G’Day MGC,
“The trend in these locations is toward less and less rainfall…”
I assume that you skipped primary and secondary school and went straight to university.
Primary school. Australia. In the 1950’s. We learned about the major deserts on the west coast of each of the continents. They have been deserts for many thousands of years, and will be deserts for many more thousands to come.
The fact that on one continent a major city was established in their desert has led to water problems. Rape the Owens Valley, steal water from the Colorado River and even northern California – and there’s talk of a desalinization plant – and the residents still get saddled with water restrictions. These are the folk bleating about climate change.
People living close to the other four deserts know better than to build a megalopolis in a desert.
There are several similar but different nuances in this topic that need to be separated from each other.
The first is the question of whether or not the U.S. Southwest has been becoming more arid and seeing less rainfall. It is a simple fact that this is indeed what has been happening, and is primarily what I’ve been trying to point out here. Tim Gorman has appeared to want to just hand wave this fact away.
The second question is the cause of water shortages in that region. Yes, putting major cities in that desert area is certainly one influence. But those who have researched the question conclude that less precipitation is the primary cause of the water shortages.
The third question is whether or not the lack of precipitation has been aggravated by human influence on the climate. Given that climate models projected decades ago that this scenario would be expected to happen, and further research evidence supports such a link, it is reasonable to assume that yes, human influence is likely a factor.
“The first is the question of whether or not the U.S. Southwest has been becoming more arid and seeing less rainfall.”
The answer is that the area is returning to its normal condition – all part of the natural variation of the area!
Of course it’s becoming more arid than it has been for the past 100 years! SO WHAT?
Like I’ve said before, for you history began when you were born. If an area is seeing less rain than when you were born then it is turning into a desert instead of returning to being a desert!
Translation of the latest Gormanian screed:
“It’s just natural variation of that area and is not aggravated in any way by human climatic influences … not because I have any actual data to support my claim, but merely BECAUSE I SAID SO”.
How pompously ridiculous.
Meanwhile, climate science professionals have valid scientific reasons, not just your infantile “because I said so” dogma, to conclude that human influence is a factor.
Maybe try for just once, just once, to climb out of your stinking cesspool of intentional ignorance and actually learn why the scientific professionals have reached their conclusions, instead of just blindly and ignorantly pretending it all away, merely so that you can continue to wallow in wanton ignorance.
Or try to become a major food source for a large nation! It’s why the truck farmers in central California are whining about declining irrigation supplies!
These areas have had droughts in the past that lasted for over 200 years. Yet you are proclaiming that several years of drought is proof of CO2. To think you actually claim that others are ignoring science.
Far too many people today, born after 1950, have lived too long in the life of luxury their entire lives and believe that history began when they were born. They have absolutely no clue about natural variation in weather and climate and they believe any kind of change in either represents a catastrophe.
Utter tosh.
Trends are unchanged as far back as records occur and even further back using proxies.
Natural cycles occur over decades and centuries.
You are the one waving hands and pretending.
Such a woeful parroting of the totally lying and wildly dishonest anti-science propaganda that WUWT vomits into the empty skulls of its sheeplike followers.
Here are a few refutations of this insolent lying garbage:
“No rising trends in rainfall. No rising trends in storms”
NOAA data demonstrates otherwise. There’s been a clear trend upward in precipitation and in more extreme precipitation. Even your propaganda puppet master, Anthony Watts himself, admits in his latest book that there’s been more precipitation.
“cold fronts still arrive every winter”
They arrive later and later every year and disappear sooner and sooner.
“Arctic sea ice is not disappearing or even declining beyond the annual melt cycle.”
Pure 100% outright LYING. Check data at NSIDC.
“There are glaciers accumulating ice.”
The vast majority of glaciers worldwide are not only losing mass, but the loss is accelerating.
“Oceans are not warming.”
Another blatant LIE. Check data at NOAA global ocean heat content.
“NOAA data demonstrates otherwise. There’s been a clear trend upward in precipitation and in more extreme precipitation. “
Then why are you also claiming increasing desertification? You seem to want your cake and to eat it too.
Whatever works at the time, right?
““cold fronts still arrive every winter”
They arrive later and later every year and disappear sooner and sooner.”
And yet the total heat accumulation over the expanded growing season is stagnant or declining. Meaning maximum temperatures are *not* growing. So how is earth turning into a cinder?
“Then why are you also claiming increasing desertification? ”
How many times are you going to play the intentionally ignorant Gormanian troll and blindly trot out this stupid “objection” that has already been refuted countless times? Why?
Oh never mind. We both know why. Actually acknowledging the answer to your “objection” would mean that your fairy tale fantasy world of denier delusions would come crashing down at your feet. And we can’t have THAT now, can we? Oh my, no!
G’Day again MGC
“Such a woeful parroting of the totally lying and wildly dishonest anti-science propaganda that WUWT vomits into the empty skulls of its sheeplike followers.”
There’s a book by Dale Carnegie published in 1936 – you might care to read it.
G’Day again Gabby.
I’ve read Carnegie’s book. I guess that stating the simple honest truth amidst this sea of tragic WUWT dishonesty is what is more important to me, regardless whether or not it “wins friends”. But thanks for the suggestion anyway.
G’Dy MGC,
“wins friends”
I was really thinking of the “… Influence People.” part of the title.
Who reads articles on this site? Michael Mann’s Twitter account has on occasion revealed that he is aware of the articles here.
Ah yes, the old, any change, no matter how minor, is the result of CO2 argument.
No need to actually prove any linkage, just make the claim and the taxpayer money rolls in.
There is nothing happening that is outside the range of what has happened before.
Because records are available that prove those alleged “more extreme” events are perfectly natural.
In Hurricane Harvey, alarmists ignore the fact that the location cited did not record rainfall until late 20th century. It’s known as “cherry picking”
Just a few miles away, rainfall records dating back to the 1800s clearly showed the rainfall was not unusual.
”
Climate change is producing more rain in some locations but less rain in others.”
Wrong.
A critical assessment of extreme events trends in times of global warming
The European Physical Journal Plus volume
AbstractThis article reviews recent bibliography on time series of some extreme weather events and related response indicators in order to understand whether an increase in intensity and/or frequency is detectable. The most robust global changes in climate extremes are found in yearly values of heatwaves (number of days, maximum duration and cumulated heat), while global trends in heatwave intensity are not significant. Daily precipitation intensity and extreme precipitation frequency are stationary in the main part of the weather stations. Trend analysis of the time series of tropical cyclones show a substantial temporal invariance and the same is true for tornadoes in the USA. At the same time, the impact of warming on surface wind speed remains unclear. The analysis is then extended to some global response indicators of extreme meteorological events, namely natural disasters, floods, droughts, ecosystem productivity and yields of the four main crops (maize, rice, soybean and wheat). None of these response indicators show a clear positive trend of extreme events. In conclusion on the basis of observational data, the climate crisis that, according to many sources, we are experiencing today, is not evident yet. It would be nevertheless extremely important to define mitigation and adaptation strategies that take into account current trends.
west = desert, east = forest…i’d expect more rain in the east, please produce data to refute this real world observation
We cultists ignoring math? That’s rich, considering, they don’t even teach math and physics to “climate scientists”. Anybody that believes .04% of the atmosphere controls the other 99.96% is inumerate.
Yet another blind parroting of such an intentionally ignorant denier meme.
Small amounts of particular substances most certainly can have huge influences. Try, for example, Slowroll, to put .04% cyanide in your bloodstream, and then come back and share your results with us.
Oh never mind. You’d be dead.
Here’s reality, pal: it’s been known scientific fact since the 19th century that even this small amount of CO2 acts to control atmospheric temperatures. Pretending otherwise is every bit as stupid as pretending that oxygen “doesn’t” support combustion.
Totally bogus analogy.
No one in their right mind consider CO₂ a poison.
I see you totally missed the point, AtheoK, which was that small amounts of certain substances can and do have large influences.
stop driving, stop, flying and stop eating…that should be a small change that saves the world
Not all small changes have large influences, meiggs. Duh.
The problem with people like you MGC is that you have swallowed the so called science and have become a useful (useless ) idiot parroting these lies and propaganda that the western world has been bombarded with for the last 35 years .
The effect of CO2 on rising temperature is logarithmic .
This fact is dismissed by many climate scientists of late but it has been a well know fact since the early 1900s .
The first 100 parts per million of CO2 in the atmosphere warms the atmosphere twice as much as the second 100 ppm .
At 410 ppm the atmosphere is virtually saturated and very little if any warming will result from further increases .
It is well past the time when western countries should put”‘climate change global warming ” aside and focus on looking after their populations welfare .
There is a looming threat of food shortages around the world caused by the war in Ukraine and the soaring costs of fertilizes and fuel in many countries .
Electricity and fuel shortages and rocketing prices will hurt many in countries in the next two years caused by very poor decision making by those in charge .
Why all this nonsense of de carbonizing western countries when other countries are increasing their use of fossil fuels ?
Mount Tambora released 100 MtSO2 in 1815. It caused the year without a summer in 1816. 100 MtSO2 is only 0.000002% of the atmosphere yet the effect was indisputably dramatic.
The early 1800’s were characterised by extremely low temperatures – 1814 is in the top 10 lowest average temperatures; without that as a basis, the mount Tambora eruption wouldn’t have been anywhere near as bad. And yet, although 1816 was known as the year without a summer, the effects were pretty much done and dusted in less than a year. So yes, tell me of this dramatic and catastrophic phenomenon please?
Catastrophic is your word; not mine. Anyway, what more would you like to know about the Tambora eruption and/or SO2?
Richard Page disputed your claim and you resort to twisting words in an attempt to evade a proper response.
Utter BS from budgerigarwx.
Is there a serious peer reviewed dispute of the Tambora eruption effects?
If anyone is twisting words here it is Richard Page. I never used the word catastrophic in my post. That came from him and him alone. Just because he insinuated that I said it does not mean that I actually said it. If that is not twisting words then I don’t know what is.
Frost on the western US on May 9.
https://earth.nullschool.net/#2022/05/09/1200Z/wind/surface/level/overlay=temp/orthographic=-99.86,45.33,1417
My plants are way behind this year. Knock on wood, the frosts aren’t hard ones.
The temperature everywhere can be 10C different year on year for any calendar date.
That’s 10 x the warming.
That’s 100 x the rate of change.
And everything, nature and society, adapts just fine.
So why should a smaller and much slower change be newsworthy?
It isn’t for normal people like you & me. For megalomaniacs with a lame excuse to expand
their power, it’s much needed to promote fear & moral self-righteousness!
“IPeCaC’s current estimate is that every 4 units of radiative forcing will cause 3 degrees …”
Prima facia absurd and it’s a crime against physics that this deception has been allowed to go on for so long.
This increases the surface emissions from about 390 w/m^2 at 288K to 412 w/m^2 at 292K for an increase of 22.2 w/m^2, or the equivalent of 22.2 units of radiant response or 5.6 units of radiant response per unit of radiant forcing. The only radiant forcing resulting in the 390 w/m^2 of radiant response is the 240 w/m^2 of post albedo solar input which results in about 1.62 units of radiant response per unit of radiant forcing.
How does the climate system tell the next unit of radiant forcing from the average unit of radiant forcing so that the radiant response can be about 3.5 times larger, especially since the basic physical unit of both the radiant forcing and the resulting radiant response is the Joule whose behavior is otherwise bound by COE?
“My favorite example of a regional temperature record is the Central England record, which in fact encompasses almost all the English landmass, and has been kept since 1659.”
The CET does not encompass almost all the English landmass, nor has it been kept since 1659, but apart from that I agree, it’s a useful reconstruction.
Here’s the entire reconstruction from 1659 clearly showing that the Maunder Minimum was a non-event.
Be aware that low solar activity brings changes to the ozone zone. Therefore, the temperature drop occurs in the winter season when the stratospheric polar vortex merges with the troposphere.
Do you mean England or Great Britain? I’m pretty sure Monckton of Brenchley knows the difference, I’m not sure about anyone else.
I mean England. The CET has always represented an idealized concept of Central England, not “almost all the English land mass”.
The Met Office uses three weather stations to record the Central England Temperature: Stonyhurst (Lancashire) north of Manchester, Pershore (Worcestershire) between Worcester and Gloucester and Rothamsted (Hertfordshire) Just north of London.
So the modern CET covers a large area in England. I can’t claim to have any knowledge of the time frame those stations have been in use.
The three CET sites cover much of England. They’re in Lancashire, Worcestershire and Hertfordshire.
All suffer from the urban heat island effect.
The Maunder does show up, as well as the Dalton Minimum.
Warming of 1.1 degree C in 363 years is nothing to get worked up about, especially since urbanization, deforestation and agricultural changes swamp out any CO2 effect.
Yes, that’s the case since the Met Office started running it. Three stations are not most of England.
“The Maunder does show up, as well as the Dalton Minimum.”
As does the warming during the 20th century, but you’d have to really squint to find them amongst the seasonal cycle.
“Warming of 1.1 degree C in 363 years is nothing to get worked up about, especially since urbanization, deforestation and agricultural changes swamp out any CO2 effect.”
Who says I’m getting worked up about it? I just like graphs that inform rather than obscure. The claim is that 1°C is irrelevant when compared with the difference between winter and summer – but by that logic the 1690s weren’t anything to get worked up about.
Here’s a graph that makes CET changes clearer, showing a 10 year moving average.
And yet MN in the US recorded its 4th coldest April evah….and the CO2 continues to grow from China.
The Minnesotans for Global Warming were hot for a while. Miss them.
Minnesota is not encompassed by CET
The 10 year moving average clearly shows a 200 year long hiatus. Now thats what I call a hiatus.
What are you going on about, “it’s not all of England.” I live in Manchester(much warmer than the towns just outside, by the way) and let me tell you England is tiny and if you cover from Herts to Lancashire you have covered most of the country. Yes, its not Devon and Cornwall or the Lake District or freezing Newcastle (on shore wind, ouch) but it is about averages. There is nowhere in England really cold, nor is there anywhere in England really warm, that’s why temps are easy to measure as they don’t change that much. If we hit 30C the world is coming to an end and if we hit -5C you know it has ended… lol
Just had a look for you Americans..
England is the same size as New York State
True. NYS is about 10% larger than England. NYS and PA combined are about 10% larger than Great Britain.
It’s amazing to think Pennsylvania (along with Delaware) was granted to William Penn to pay a royal debt!
It does not encompass nearly all the English landmass. I know how tiny England is, I live here myself, but that doesn’t mean an area from London to Lancashire is nearly all of it.
Dunno – those were some bloody cold winters, way back then.
Hope they don’t come back.
Update prepared by:
Climate Prediction Center / NCEP
2 May 2022
It looks like there is a really good chance that the JAS season could stay below -0.5 which would be the first time there was 3 consecutive years in the same season of a La Nina in the UAH period of record.
Wait…that’s not right. It did happen one other time before: 99, 00, and 01.
The question is, when will the current La Niña end?
Yes, during LaNina events the earth GAINS energy and a big part will released during the next ElNino. One can see this energy in the IPWP in the depth down to 250 m:

Yes, but when will that happen when too little energy is reaching the western equatorial Pacific?
http://www.bom.gov.au/archive/oceanography/ocean_anals/IDYOC007/IDYOC007.202205.gif
Look at the temperature of the Peruvian Current.
Yep. There is a significant amount of heat locked and loaded. Once ENSO switches from negative to positive it will get released into the atmosphere.
Haha that’s absolutely hilarious, and incredibly misanthropic; the heat simply isn’t there – there is little or no increased ocean heat content, but if there were then being gleeful about it being released in one big meltdown with the casualties that would entail is pretty horrific.
RP said: “there is little or no increased ocean heat content”
Cheng et al. 2022
RP said: “but if there were then being gleeful about it being released in one big meltdown with the casualties that would entail is pretty horrific.”
I’ve not seen any evidence that transient ENSO related energy releases would lead to excess casualties or be horrific. The most likely bump in temperature during the next strong El Nino would only be expected to be maybe 0.1-0.2 C above the 2016 value assuming it occurs on or around 2026.
Better get used to Noth Atlantic cooling because it’s here to stay for a long down cycle, at least compared to political, promotional, and advocacy lifespans.
The Aztec’s applied human sacrifice in an attempt to change the weather. The modern approach is to sacrifice science. Neither is very effective.
Nice one, very true
The Aztecs – “Most People I Know Think That I’m Crazy”
The first concert I went to in the seventies at the town hall in Melbourne.
Loud? My ears rang for a week….
The sacrifice of science was a gambit. They’re looking to checkmate Western Civilization.
In case anyone wants to see it visualized. I just have it handy.
The five little circles on the right side are just the last five data points so I can see them easily.
Here
I love the overlap between the two pauses. The best part of a year were the glob was simultaneously in two different pauses, with 0.24°C between them.
It does give support to the conjecture of steady temperatures with sharp jumps in between. A “punctuated equilibrium”, to borrow a phrase from the evolutionary biologists.
Just eyeballing the graph you can see several extended negative Simpson’s Paradox trends embedded in the overall trend.
Clearly the peak of a wave. Just like all the others before it. It won’t get any warmer than it is now.
Mike says: “It won’t get any warmer than it is now”
That’s what the delusional denier cabal said in 1979, and again in 1982, and then again in 1989, and again in 1995, and then in 1997, and again in 2007, and again in 2014. And they were wrong every time.
You’d think that the denier cabal would have learned their lesson after a while. But no. They’ve tragically remained intentionally ignorant and deliberately dumb.
You don’t really think there is a past do you.
The 60 year peak is just about over. Bobbing around for a few more years, maybe even 10, not warming, not cooling. After that guess what? The global warmening scare will be over the hill. But maybe you’re right! Maybe co2 will override all that! 🙂
By the way, the 250 year cycle can be seen here.
Those “cycles” are no different than make believe astrology, Mikey Mike. They have zero physical basis and are nothing but purely pseudo-scientific handwaving conjecture.
You mean like CO2 induced warming?
Another anti-science troll has spoken. Even your propaganda puppet master, Anthony Watts himself, admits that CO2 induced warming is more or less real, scientifically proven fact.
<sigh> look CO2 can cause an increase in temperature… please note the ‘can’ but it is really a minor factor. The main issue is increases in water vapor in the atmosphere which SO FAR have been given a positive feedback. However that positive feedback is very tenuous and may be mitigated by a variety of other factors.
I have been studying this for over 30 years now. I am less concerned about CO2 than I am about people who have been using this as a scare tactic to gain fame/money.
If we REALLY wanted to fix this we would lay down a bunch of Nukes and use energy from those. It is not that ‘green’ energy is bad – it is that it is inconstant. Solar is a great offset for peek summer usage, but wind sucks because it is not consistent.
People point out that the ‘price’ of solar and wind is the same as nuclear… which is wrong but even if they were correct on that point the difference is CONSISTANCY.
So if we were being RATIONAL about moving away from a carbon based economy. I would be indifferent. This is not the case, nor are the plans where the Western world moves away from Carbon but India and China embrace it 3X times where we were helpful either.
Finally I will say this. We use proxy data in our ‘temperature series’ and then interlay REAL temperature data and then mix in satellite data. Have you ever asked WHY they do not simply compare proxy to current proxy? Of course you don’t you simply look at the hockey stick and say ‘ah hah’ but I am skeptical of data being fed to me by others. Double so when they make claims of doom and gloom. All to often they are selling you something.
Look – stop being antagonistic and engage with people. I realize others are being antagonistic as well. Don’t simply post a ‘gotcha’ because often times there are disputes about multiple issues with that data.
For instance in the last 12,000 years the water has been up to 9 feet higher than today. Do you dispute this? There have been multiple studies done about this from across the globe with the same findings… Do you dispute ‘science’. Of course you don’t but please pray tell HOW can there have been more water with a lower temperature?
This is not meant to box you in but rather to simply say that there are honest people who see this kind of information and have real earnest questions about a narrative about there only being one cause of the current warming.
Finally you are correct that few people are saying CO2 cannot cause a miniscule amount of warming. Rather that the amount of warming, the benefits to society, the belief that it is ‘the control knob’ for the temperature of the planet ARE in question. That this low amount of warming – if not for other factors, would normally be ignored except for the politicization of the science.
Climate Change can be used for EVERY CHANGE – for instance the western semi arid regions of the USA are drying out. Or if they were getting wetter. Or really ANYTHING. Of course these areas ALWAYS have gone through these patterns so using ‘Climate Change’ as a way to explain it really gets on my nerves. It is SLOPPY.
Anyway cheers my antagonistic friend. Know that I am a member of a cult according to you… But I can throw that right back at you because the way in which you parrot things in order to ‘show you are correct’ bothers me greatly.
Hey there Forrest:
An interesting post. I have a few comments, mostly along the lines of just trying to promote an accurate agreement on what is known via the research data:
(1) “positive feedback is very tenuous and may be mitigated by a variety of other factors”
If one reads the published scientific research, there is essentially no doubt that feedback is net positive. The only real question is how big net positive.
(2) “WHY they do not simply compare proxy to current proxy?”
They do. How do you think they figured out historic proxies to begin with?
(3) “if we were being RATIONAL about moving away from a carbon based economy …”
I agree that there needs to be greater focus on understanding how to move quickly away from fossil fuels in a “rational” manner.
(4) “I am skeptical of data being fed to me by others”
I am skeptical of those who have no valid evidence nor rational scientific basis for said skepticism.
(5) “in the last 12,000 years the water has been up to 9 feet higher than today. Do you dispute this? please pray tell HOW can there have been more water with a lower temperature?”
I’d need to see a reference to substantiate the 9 feet higher claim, but I’ll assume it is valid. So let me ask: are you saying that we shouldn’t bother about us possibly causing 9 feet of sea level rise (or more) ourselves … that we also have the power to mitigate … simply because it has happened before?
(6) “real earnest questions about a narrative about there only being one cause of the current warming … the beliefs that it (CO2) is ‘the control knob’ for the temperature of the planet ARE in question”
The scientific research evidence is by now so strong, that among all the major scientific organizations on the entire planet, there is essentially no question on this point. None. Of course there are other ancillary influences, but all the evidence points directly to the primary overwhelming influence for what is happening right now as being human CO2.
So I’m sorry, but no, because the evidence is so strong, I do not see these as genuinely “earnest” questions. And to quote someone: “that really gets on my nerves. It is SLOPPY.”
(7) Climate Change can be used for EVERY CHANGE – for instance the western semi arid regions of the USA are drying out. Or if they were getting wetter. Or really ANYTHING.
I agree that sometimes media coverage overdoes links of certain events to climate change. But one cannot scientifically link “anything” to climate change, because specific projections were already made decades ago on many of these things. One for example was that the western U.S. would become drier. Now, if it were actually becoming wetter, clearly something would be amiss.
(8) “this low amount of warming – if not for other factors, would normally be ignored except for the politicization of the science.”
It is not a “low” amount of warming. It is enough, for instance, if it continues as projected, to raise sea levels over the next couple of centuries by perhaps as much, or even more than, that 9 foot mark we just discussed.
Anyway, cheers, my “cult” friend! LOL.
”I am skeptical of those who have no valid evidence nor rational scientific basis for said skepticism.”
Lordy lordy. You think that the current warming, being absolutely nothing unusual from the past natural ups and downs of global temperatures as evidenced by oceans of observations, written history and proxy data, is no rational basis for skepticism about the current milding?
MGC only knows his religious dogma. History began for him when he was born, natural variation doesn’t exist in his history.
Decades of carefully measured evidence all point directly at human CO2 as the major cause of current warming. Handwaving “objections” that refer to past climate changes do not in any way change any of that measurement data.
These “bu bu bu bu what about the past” so-called “objections” are as every bit as silly as this scenario:
You go see your doctor because you’ve had headaches. The doctor does some tests and finds that you have a brain tumor. Your “response” is: “but I’ve had headaches for other reasons before. Therefore I have ‘good reason’ to be skeptical of your evidence that shows I have a brain tumor.”
Good argument!
“If one reads the published scientific research, there is essentially no doubt that feedback is net positive. The only real question is how big net positive.”
Net positive feedback *ALWAYS* leads eventually to runaway. Which is what the CAGW proponents are actually saying is what we are seeing today, backed up by climate models that show linear temperature increases for the future.
In an electronic circuit, runaway is limited by the power supply. In a control circuit, runaway is limited by physical movement, e.g. the hydraulic actuator reaches the limit of its movement.
What limits the temperature rise in the climate models? Certainly not the available energy from the sun!
Feedback in a stable system has to be less than or equal to zero. Being less than zero does *not* mean the output is being driven to zero, e.g. temperature. It merely means the output is being driven to a stable value. Since the earth has been in a relatively stable for known history the only conclusion that can be reached is that net feedback is less than zero. Natural variation comes from the response time of the feedback loop being relatively slow, perhaps even in units of centuries or more.
If you believe the net feedback in the biosphere we know as Earth is net positive then you are definitely in the CAGW camp that believes Earth is going to turn into a cinder. There is no other conclusion that can be reached with such a belief.
Tim demonstrates that he doesn’t have any clear understanding of what “positive feedback” actually means within the context of climate change.
I had this same go ’round with that other Gormanian ignoramus. Yes, there’s a “negative feedback” which kicks in … eventually … which limits the warming from the positive feedbacks. But that negative feedback takes a while to become large enough to halt the positive feedbacks.
Anyone who has any understanding of basic physics should immediately realize what this longer term negative feedback is. That other Gormanian fool, however, didn’t know what it was, and never bothered to do any research to figure out what it was.
This second Gormanian fool probably doesn’t know what it is either, LOL.
And once again you put your foot in your mouth!
The gain equation for a system with positive feedback is:
A_f = A / (1-AB) where
A_f is the gain with feedback, A is gain without feedback, and B is the feedback percentage.
As the product AB approaches one A_f goes to infiinty, i.e. runaway!
That is *NOT* what you said! You spoke of no limit or the existence of negative feedback.
You said: “there is essentially no doubt that feedback is net positive. The only real question is how big net positive.””
And now all you can do is run away from what you said and try to denigrate those that show how you are wrong.
Apparently *YOU DON’T”! Especially since you can’t tell us when it will kick in and make net feedback net negative!
The only one you are fooling is yourself. You really don’t know much except argumentative fallacies.
More ignorant obfuscation from the Gormanian fool. Just like the other Gormanian fool.
Whenever positive feedback exists, there is also a negative feedback which will grow over time, which eventually puts a stop to the warming due to the positive feedback. But within the context of climate change, the positive feedback is the only one that is really talked about, since it is the one that drives everything. The negative feedback only operates in response to the positive feedback. Sorry that you are too intentionally ignorant to have known any of this.
“you can’t tell us when it will kick in and make net feedback net negative”
More ignorance. It does not “make net feedback negative”. It just balances out positive feedback (eventually) and brings warming to a halt.
And of course I could immediately tell you everything about the very simple physics that I’m talking about here, but its just too much fun watching you blindly blather away and so comically demonstrate your lack of understanding, LOL.
Do you have any idea how utterly ridiculous this all makes you look? No, of course you don’t. You clearly demonstrate that you really haven’t the first clue, yet you still want to pretend that you (ha ha ha ha ha!) “know better” about climate science than scientific professionals all over the world.
When will you at long last stop playing the deliberately dumb WUWT propaganda swallowing puppet?
” CO2 induced warming is more or less real,”
More or less. What’s ”less” mean and what does ”more” mean?
I think them there is meaningless words.
“more or less” in this context means “as much as Anthony Watts is grudgingly willing to admit, given his role as an egregiously disingenuous purveyor of pseudo-scientific climate change disinformation.”
Says the guy who’s convinced that every wiggle in the data is proof that CO2 is going to kill us all.
Thanks for demonstrating yet again MarkW, that you have nothing even remotely intelligent to add.
Never ever extrapolate a bipolar fit! Try to do it for the past and you’ll find the year it boiled on earth! 😀
What happened to the global cooling and subsequent ice age that your mob were predicting in the 1970s?
It’s almost as if you eco-fanatics haven’t got a clue, isn’t it?
Here we go again with another tired old, long refuted denier falsehood, the so-called 1970’s global cooling “predictions” meme.
Here’s reality, pal:
THE MYTH OF THE 1970s GLOBAL COOLING SCIENTIFIC CONSENSUS
Peterson et al
Journal of the American Meteorological Society Sept. 2008
“An enduring popular myth suggests that in the 1970s the climate science community was predicting “global cooling” and an “imminent” ice age, an observation frequently used by those who would undermine what climate scientists say today about the prospect of global warming. A review of the literature suggests that, on the contrary, greenhouse warming even then dominated scientists’ thinking as being one of the most important forces shaping Earth’s climate on human time scales. More importantly than showing the falsehood of the myth, this review describes how scientists of the time built the foundation on which the cohesive enterprise of modern climate science now rests.”
https://journals.ametsoc.org/doi/10.1175/2008BAMS2370.1
I lived and read news during the 1970s. They were indeed warning loudly about another ice age.
re: “I lived and read news during the 1970s”
So did I, slowroll. So did I. The popular press may have spoken about another ice age, but the majority of the scientific literature was not. Try reading the reference I provided and learn what actual science was saying even back then.
By the way, you denier cultists always seem to forget to include (no doubt intentionally) why there was even talk back then about another ice age. It was because we were putting so much smoke and dirt and smog into the air, and if we continued, it might eventually block out a significant portion of sunlight.
Maybe you haven’t noticed, but over the past several decades we’ve pretty much stopped doing that.
The only reason the “majority of the scientific literature” speaks about human-induced global warming now is because the “scientific literature” no longer lives up to its name.
Yet another fairy tale make believe “Nuh Uh because I say so” spew of wanton ignorance, fueled by the ludicrous conspiracy theory clap trap vomited daily by your WUWT propaganda puppet masters.
Wrong again, mgc.
A) you just admitted there was a 1970s cooling scare.
B) your alleged reason above was listed as just one of the possible causes.
You should not be basing your worldview regarding scientific truths on the opinions of the media. You should be basing it on the abundance and consilience of evidence instead.
William Connolly, well known wikipedia leftist extremist who erased/rewrote online history, repeatedly.
Bogus rewrite of the 1970s, which ignores all of the 1970s printed evidence regarding ‘climate is cooling’ alarms.
Can you post links to the peer reviewed publications that present evidence of climate cooling and that Peterson et al. 2008 did not include in their analysis?
Long refuted nonsense.
http://notrickszone.com/2016/09/13/massive-cover-up-exposed-285-papers-from-1960s-80s-reveal-robust-global-cooling-scientific-consensus/#sthash.oWZrStbL.PXvEHcU3.dpbs
“No Tricks Zone” Ha ha ha ha ha ha ha !! How pathetic to see a “reference” to such an egregiously lying propaganda website.
That ridiculous spew of pure nonsense at NTZ is SO easy to refute.
They dishonestly included any research publication that simply mentioned the known fact that there was a slight global cooling between 1940-1970. A mere mention of those decades does not in any way support any such “consensus” of continued global cooling going forward.
So ridiculously dishonest. And so tragically shameful that dupes like Richard M so easily fall hook, line, and sinker for this kind of wildly dishonest pseudo-scientific propaganda.
Got yer battery car and heat pump yet?
The ilk casually slandering others with the word “denier” would never dare do it face-to-face. They’re almost always passive-aggressive emotional adolescents. A looming sense of dread usually keeps such naughty children from acting so petulantly in person.
Mathew, if I met a WUWT cultist face to face, I would not hesitate one second to call them out as a “denier”, because that is what they are. In fact, I have called out deniers face to face many times.
It’s also so tragically ironic to see WUWT cultists slandering and bad mouthing those folks who are intelligent enough to accept the research data and conclusions of every major scientific organization in the entire world, but then work themselves into a tizzy when they have their own actions mirrored back on them.
MC, what is ironic is someone implying he is intelligent in the very same sentence in which he appeals to the Bandwagon fallacy. Every lemming thinks he’s in the “in crowd” right up until (and for a short while after) he marches off the cliff with his friends.
Warmunism is toxic stew of fraud and farce concocted by felons for consumption by fools. Keep in mind, I am aware you had nothing to do with concocting it.
Nice try, Matthew. It’s not the “bandwagon fallacy” as you falsely claim. Its the vast overwhelming preponderance of decades of scientific evidence.
“toxic stew of fraud and farce concocted by felons”
Not because there is any valid evidence to justify this claim (there isn’t) but rather because my WUWT propaganda puppet masters told me so.
Umm, no. The same insular, intellectually inbred group keep nodding in unison, as they repeat each others babblings. Warmunist Lysenkoism is bound to unravel, though the grifters will do all they can to keep it going for a few more binges at the government trough.
Like I said, Matthew can’t back one bit of his fairy tale claims of “fraud and farce concocted by felons” with any evidence … because no such evidence actually exists.
And actually, it is the denialist cabal that must eventually unravel. As the world continues to warm and the seas continue to rise, the projections made decades ago by that so-called “insular, intellectually inbred group” just keep slowly being vindicated, decade after decade after decade.
Meanwhile, its hard to recall a single “Nuh Uh because I said so” denier prognostication that has ever come true.
Allegedly lived during the 1970s, yet writes comment responses like a basement dwelling adolescent.
I deliberately use a writing style that appears as if written by a “basement dwelling adolescent”, so that you anti-science cretins might have some chance of understanding it, LOL.
MGC is one of those guys who is convinced that the earth was stable and unchanging prior to the release of the evil gas.
Yet another blind parroting by MarkW of a typically ignorant WUWT denier meme.
Of course the climate has changed in the past. Duh. The issue now is the speed of the change. We are changing the amount of planet warming greenhouse gases in the atmosphere at a rate over 100 times faster than any natural change in tens of millions of years. And such rapid climatic changes in the past typically led to mass extinction events.
Mike said: “It won’t get any warmer than it is now.”
That’s what the contrarians have been predicting since at least the 70s and yet it keeps getting warmer and warmer even with all of those pauses and cooling periods mixed in.
I’m guessing you’re too young to remember the 70’s. The idea that people not afflicted with Leftist rabies were saying it wouldn’t get any warmer in the 70’s is ridiculous, since a three decade long temperature down cycle was mercifully bottoming out then.
It was Disco Leftists who abandoned the sine wave for a straight line down to permanent winter. That’s why they were pushing the fear porn of a coming ice age in the 70’s. I’m sure it was just a coincidence that they offered the same “cure” back then to man-caused ice ages as they do today to man-caused hot houses.
I don’t know what “Leftist rabies” is or who “Disco Leftists” are or why any of that matters. The prevailing prediction from scientists from the 70s onward is that the planet would warm into the future [1].
There were plenty of scientists that recognized how little we knew about climate. However, they did know that we are in between glacial periods and headed to a new one. They just couldn’t predict when the start of a new glaciation would begin. We still can’t predict when it will occur. The warmists want everyone to ignore that and just assume it will continue to warm forever. They need to name a model that can show what conditions will be when we start the next glaciation. If a model can’t do that then it only has less that a 50% chance of being correct.
re: “The warmists want everyone to ignore that and just assume it will continue to warm forever.”
Yet another typically false Gormanian strawman “argument”. No one claims it will continue to warm “forever”, ignorant fool. But because we keep pumping billions of tons of a known warming agent into the air every year, there’s no rational reason to imagine warming will stop any time in the foreseeable future.
One rational reason would be the warming effect of atmospheric CO2 is logarithmic. Like applying additional coats of paint to a window, further additions of the elixir of life, atmospheric CO2, has little-to-no further effect on the beneficial warming we’ve all been enjoying.
“One rational reason would be the warming effect of atmospheric CO2 is logarithmic”
Hey Matthew, that’s almost … almost! … the first intelligent thing that any of you WUWT cultists has said here!
Yes, CO2 warming is logarithmic. And if our fossil fuel emissions created a linear CO2 increase, then yes, the warming would slow down over time. But it still would not stop. It would only slow down somewhat. “further additions of atmospheric CO2, has (sic) little-to-no further effect” is not a correct description.
Not to mention that there’s still lots more warming to come from all the CO2 we’ve already put into the air. Even if we stopped emitting all greenhouse gases this instant, the planet would continue to warm for a while.
But furthermore, the CO2 increase has not been linear. It’s been exponential. An exponential driver crossed with a logarithmic warming influence results in a linear temperature increase trend, which is pretty much what we’ve been observing thus far.
No, we’ve seen a continuation of a multi-century warming trend, which humans have had little to no effect on. Atmospheric CO2, while the elixir of life and free fertilizer for subsistence farmers in the Third World, never was much of a driver of temps. And whatever impetus it would ever supply has already been baked in. Desert nights remain as frigid as ever because atmospheric CO2 sucks at global warming.
Earth is an ironic name for our water planet. Water dominates Earth’s climate. Regions lacking it act the most like the moon. For instance, the arid Sahara can swing from 50 degrees C during the day to -4 C at night! That day/night delta is five times greater than what the humid Amazon Forest experiences, on average.
As for CO2, well, another name for its effect would be “rounding error”.
“No, we’ve seen a continuation of a multi-century warming trend, which humans have had little to no effect on. Atmospheric CO2 never was much of a driver of temps.”
Merely because I, the great and powerful Matthew, have declared it to be so! Never mind that there are literally decades of clear, well verified evidence easily demonstrating that my claims are ridiculously false.
I say so, and my WUWT pseudo-scientific propaganda puppet masters say so, therefore it IS so!
OMG LOL. How tragically infantile.
You’re correct, your claims are ridiculously false.
I call BS on the ridiculous statement, that atmospheric CO2 is increasing exponentially. A quick look at a chart of Mauna Loa data shows a LINEAR increase.
And, if previous additions of the elixir of life, atmospheric CO2, have an ongoing, cumulative impact, how could there ever be a pause in warming, let alone one lasting as long as you’ve been potty trained?
Atmospheric CO2 is wonderful and increasing levels of it are an unalloyed blessing to mankind. But it is not the sole control knob for our climate, nor even an important one among several. Atmospheric CO2 simply isn’t very impactful as a GHG, not on a planet where the climate is dominated by water vapor.
Warmunists have dug themselves into a hole. They’ve painted themselves into a corner. Their data fraud and manipulation has helped them to prolong the agony, but it will no more save their quixotic crusade against human advancement than voter fraud in 2020 will help Leftists this coming November.
Matthew Schilling said: “And, if previous additions of the elixir of life, atmospheric CO2, have an ongoing, cumulative impact, how could there ever be a pause in warming, let alone one lasting as long as you’ve been potty trained?”
It is the atmospheric temperature that has paused. But the climate system as a whole continued to warm with most of the excess energy going into the ocean. This is expected behavior because CO2 is not the only factor modulating the flow of energy into and out of the atmosphere. Other factors like ENSO are also in play. But nature does desire high entropy states so the atmosphere will be forced to warm to equilibriate with rest of the climate system. It might be 10 years from now or 5 years or sooner, but it will warm and go higher than 2016 eventually. The fact that the planetary energy balance is positive guarantees it.
Matthew Schilling said: “But it is not the sole control knob for our climate”
Agreed.
Matthew Schilling said: “nor even an important one among several.”
It is pretty important especially on decadal and longer time scales.
Matthew Schilling said: “Atmospheric CO2 simply isn’t very impactful as a GHG”
Yes it is. The radiative force is 3.7 W/m2 per 2xCO2.
Matthew Schilling said: “not on a planet where the climate is dominated by water vapor.”
Water vapor is a very significant contributor indeed. However, because it is a condensing gas it does not force the climate. It only responds to it and amplifies a force catalyzed by another agent.
Matthew Schilling said: “Their data fraud and manipulation”
There is no widespread fraudulent manipulation of data going on.
Serious lack of mathematic skills.
CO₂ has shown an incremental linear increase since being tracked in the late 20th century.
More childish nonsense.
Just where does these CO₂ molecules bank all of this stored heat?
Answer, nowhere! Every day is a new period of CO₂ infrared absorption through a very narrow band of radiation.
“CO₂ has shown an incremental linear increase since being tracked in the late 20th century”
Who sold you this laughably false claim, ATheoK? Was it your wildly dishonest WUWT propaganda puppet masters again?
The rate of CO2 increase has itself been increasing for decades. See graph below. An “increasing increase” is by definition not a “linear” trend. It is an exponential.
If it’s not going to warm forever then just how long will the warming last? The climate models are nothing more than y = mx + b linear trends after a few years. They show no tapering off of the warming at all.
Will the earth turn into a cinder as the CAGW crowd claims before the warming stops?
“Will the earth turn into a cinder as the CAGW crowd claims?”
Yet another utterly moronic strawman fallacy. So deliberately dumb. But that’s what WUWT does to people. Being deliberately dumb is a badge of honor among WUWT cultists.
Ocasio Cortez: ‘The World is Going to End In Twelve Years If We Don’t Address Climate Change
Greta Thunberg: ““You have stolen my dreams and my childhood with your empty words… Entire ecosystems are collapsing. We are in the beginning of a mass extinction.
John Kerry: ““The scientists told us three years ago we had 12 years to avert the worst consequences of climate crisis. We are now three years gone, so we have nine years left, he said … There is no room for B.S. anymore. There’s no faking it on this one,”
And you speak of cultists? These are the High Priests of your religion! Are you renouncing them and their religioius dogma?
You WUWT fools so sadly continue to be just SO deliberately dumb.
When someone says “we have only 12 years left” it does not mean that the worst consequences are going to happen exactly 12 years hence. It means that if we do not act within the next 12 years, then it will be inordinately difficult if not more or less impossible to stop the worst consequences later on down the road.
But your WUWT propaganda puppet masters never explained that little subtlety to you now, did they, Gorman? No, of course they didn’t.
We might already be beyond some points of no return. For example, we already know that sea level rise due to human greenhouse gas emissions is almost certainly going to continue for centuries, perhaps even millennia. Even if we stopped all greenhouse emissions this very second, sea level rise would continue for at least another century.
Don’t forget mgc worships a paper on which Connolly was co-author. Making Connolly one of it’s “High Priests”
Leftist cultists sodden with koolaid.
It’s just as valid to say it may not warm any further given observations of the past as it is to say it may continue to warm due human co2. In fact, more so. much more. As yet, the two have not been separated. Please don’t try to come up with some tiresome gobbledygook which you believe proves they have. It’s bullshit. The human co2 signal is PRESUMED and nothing more.
It is not quantifiable. If you still believe it is, I’m afraid you must be relegated to the category of climate cult zombie.
Mike says: “The human co2 signal is PRESUMED and nothing more.”
Sorry, but totally false, son.
The CO2 increase in the air is easily proven to be due to human emissions with nothing more than grade school arithmetic. And its also been a known scientific fact since the 19th century that CO2 acts as a warming agent in the air. Moreover, changes seen in the measured spectrum of the atmosphere as CO2 has increased over the past several decades actually show the CO2 signal.
There’s literally all kinds of directly measured evidence demonstrating the human CO2 signal. Nothing is merely “presumed”. Pretending otherwise is what puts one in the category of “climate cult zombie”, LOL.
”The CO2 increase in the air is easily proven to be due to human emissions with nothing more than grade school arithmetic. And its also been a known scientific fact since the 19th century that CO2 acts as a warming agent in the air. Moreover, changes seen in the measured spectrum of the atmosphere as CO2 has increased over the past several decades actually show the CO2 signal.”
Ok so, not one word of that has demonstrated that we can separate the ”human co2 warming” signal from natural variation. Not one word! Congratulations for 1, not comprehending the comment, and 2, being number one clown in this thread!
But zero points for assuming sceptics don’t know the extent of, and the limitations of the science.
Again, MGC doesn’t believe in natural variation. He only knows what has happened since he was born.
The IPCC Physical Science Basis reports summarize the contributions of natural and anthropogenic factors. Here is a graph that might help illustrate things taken from AR6 WG1.
garbage.
Another sadly infantile “Nuh Uh because I say so” from Mindless Mike.
Mikey Mike
Really? Are you actually THAT stupid?
The data just described can be used to derive how much warming can be expected from human CO2 emissions. That value matches closely the amount of warming actually observed. Therefore the observed warming is pretty much entirely due to human greenhouse gas emissions, and little if any is due to “natural variation”.
“zero points for assuming sceptics don’t know the extent of, and the limitations of the science”
It is no “assumption”. So far you’ve provided little if any indication whatever of any proper understanding of science.
Drivel
Yet another juvenile, zero relevant content “Nuh Uh because I say so” retort from Mindless Mike, and demonstrating yet again his lack of any proper understanding of science.
As Willis E showed, any human-caused warming is hidden within the natural variation. It is so small it is not discernable – unless you can count the number of angels on the head of any given pin. Of course that is what climate scientists of today claim to be able to do!
“As Willis E showed”
Ha ha ha ha ha ha ha! Another reference to laughably incorrect pseudo-scientific mumbo jumbo from a single biased amateur hack.
Sorry, but I’ll accept instead the decades of clear evidence and the conclusions derived from that evidence by scores of scientific professionals from every major nation in the entire world.
”evidence by scores of scientific professionals”
You funny.
Another tragically juvenile spew of truly ignorant foolishness from Mindless Mike. So disgraceful.
Leftist rabies is the disease that destroys the minds and morals of its victims, rendering them bigoted sociopaths. The vast majority of outbreaks have occurred on college campuses. It seems it takes repeated exposure to Leftist bullies in enclosed spaces to catch it.
A “Disco Leftist” would be a reference to both a timeframe and a character/mental flaw.
In the 70’s, only an idiot doubted the planet “would warm in the future” (which is why Disco Leftists obsessed over global cooling). The planet had spent three decades sliding back down from the strong warming cycle of the first four decades of the 20th century. Temps were bound to start moving back up again. After all, the larger warming trend that kicked in after the trough of the Little Ice Age was bound to continue. It is still ongoing to this day.
Sadly, we have yet to fully recover to the lovely climate of the MWP. If we had, the land where the Vikings built there farms and villages centuries ago in Greenland wouldn’t still be permafrost.
In fact, prior to Leftist nonsense, everyone referred to warm periods as “Optimums”. So whatever observations were being made in the 70’s, “that the planet would warm in the future”, they didn’t include, “We’re all about to burn up and die because white supremacists created and built modern society!”
MS said: “After all, the larger warming trend that kicked in after the trough of the Little Ice Age was bound to continue.”
Why would the warming continue from the 1970s up to 2016, but not continue after 2016?
Perhaps you posted your reply before I made my last edit. My sentence, “it is still ongoing to this day” was added several minutes after I posted the comment.
I should probably rephrase my question then. Why is it bound to continue and for how long?
A natural trend that has been ongoing for centuries is more likely than not to continue, barring some trend-breaking occurrence. I’d be less confident about that if current temps exceeded the MWP or the Roman Climactic Optimum. They haven’t yet, so there’s room for temps to still climb, yet remain within the range experienced for the last few millennia.
What natural factor is causing the trend?
Why would that natural factor necessarily continue?
Current temperatures do exceed the MWP era on a global scale.
Kaufman et al. 2020
Three year olds don’t ask so many questions. Hush child, go play elsewhere.
If you don’t know what natural factor caused the warming then how do you know it was natural?
I’ll see your Kaufman et al, and raise you 100 other papers saying the opposite.
I’m certainly no expert, but I’ve spent years looking for global average temperature reconstructions. I’m not sure 100 independent global reconstructions even exist let alone 100 that say the opposite. And of the comprehensive studies there are only a handful all of which are consistent with the hypothesis that the contemporary era is warmer than the MWP era on a global scale. I have boldened the word global to drive home the point that I speaking in regards to the global average temperature and not local or region temperatures many of which were indeed warmer at some point in the last 1000 years or so.
Another ignorant appeal to that 1970’s “ice age” foolishness. Same tired old, long refuted denier memes, blindly parroted over and over and over again.
Here’s reality, pal:
THE MYTH OF THE 1970s GLOBAL COOLING SCIENTIFIC CONSENSUS
Peterson et al
Journal of the American Meteorological Society Sept. 2008
“An enduring popular myth suggests that in the 1970s the climate science community was predicting “global cooling” and an “imminent” ice age, an observation frequently used by those who would undermine what climate scientists say today about the prospect of global warming. A review of the literature suggests that, on the contrary, greenhouse warming even then dominated scientists’ thinking as being one of the most important forces shaping Earth’s climate on human time scales. More importantly than showing the falsehood of the myth, this review describes how scientists of the time built the foundation on which the cohesive enterprise of modern climate science now rests.”
https://journals.ametsoc.org/doi/10.1175/2008BAMS2370.1
Right, because the CIA drafted a report about the looming Ice Age… based on a single Newsweek cover! Ha ha ha ha ha ha ha ha! Must… catch… my… breath… Bwah ha ha ha ha ha!
Also – The Leftists squatting in editorial offices in “the popular press” in the 70’s weren’t tied at the hip with the Leftists squatting in academia. Or something.
The same brazen, shameless liars who now try to pretend they didn’t fear porn over global cooling in the 70’s are the same sociopaths who claim they didn’t bully relentlessly to ban DDT worldwide – consigning millions of innocents to misery and death.
Wow Matthew, pulling out all the far right wing conspiracy theories now, aren’t we, LOL! Now its the DDT conspiracy theories. What other delusional nonsense are you going to blindly parrot? Fluoride in drinking water? JFK assassination stories? Trumpty Dumpty’s ludicrous election “fraud” claims, LOL?
Leftists view inconvenient historical facts as “conspiracy theories”. In fact, Leftist racists worked tirelessly to ban DDT as a form of population control of little brown and yellow people. White Leftists don’t mind being murderous bigots, they just think it’s impolite for anyone to mention it.
You might want to sit down for this one: JFK really was assassinated. Take your time. Compose yourself.
Like Newsweek in the 70’s documenting the Leftist obsession with global cooling, Time magazine actually boasted about the concerted efforts to steal the 2020 election. Of course, Biden also boasted of having assembled “the most extensive and inclusive voter fraud organization” in American history. Historians call that a “firsthand account”. But, in Leftist Speak, it’s referred to as a “conspiracy theory”.
And now, some of that extensive voter fraud has been documented, using cell tower data. Murder – and massive voter fraud – will out!
re: “Newsweek in the 70’s documenting the Leftist obsession with global cooling”
Another mindless regurgitation of ludicrous and long refuted falsehoods, based once again merely on unfounded stories in the popular media, not on what scientific research publications in the 1970s actually said.
What the scientific research actually said in the 1970s is documented in the reference provided earlier, but we both know that you won’t bother to check out, because it rips your fairy tale world of denier delusions to shreds. You prefer your intentional ignorance instead.
re: “extensive voter fraud has been documented”
Ha ha ha ha ha ha ha. Which lying reich wing propaganda outlet vomited this laughable nonsense into your empty skull, Matthew?
The same fake paper you linked before.
“It was Disco Leftists who abandoned the sine wave for a straight line down to permanent winter.”
Alarmists seem to think trends go on forever. In the era of Human-caused Global Cooling they thought the trend would continue down, then along came warming, and now they think the warming will go on forever.
They need to learn to love the Sine Wave. Then they will have no more fear about CO2. That’s meant to apply to honest climate change dupes and True Believers. The Climate Change Connivers don’t care, they have another agenda besides finding the truth. They hate the Sine Wave. They deny the Sine Wave exists. Who’s the denier around here?
Typically false, mindless pseudo-scientific handwaving and strawman fallacies from Tom Abbott. Again.
Newton’s first law, that objects in motion tend to stay in motion unless acted upon, has had the effect of making the straight line a picture in the modern mind of default action. But to the Greeks, the circle, and the cycle, were the default paradigm. The cycles of days and seasons agreed with and reinforced that thinking. We would do well to come back to it.
One real problem for humans with thinking in terms of straight lines is, we are much better at interpolation than we are at extrapolation. Yet, CAGW is a feverish exercise in extrapolation. It is nothing without extrapolation.
If AlGorites had been walking around in the very first autumn when people noticed leaves on trees change color and fall off, they would have shrieked the trees were all dying – and dying because of us. Their hysteria would not have abated until spring. Of course, then they would have declared that their shrieking and tears had brought the trees back to life.
ROFL! Good description of the AlGorites!
Another sorry spew of strawman fallacies from the WUWT cult crowd.
Says the poster that can’t even show how to calculate the correlation coefficient between two sine waves?
Another irrelevant non-sequitur and more infantile Gormanian lying.
So disgraceful.
CO2 is up 15 to 20 ppm during last 8 years? Almost every country in the world claims there is a CLIMATE CRISIS going on….most major corporations go along with the story…higher “edumacation” too….not 97% but many scientists are all in…..time will eventually reveal the truth but the waste already is beyond massive.
That reminds me of a saying. “You have to hand it to those blind prostitutes.”
“The revisionists are, of course, maintaining that long Pauses are exactly what one would expect even with an underlying warming trend. But they can only get away with that by saying that each Pause begins with a prominent el Niño Southern Oscillation warming in the tropical eastern Pacific, such as those which occurred in 2016 and, to a somewhat lesser extent, in 2020.”
Yes, that is what I’ve been saying for the past decade. Thanks for noticing.
Out of interest, here’s a little test of this hypothesis. I’ve trained a linear model using CO2 and ENSO conditions on UAH data up to 2015 (green), and then used the same model on data after 2015 (blue).
Bellman, are you saying the green and blue dots are somehow correlating CO2 and ENSO with UAH6? To what ends? How do you relate CO2 to ENSO? What is the math?
It’s very much a work in progress at the moment. All I’ve done in that graph is split the data into two sets, before and after 2015. The pre 2015 data is used as training data, and the post 2015 as the test.
That particular model is based on a linear regression of the log of CO2 plus ENSO data with a lag of a few months to the UAH monthly data. (For the CO2 I’m using a 2 month average to avoid the seasonal cycle).
I then use the model to predict values for the test data. The idea is to compare different models, but for now I’m just giving a visual impression.
The formula for this model is
-16.72 + 1.95 log2(CO2) + 0.09 ENSO
Thanks for the information, Bellman.
Keep training
“Heel!”
That’s pretty cool. I was playing around with a similar model like this but only for ENSO and I got an optimal coefficient close to 0.1 as well.
Only problem is, you’ve got cause and effect backwards, unless you believe that the future causes the past.
The data I’m looking at says that ENSO leads UAH TLT by about 5 months. What data are you looking that says UAH TLT leads ENSO?
The continued high global temperature after El Niño in 2016 seems quite incredible in the face of a prolonged La Niña.
There was a strong spike in temperature over the Arctic Circle in March and April 2022, but in the lower stratosphere, not near the surface.

The most important climate questions: what is the optimum climate for our biosphere? Are any natural trends moving towards or away from that optimum? To what extent is human activity involved in that change? Nobody is interested in these questions let alone the answers.
What drives La Niña, El Niño? Surely not humans.
Anthropausocene.
A Brenchley Plateau.
There does appear to be evidence of Russian funding behind anti-fracking protests and other so-called environmental groups at-arms-length via off-shore shell companies.
It is a reminder of KGB financing so-called peace and anti-nuclear organizations during the Cold War.
The patterns are there to be seen; Russia is still using offshore accounts of the useful oligarchs to move vast sums of money to where they want it used. It should be interesting to see the funding patterns for the activist groups change over time before and after the Ukraine invasion – seizing the oligarchs assets is one thing but the offshore accounts need to be frozen as well.
What is it going to take to cause the new pause to be enjoined with the older longer pause to create the new super pause?
More CO2 😉
A couple of years ago, shortly after the end of the old “Pause”, many were curious about this. So I looked.
Here is what I found. In this example, I have added a hypothetical 5 years to the data set with a temperature low enough to turn the old pause into a new pause with the old start date unchanged, and the end going all the way to the current month.
In this example, the added temperature was calculated to be -0.16 degrees to pull the average down to that which is required.
From the looks of it: Not likely, certainly not in the allowed 5 years.
(as usual, click to embiggen)
Interesting, in light of the developing La Niña maybe even odds.
Such an eventuality would certainly get the adjusters working overtime.
I have a similar approach to “TonyL”, but set an end-date of December 2030 instead of “in 5 years (/ 60 months)”.
I found that any linear extension had a critical “average level” that had to be maintained before the “New Pause” would be “dragged down enough” to merge with the “Old Pause”.
That level will — obviously, when you “pause” to think about it — depend on how long you are willing to wait before the merge happens. “TonyL” found a level of -0.16 to do it in 5 years, I found a level of -0.05 to do it by the end of 2030 (see attached graph).
To get a “merge” on decadal timescales requires the UAH numbers to be consistently below zero. Extrapolating from the (most negative) “recent trend”, from December 2015 to April 2022, it looks like we’ll be waiting until 2040-ish …
I was intrigued why the graphics in Monckton’s post above don’t appear in my Safari browser on a Mac.
I tried the page using the Firefox browser and the graphics appear as they should.
Looking into the image code I find that the suffix for the Monckton image files is .webp – whatever that is.
I check other WUWT posts using Safari – e.g Willis’s A Sense of Proportion – and the images are visible. I check their image suffixes and it’s png, a traditional image format recognised by all browsers.
Similar problem with a recent post titled “Explaining Abundant Polar Bear Sightings on The East Coast as An Upshot of Sea Ice Loss Is Absurd” … no images in Safari but no problems with Firefox, because the image file types are .webp.
On the WUWT home page, the various post images that are .webp files appear simply as grey boxes in Safari, while all png, jpg, gif files are visible.
I’ve no idea why Firefox can understand a .webp suffix but Safari can’t. However, it might be worth WUWT noting that .webp image files cause problems for some visitors.
A little bit of light reading suggests that WebP is supported by Safari 14+. Milord Monckton’s graphics show perfectly in Safari 15.
CMoB said: “The revisionists are, of course, maintaining that long Pauses are exactly what one would expect even with an underlying warming trend.”
A couple of months ago I pulled the CMIP5 data from the KNMI Explorer to test the hypothesis that pauses are expected. I believe CMIP5 predicted that about 20% of the months from 1979 to 2022 would participate in a “Monckton Pause” lasting at least 7 years and 6 months. So yeah, pauses are expected. FWIW the UAH dataset shows about 25% such months.
Lengthy pauses in global warming with ever increasing CO2 in the atmosphere are just CO2 back radiation taking a vacation? Not to mention the permanent vacation the tropical tropospherical hot spot is taking, a requirement of The Theory ™.
No, it doesn’t work like that. Because CO2 is a well-mixed non-condensing gas whose concentration only changes by a few ppm in the annual cycle its modulation on the energy flows into and out of the atmosphere is nearly constant. What is not nearly constant are the modulations by many of the other factors like the heat flux from the ocean to the atmosphere, heat flux from the atmosphere to the cryosphere, cloud patterns, and many others. And because the atmosphere has an incredibly low heat capacity it responds quickly and with a lot of variability to the changes in energy flows. Over the last 91 months the UAH TLT layer has been in ΔE = 0 scenario even though the entire climate system has been in a ΔE > 0 scenario. But because nature desires high entropy states the heat differential between the atmosphere and the rest of the climate system can only diverge so much before it must warm and equilibrate with the rest of the system. During this period the climate system took on an additional 70e21 joules of energy. [1][2]
“Over the last 91 months the UAH TLT layer has been in ΔE = 0 scenario even though the entire climate system has been in a ΔE > 0 scenario. But because nature desires high entropy states the heat differential between the atmosphere and the rest of the climate system can only diverge so much before it must warm and equilibrate with the rest of the system. During this period the climate system took on an additional 70e21 joules of energy.”
The ‘UAH TLT layer’ is not the same as ‘the atmosphere’, is it? You cannot expect your argument to make logical sense to others if you change its subject between sentences.
I said what I meant and I meant what I said. I’ll even generalize it further now. Not only will the atmosphere equilibrate with the rest of the climate system, but so will the cryosphere, land, and any other heat reservoir; just not necessarily simultaneously.
OK, I see what you’re saying now (I think). However, I’m afraid I remain unconvinced.
I accept that temperature-pauses of 7 years and 7 months duration are to be expected with a certain specific frequency and probability of occurrence. But that is just a general statistical description of the phenomenon which doesn’t tell us anything about the specific physical causes of the current pause which we’re discussing, nor about how long this particular pause can be expected to last, nor whether it will be succeeded by a new period of warming or one of cooling and how long that one can be expected to last either. In short, it adds no useful information to what we already know about the pause and doesn’t really provide any explanation of its origins or behaviour in cause-and-effect terms.
Your attempt to provide such a causal explanation in terms of the entropic behaviour of the components of the climate system may be ingenious, but it is so general and indiscriminative in the absence of a lot of hard data that we simply don’t have, that it would still apply whatever the climate happens to be doing at any moment and that means it is scientifically untestable in our present state of knowledge of the climate system. And if it is not scientifically testable, it does not qualify as a valid scientific explanation of the pause.
Finally, and just for the record, if, in the UAH TLT layer ΔE = 0 and in the entire climate system ΔE > 0 as you say, I think this confirms unequivocally that there is no tropical tropospheric ‘Hot Spot’ in existence at the present time. In fact, to me those data indicate the existence of a tropical tropospheric ‘Cold Spot’ instead!
How could such a ‘Cold Spot’ possibly arise in a scenario of accelerating global warming due to humanity’s profligate emissions of greenhouse gases? There’s something wrong with that scenario, or with the data, or possibly with both, it seems to me.
Pauses and spikes are caused by anything that modulates the heat flow into and out of the atmosphere. El Nino is known to enhance the inflow of energy from the ocean while La Nina is known to suppress it. Volcanic eruptions are also known to suppress the inflow from the Sun without suppressing the outflow to space which results in cooling. Tropical cyclones pull energy out of the ocean and put it into the atmosphere. There are all kinds of things that modulating these energy flows.
We don’t know how long this pause will last. It might end next year or 10 years from now. We only know that the pause will end because the climate system as a whole is still taking up energy and because the 2nd law of thermodynamics says nature tends to equilibrate. We just don’t have enough skill in predicting the monthly or yearly variability. Even our skill at predicting ENSO phases is quite limited and only extends out maybe 2 years at best. But our skill at predicting long term trends is reasonably good.
The hotspot is in reference to the middle-troposphere in the tropical region. It is something evidence suggests should happen when the planet warms regardless of the cause of the warming. It is warming at a rate slower than what is expected. Scientists do not fully understand why and is a testament to the fact that there is still much to learn in regards to the exact behavior and timing of the climate system.
Do you even read what you write?
Yes I do. Do you have questions or need something clarified?
Great, so what you are really saying then is that even with all those additional joules of energy there is no climate emergency. So we agree.
I didn’t say anything about an emergency for or against. The word or any reasonable synonym does not in my post.
Pauses have only been expected in hindsight; previously (pre 2000 ish) pauses have been completely and utterly unexpected – if you remember the hysterics, the wailing and the vain attempts to remove the initial hiatus from the temperature record (looking at you, PIK!) then you will also remember the myriad of excuses and explanations used to try to ‘handwave’ it away. So yes, the ‘revisionist’ comment is completely correct and entirely justifiable – in hindsight, of course!
Ups, downs, pauses, and a lot of variability overall shows up in the instrumental temperature record going back to the 1800’s as well. I’m not sure why anyone at this point would expect anything different.
Christopher,
You quote that “The national grid corporation says £3 trillion. McKinsey, a leading consultancy firm, says £4 trillion, at a profoundly conservative estimate.”
That is a cost estimate to continue on our present way.
It has to be balanced against a cost of doing nothing more, starting now.
I cannot see that a halt would cost very much at all. But it is not my estimate that counts. I just see blind dogma insisting that the cost of stopping would be horrendous. Maybe we need an accounting form to do an estimate – if one now exists that knows how to be neutral.
Geoff S
We now have 7 years 7 months pause from October 2014 to April 2022, but previously we had 17 years 11 month pause from October 1996 to August 2014.
https://wattsupwiththat.com/2014/10/01/happy-anniversary-1-october-marks-18-years-without-global-warming-trend/
So what happened in September 2014?
2014 saw the highest solar activity of the 24th solar cycle.
So how did we have a pause stop in September 2014?
It’s called natural variation. Nothing more.
Love the motorized goal posts. Can I buy them on line?
Great comment Bob! LOL!
Pretty graph without any context on how Mr Watts stops a pause on August 2014 and then Monckton starts one in October 2014.
Simonsays
Nothing. Lord M was using the RSS data set back then because it gave the most favorable pause length, despite the RSS producers warning that it contained a known cooling bias. As soon as RSS updated their data set, removing the bias, the pause duly vanished.
He’s using the UAH data because that now gives the most favourable pause length. The truth is that pauses of 7 years and 7 months duration are commonplace in the UAH data set. This doesn’t prevent it showing overall statistically significant warming.
So the deniers are cherry picking the data?
I don’t like to call people names, but it’s quite evident that Lord M is cherry-picking again. The only surprising thing is that people seem to keep falling for it.
Thanks, I have no stake in either camp but I do want the truth. The two authors of these posts, Mr Watts and Lord Monckton need to explain what happened in September 2014. As this looks likes cherry picking data to push a BS narrative.
You don’t want the truth, you want nice comfortable lies that stroke your ego and sense of entitlement – everything you have posted here is a spin to enable confirmation bias and an undeserved sense of superiority.
You want the truth? The temperature record is a constant rollercoaster of highs and lows; daily, annually and over varying amounts of years – interpreting that data, working out the upswings and downswings, as well as where that fits into an averaged ‘plateau’ of temperatures where slight increases cancel slight decreases appears to be a skill way beyond your meagre talents. Perhaps macaroni pictures would be more your level?
Sorry if people are offended, but I thought the labels of Deniers and Alarmists were the generally accepted descriptors of the 2 groups. If not what do you call them? But my point is this site has 2 articles where one says we have 7 years 7months warming and the other 18 years separated by one month. These are not by no name authors on this site so an explanation about how we we seemed to stop a pause of 18 years Precisely at August 2014 then start another one October 2014 is required if not it just undermines the whole site’s credibility.
Yet you fling the “denier” label around like a dead carp.
I don’t use the term denier as an insult but simply as a label for those who don’t believe the whole. AGW thing. I myself get called a denier I take no offense. , But my post is about an obvious contradiction on posts about warming pauses. When I see posts that avoid the question but deflect with crocodile tears about name calling, tells me I have a hit a nerve. So the question is what happened in September 2014? It must have been really hot to stop 18 year pause but then it restarted in October 2014.
It’s not the AGW thing. It’s the CAGW thing which is denied because it can’t be established. And when something cannot be established denial is the only option for people who reason.
Tell us again how using the PRESENT point in time is cherry-picking?
By choosing the start date for the trend, and ignoring any context.
You seem to be missing the fact that starting with the Little Ice Age, the coldest period ‘on record’ during the time when temperatures were being directly observed by human civilization, as a starting point is the ultimate cherry pick. And completely ignores that a warmer climate compared to THAT is an improvement, not something to panic about.
UAH did not start observing the TLT temperature until December of 1978 hundreds of years after the LIA era.
And hippos in the Thames river did not drive SUV’s to get there. But we can observe their remains 140,000 years later.
What could hippos possibly have to do with the UAH data?
For UAH data I’d start in 1979, when the data starts. Best assumption is to assume a linear trend unless there is clear evidence that the trend is not linear. What I wouldn’t do is look back to find a start point that has no significance other than allowing me to claim it proves some point I want to make, especially if that only gives me a period of less than eight years, with huge uncertainty in the trend.
But you can start pretty much anywhere you want in the UAH data and get a linear trend that is not significantly different to the overall trend of 0.13°C / decade.
Start 1988, when the first IPCC report came out, trend is 0.14 ± 0.07°C / decade.
Start in 1996, just before the big El Niño and the first long pause, and the trend is 0.12 ± 0.11°C / decade.
Start in 2002, the start of Monckton’s seven years of “significant” global cooling, and the trend is 0.15 ± 0.15°C / decade.
Start in 2009, when Monckton was claiming there had been seven years of global cooling, and the trend is 0.26 ± 0.28°C / decade.
Or start in October 2014 for a trend of -0.01 ± 0.61°C / decade, and claim there’s something magic about that start date. It’s still not statistically distinguishable from 0.13 ± 0.05°C / decade, that starting at the start of the data gives you.
“ Best assumption is to assume a linear trend unless there is clear evidence that the trend is not linear.”
Sorry, the biosphere is *NOT* linear. It is cyclical, i.e. a time series.
Trying to formulate a linear trend for a time series typically just generates garbage.
“Sorry, the biosphere is *NOT* linear. It is cyclical, i.e. a time series.”
Why do you think every time series must be cyclical?
Maybe this is your engineering training, and the fact that, to use your favorite metaphor, if all you have is an engineering hammer than everything looks like a nail. Possibly in your line of work the only time series you encounter are repeated combinations of sine waves, and you can’t imagine any other possibility.
“Why do you think every time series must be cyclical?”
I didn’t say that! I said: “Sorry, the biosphere is *NOT* linear”.
You somehow read that as *every time series”.
Please work on your reading skills.
“I didn’t say that!”
You said,
“Sorry, the biosphere is *NOT* linear. It is cyclical, i.e. a time series.”
Fair enough that might mean you are only offering a cyclic time series as a type of time series. But it’s an odd way of phrasing it, and I assumed you meant cyclical is the definition of a time series.
It would have been clearer if you’d said “Sorry, the biosphere is *NOT* linear. It is cyclical a time series.”
Not that it really matters, as the point is that a) you haven’t offered any evidence that the temperature time series must be cyclic, and b) it doesn’t matter if it is, as the point still stands that a linear relationship is still the best first estimate. If all you can see is a linear rate of warming, how do you know when you will reach the top of the cycle?
What’s odd about it? I said *BIOSPHERE*. I can’t help it that you can’t read!
What in Pete’s name do you think I said? Do you know what the abbreviation “i.e.” means?>
Does the sun rise in the east and set in the west? Or where you live is the sun in the sky 24hours every day?
A linear relationship of a sine wave is the best first estimate?
Take your medicine. You’ve lost it!
“If all you can see is a linear rate of warming, how do you know when you will reach the top of the cycle?”
How do you see a linear rate of warming in a cyclical process? Answer: by focusing only on a part of the cycle where the slope is nearly constant, either at the zero crossing or at the top or bottom where the slope is near zero.
If all you have is a linear trend line you will *MISS* when the slope of the cyclical process changes from a positive slope to a negative slope.
For Pete’s sake, do I need to draw this out for you?
I may go through this in more detail later, but I’m puzzled why you won’t accept that a linear model might be a reasonable approximation of a cyclic process over a given period, yet have no problem with using a linear model to describe the pause, when there clearly is a cyclic process (ENSO) over the pause period.
How do you pick the start and end points for a linear trend line when the data is a sine wave? Do you start at the zero crossings? Then your trend line has a slope of zero. Do you pick the maximums? Then your trend line has a slope of zero. Do you pick the minimums? Then your trend line has a slope of zero.
If you don’t pick any of these points then how do you decide what points to start and end at? What x_1 will you pick for sin(x_1) and what x_2 will you pick for sin(x-2)?
How many times does this have to be explained to you before you wake up and actually read it for meaning?
What CoM is posting is *NOT* a prediction for future temperature. It is for refuting that CO2 is the control knob for temperature. If it were the control knob then rising CO2 would cause rising temperature and there would be NO PAUSE!
The fact that we have seen several multi-year pauses while CO2 has been rising at the same rate tells the reasonable man that the the climate models based on CO2 being the thermostat have something wrong. It’s why the models mostly predict warming far higher than what has actually been seen.
Now, is ENSO the thermostat and not CO2? If so, then why aren’t the scientists trumpeting this?
Start in 1958 and the trend to 2001 is zero.
How do you get that from the graph? Looks to me like there’s a clear upward trend. Still, if you have the data you could calculate it for yourself.
Here’s HadCRUT 4 over the same period.
He doesn’t pick the start date for the trend, HE PICKS THE END POINT! Which happens to be the present! He then works backwards!
You *still* can’t get this straight, can you?
And what do you think working backwards entails, if you don’t think the purpose is to pick a start date?
All he does is to look back at every possible start date, and then selects the one that gives him the longest “pause”. It really is that simple.
Unfreakingbelievable! You don’t *pick* a start date. You *FIND* the start date!
He *FINDS* the date that gives the longest pause! He doesn’t *pick* that date, he *FINDS* it!
When a game warden finds a dead deer in the woods that has been shot does he “pick:” the point where it was shot? Or does he trace the blood trail back to *FIND* out where it was shot?
Think about what you are arguing for a minute!
Yes, he finds the best starting date so he can pick it. You’re tying yourself in semantic knots here. If you measure every cherry in the field in order to find the biggest one, and then pick it, you’ve both found it and picked it. If you search through every date to find the best starting date, and then pick it, you have cherry picked the starting date.
If I look at every starting point to find the one that will give me the fastest warming rate up to present, and tell you that since January 2011 the warming rate has been 0.34°C / decade, did I pick that starting date or did I find it?
“Yes, he finds the best starting date so he can pick it.”
I’m tying myself in semantic knots! ROFL!!!
The point is that he does *NOT* pick a start date, he finds it after picking the end date – THE PRESENT!
“If you measure every cherry in the field in order to find the biggest one, and then pick it, you’ve both found it and picked it.”
ROFL!!! Picking the biggest cherry in order to eat it is *NOT* the same thing as finding the largest cherry!
wikipedia: “Cherry picking, suppressing evidence, or the fallacy of incomplete evidence is the act of pointing to individual cases or data that seem to confirm a particular position while ignoring a significant portion of related and similar cases or data that may contradict that position. Cherry picking may be committed intentionally or unintentionally.” (bolding mine, tpg)
CoM *picks* the end date – THE PRESENT. He doesn’t cherry pick the start data, he FINDS the start date!
Sorry, but this is getting too philosophical for me. Could you clearly explain what you think the difference is between finding something and picking it?
For example, if you have one of your legendary piles of wooden planks, all of different lengths, what would be the difference between finding the longest plank and picking the longest plank?
I explained it to you. You either refused to read it or were unable to read it.
If a game warden follows the blood trail from a deer backwards to locate where it was shot did he PICK the location where the deer was shot or did he find it?
I don’t know anyone but you who would say he *PICKED* the location where the deer was shot — as if he did the shooting! He *found* the location for most people besides you!
Were there hundreds of possible places the game warden could have chosen, some of which suggested the was dead and others suggesting nothing had been shot, and he decided to find the one place that made it look like the deer had been shot? Does the location he finds change every month?
Statistics is all about uncertainty. [sarc] People like you think that all measurements and trends are exact. That if a trend is flat in one location it must mean that is the only possible interpretation.
“Were there hundreds of possible places the game warden could have chosen, some of which suggested the was dead and others suggesting nothing had been shot, and he decided to find the one place that made it look like the deer had been shot? Does the location he finds change every month?”
Are you kidding? Do you even know what a blood trail *IS*? It’s a trail from a dead deer!
You think game wardens find dead deer at the same spot every month?
You can tell where the shot probably came from by the deer tracks and the entrance and exit wound. There has to be a clear path for the shot to have reached the deer. That places a severe limit on where the shot could have originated!
It is *really* not obvious that you live in the real world with the rest of us!
Thanks for listing all the reasons why a dead dear is nothing like finding a trend in a fluctuating graph. That was the point I was trying to make.
Unfreakingbelievable! The point is that you *FIND* the point of origin, you don’t *PICK* IT!
No one else in the world says you *PICK* the point where the deer was shot – only YOU! Everyone else says you *FIND* the point.
And that is true for CoM. He *FINDS* the point where the pause starts, he does not *PICK* it!
As I’m trying to explain there is a difference between finding the point where a deer was shot, and trying to establish where an event that may or may not exist, happens in a noisy time series. Monckton is hypothesizing that a pause occurs and then finds an exact start point by picking from hundreds of possible start points, whilst ignoring all uncertainty. This is bad statistics.
You keep ignoring my counterexample. If I claim that the rise in warming has accelerated over a period of time, and look back through every month until I find the start point that gives me the best example of an accelerated trend, have I picked that starting date or did I find it?
Time, and updates to the UAH TLT dataset, did not come to a halt.
Using the data to April 2022 (see attached graph) you get :
“Pause 0” = November 1986 to November 1997
“Pause 1” = May 1997 to December 2015 (18 years and 8 months)
“Pause 2” = October 2014 to April 2022
PS : The point about switching from RSS to UAH does need addressing, or at least acknowledging.
Follow-up, I knew I had this graph somewhere on my hard disk …
The UAH V6 “longest pause on record” is as above, May 1997 to December 2015.
The RSS V4 one is from July 2001 to August 2012.
The RSS V3.3 one is from April 1997 to October 2015 (18 years and 7 months).
Note that the start-date for the RSS V3.3 “longest pause” shifted from October 1996 as more data became available after September 2014.
Thanks for those, this is confusing as we have 3 over lapping pauses from November 1986 to April 2022. So how/when did any warming happen?
Is this just what the sks site call the escalator?
https://skepticalscience.com/graphics.php?g=47
A pause is a period where any warming is cancelled out by cooling – so as the temperatures cool more now, it cancels out warming that occurred further back. Think of it as a very gentle curve and the warming of several months in 2014 as an anomalous upswing that created a step change between the two pauses. There, that wasn’t so hard, was it? Now, you were going to do some macaroni pictures next?
OK, thanks for the definition. So from Mark’s BLR post we have 3 pauses
Pause 0” = November 1986 to November 1997
“Pause 1” = May 1997 to December 2015 (18 years and 8 months)
“Pause 2” = October 2014 to April 2022
What is the definition of a pause ending? Is that when all the previous warming has been cancelled? And what starts the next pause?
I am trying to understand how you can have multiple pauses running at the same time.
Pretty much, yes.
With a regularly spaced sequence of numbers, e.g. the monthly UAH (V6) TLT dataset, a “pause” can be “defined” as :
“Any period where the SLOPE(y-range, x-range) function in your local Excel-compatible spreadsheet gives you a result of (almost exactly) zero”.
When searching for “the longest pause(s)” in such a dataset many cells (/ columns) in your spreadsheet can be saved by “fixing” either the end-point or the start-point of the range (using appropriately positioned “$” characters in the SLOPE formula) and copying that formula up and down until you find the “zero-crossing row”.
With the UAH dataset imagine that you have, “by pure luck”, two adjacent columns designed to look for :
1) “Pause 2” with a fixed end-point (= “the latest value”, in this case), and
2) “Pause 1” with a fixed start-point (= “May 1997”)
You copy the cells with the appropriate SLOPE functions for both those columns for the rows (equivalent to) “July 2014 to June 2015”.
You will discover (using only 2 columns x 12 rows of cells in “your” spreadsheet) that the earliest row for “Pause 2” to just be negative is (for now) “October 2014”, while the latest row for “Pause 1” to be just negative is (and always will be, until the next “Reference Period” comes into use !) “December 2015”.
Looking at the original graph it is “clear” (to me, at least …) that “what starts Pause 2″ is the formula tracking backwards (/ down) the leading edge of the 1997/8 El Nino “spike”, while “what ends Pause 1″ is the formula (in the adjacent column of “your” spreadsheet …) tracking forwards (/ up) the same leading edge.
You do not have “multiple pauses running at the same time”, you have “two overlapping pauses (with different ‘average / absolute’ levels)”.
A sequence of such overlapping “pauses” will inevitably give you some version of SkS’s “escalator (/ staircase)”, in this particular case an “always ascending” one.
Thanks for your explanation, it is refreshing to have someone too take the time to do so. I don’t have the expertise or breadth of knowledge to draw what are the conclusions to all of this when it comes to the debate about what these pauses mean to the AGW theory? Do they support the escalator theory of AGW? Or this is all statistical noise of natural variation?
To me this seems to be really smart people watching ants walk around and thinking they have discovered some deep mathematical meaningful in their wanderings.
I am reminded of the Ernest Rutheford famous quote” that if you need statistics to prove your experiment you should have a done a better experiment.”.
The main point of the pauses is not to refute long term warming trends but to refute the assumption that increasing CO2 is the temperature control knob. CO2 emissions are not an “escalator”, they are a continuous growth. If CO2 is the thermostat control then a continuously growing CO2 should result in a continuously growing temperature. Yet we aren’t seeing a continuously growing temperature.
Think about the energy budget theories that abound. They all basically show that the “back radiation” from CO2 is continuous over time and that it is the “back radiation” that is causing the rising temperatures. As CO2 grows so does the “back radiation” and therefore so should the temperature. No “escalator” can exist with “back radiation” and therefore no pauses in temperature rise. Yet we *are* seeing pauses.
And then we come to some of the recent studies by agricultural scientists. They show a longer growing season but stagnant to down heat accumulation over the growing season. That leads to the conclusion that max temps aren’t going up but min temps are. The min temps going up comports with the idea that the increased CO2 slows down heat loss at night but it doesn’t comport with the idea that increased CO2 causes more “back radiation” and therefore higher max temps.
Now if the climate models are trying to tell us that min temps are going up and max temps aren’t then I could buy into that. But that doesn’t jive with the claim by the climate scientists that the earth is going to turn into a cinder because of higher CO2. That would require max temps to be going up!
What I believe we are seeing is just natural variation caused by cyclical processes involving things like sun insolation, cloud cover, and the ocean processes, none of which are adequately handled by any of the climate models.
I guess you makes yer choice, pays yer money, and takes yer chances!
Simonsays, at the most fundamental level the temperature of the atmosphere is controlled primarily by the net flow of energy into and out of it. When ΔE > 0 the temperature increases. When ΔE < 0 the temperature decreases. The thing is though is that there are many factors that modulate the flows of energy. Some of the factors contribute small but long duration inflows like CO2. Some of the factors contribute large but transient inflows and outflows like the ENSO cycle. There are many factors that modulate these inflows and outflows with many different magnitudes and timescales in which they operate. The atmospheric temperature in any given month is the net effect of all of them working together. And because there are so many of them with a wide array of behavior manifestations and because the atmosphere has very low heat capacity the temperature exhibits high variability with many ups, downs, and pauses. But the trend over decadal time scales is positive (warming) and that is due mainly to anthropogenically modulated net energy flow into the atmosphere.
OK, so given that “many factors that modulate these inflows and outflows with many different magnitudes and time-scales” how do you distinguish that anthropogenic energy flow are dominate?
First…anthropogenic energy flows do not dominate on monthly or yearly scales. They’re magnitude is relatively small which allows natural energy flows to dominate at these time scales. But the anthropogenic energy flows do dominate on decadal and longer time scales. The reason is because they are persistently positive whereas the natural ones are cyclic meaning they have both positive and negative phases that tend to offset on long time scales. ENSO is a great example of this.
Second…we can distinguish the anthropogenic energy flow by analyzing their contribution. For example, we know that CO2 has a radiative force of about 2.0 W/m2 right now while other GHGs and anthropogenic components combine for an additional 1.5 W/m2. Aerosols contribute maybe -1.0 W/m2 of radiative force which makes the net of all of these about +2.5 W/m2.
Me neither !
I am, at best, an “interested amateur” highlighting (apparent) contradictions.
I don’t think even SkS would qualify the “escalator” as a (scientific) “theory”.
For now it is merely an “observation” of how the satellite datasets for the lower troposphere are behaving, the “ever rising levels” aspect of which they (and many others) keep insisting is “compatible with” the AGW hypothesis (= “CO2 is a GHG”, which is indeed correct).
We simply don’t have enough data to make such a definitive statement.
A major question of “sceptics” has always been :
“How much of any warming is (/ was) due to CO2 emissions and how much is (/ was) natural variability ?”
NB : Even the IPCC (in AR5, in the 2013 WG-I report, Chapter 10, page 887) cited a paper that concluded that there was “a dominant contribution by internal variability” to “the early 20th century warming period” (1910 to 1940/45) .
The interest in the evolution of the “New Pause” (my “Pause 2”) is (probably ?) that if the UAH numbers are sufficiently low at the end of this decade for it to merge with the “Old Pause” then not only would “we” have deleted a “step up” (= “continuous warming” …) “we” would have an updated “Pause 1” that showed a zero trend lasting more than 30 years …
While probably not “mortal / lethal”, that would still be a severe setback to the “The world is going to end in fire (by 2100, unless we go ‘Net-Zero’ immediately …)” activists.
– – – – –
The main problem, from my (probably overly cynical / world-weary) point of view, is that in today’s “instant gratification / 24-hour news cycle” world telling people
will only result in baffled stares, or angry Tweets demanding “But you have to tell us ‘the’ answer [ to Life, The Universe, and Everything ] right now ! ! !”.
Thanks. I finally get it. So how much would the trend have to fall to elimate the step up to create a 30 year pause?
I notice the blog has gone off tangent about ocean temperature is why we have a pause. Haven’t got my head around that one yet but looks interesting.
See my reply (and the one from “TonyL”) to “Go Home”, who asked a very similar question in a separate “top level” post higher up this webpage …
That quote first appeared in a publication by Hammersley in 1962 which occurred 25 years after Rutherford died. Obviously the attribution to Rutherford is thus challenged. And ironically the quote was used not to denigrate statistical methods. Far from it. The context was on an experimental technique called a Monte Carlo simulation which is almost entirely based on statistical methods. Hammersley was not critical of statistical techniques. He was critical of preferring statistical techniques when an exact analysis technique was available.
Monckton of Brenchley sadly demonstrates once again that he can’t (or simply won’t) get his facts straight. Some examples:
1 – “There has been no global warming – none at all – for 7 years 7 months”
“none at all”? Here we go with yet another shameful episode of foolishly pretending that the world’s oceans “aren’t” part of our globe.
Heat has continued to accumulate in the world’s oceans all throughout the current “pause”, just as it did during the previous “pause”.
It can only be a matter of time until the next major El Nino event comes along and releases that accumulated heat to the atmosphere, and we will have another dramatic upward stair step in atmospheric temperatures; just like we did at the end of the last “pause”.
One would have thought that anti-science deniers like Monckton would have learned their lesson after the last “pause” ended so abruptly and temperatures reached a new set of all time highs. But here they are once again blindly babbling from the same failed playbook, like a bunch of mindless brain dead zombies.
2- “look at the steepening of the (temperature) trend from 1976 onward.” Well, yes, but did the CO2 concentration surge in the 1970s compared with previous decades? No: it continued to increase at much the same rate as before.”
Ridiculously false. The rate of CO2 concentration increase in the atmosphere has surged since the 1970s. In fact, the rate of increase is now over 2.5 times faster than it was prior to the 1970s.
3- “It was another natural event – this time the Great Pacific Shift of 1976 – that coincided with, and inferentially had no small influence upon the more rapid increase in temperature over the 20 years to the late 1990s”
Another laughable pseudo-scientific fairy tale denier excuse. The oceans were accumulating net heat all through the time frame 1976 to the late 1990s, not losing net heat to the atmosphere. Something else is needed that drives both atmospheric warming and net heat accumulation in the oceans. That something else, of course, is human CO2 emissions.
See graphs below for the data discussed in points (1) (2) and (3) above.
Meanwhile, most of the rest of Monckton’s overly long histrionics can be succinctly summarized as follows:
“because other nations are still drilling holes in the bottom of the global lifeboat, I demand that we here in the U.K. do not stop drilling our holes either.”
It’s not that simple. We’ve seen declines since 2020.
http://www.bom.gov.au/archive/oceanography/ocean_anals/IDYOC007/IDYOC007.202005.gif
http://www.bom.gov.au/archive/oceanography/ocean_anals/IDYOC007/IDYOC007.202205.gif
I don’t see those graphs as clearly demonstrating any “decline”, Ireneusz. I see a redistribution.
Yes, in the summer La Niña transports warm water across the Pacific to Antarctica. In winter, the stratospheric polar vortex will quickly remove the “excess” heat.
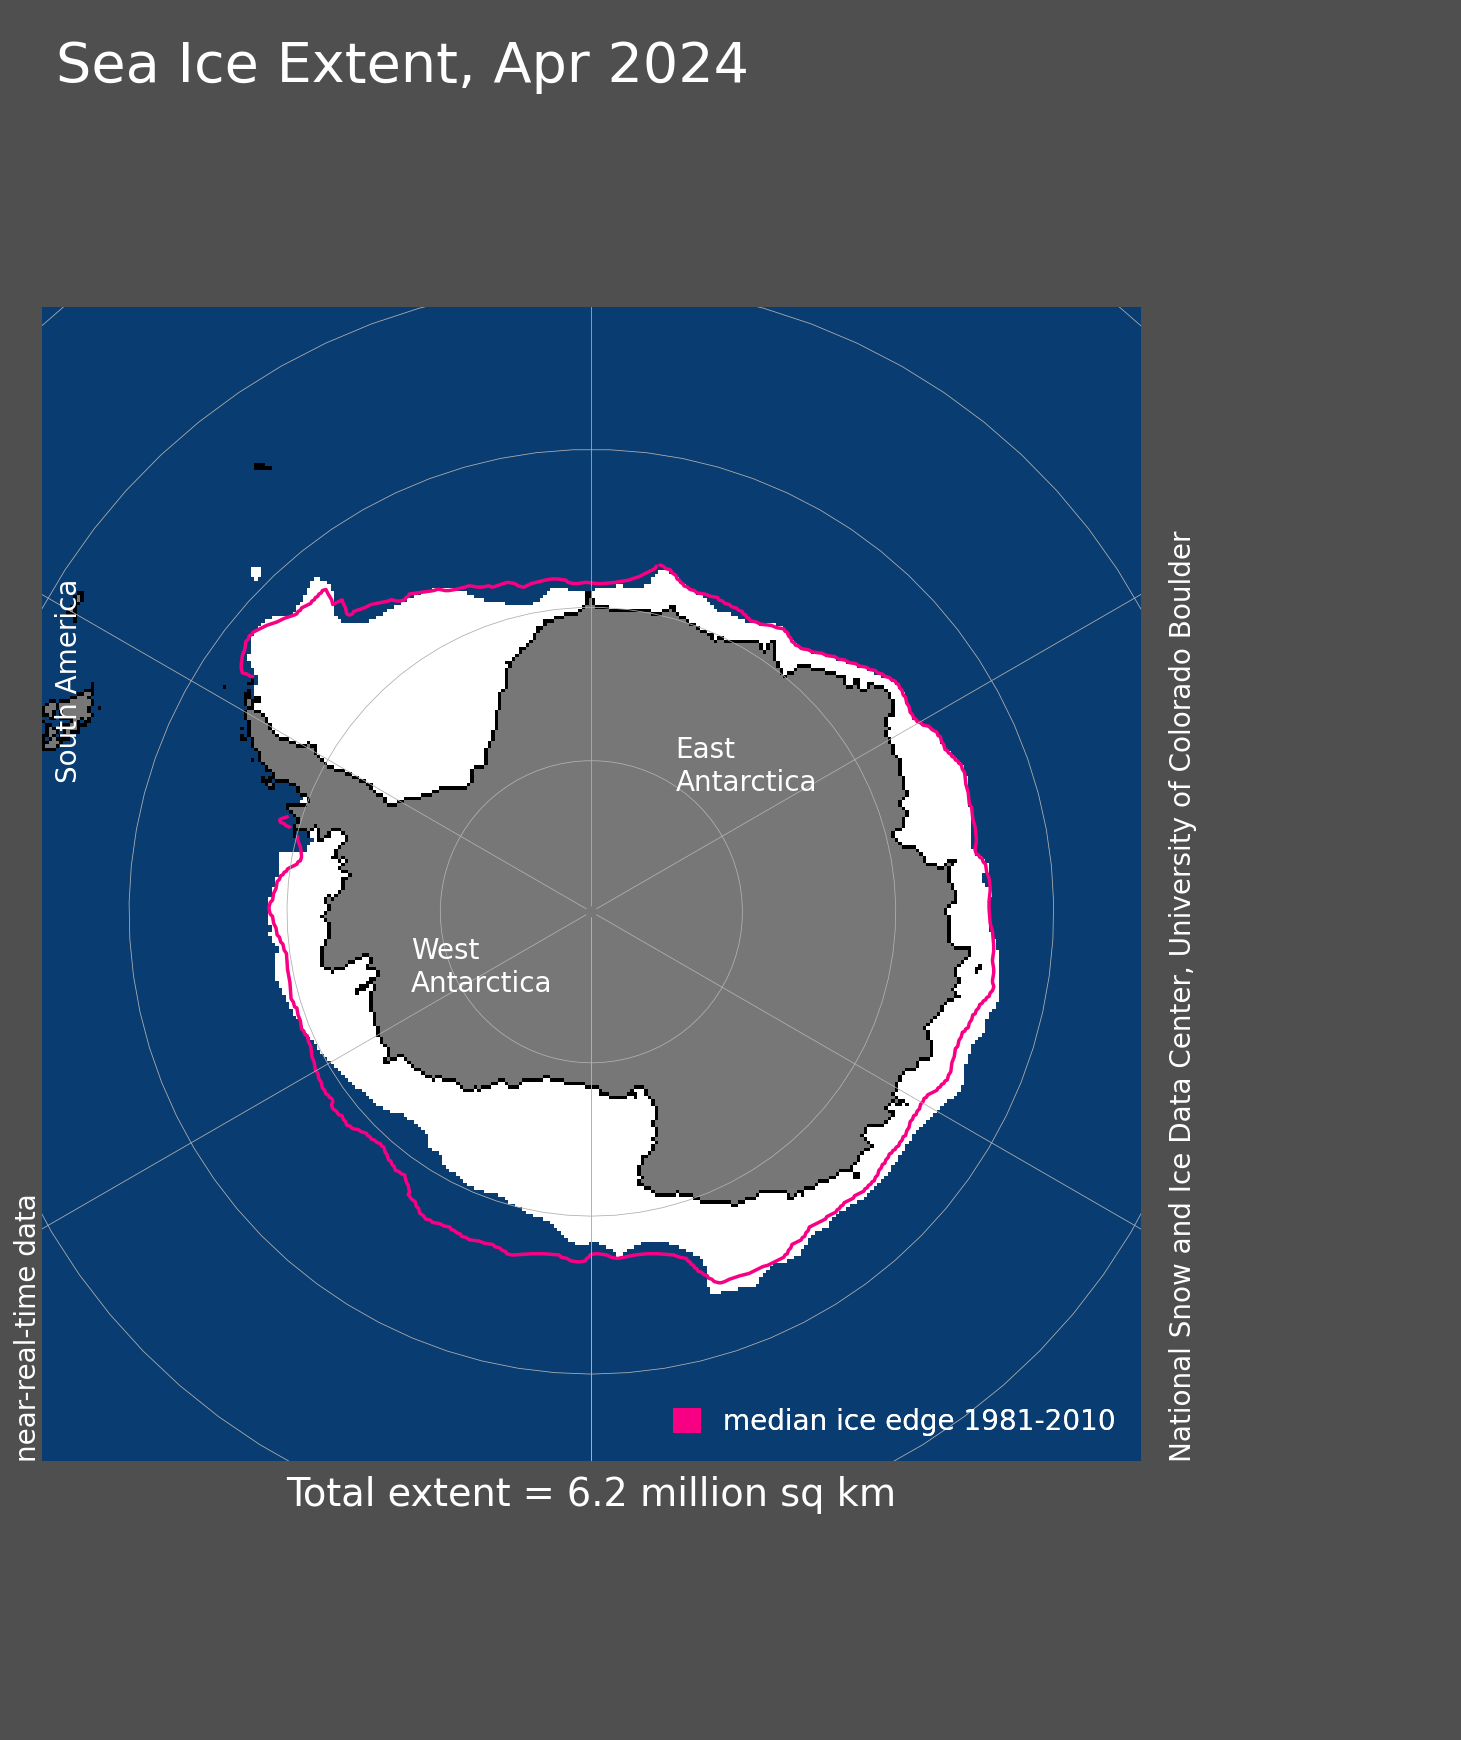
Merely pointing out that seasons exist is not “evidence” that excess heat is being removed from the oceans. As the data I posted earlier demonstrates, excess heat is not being removed from the oceans; heat continues to accumulate.
Let me quote : “I see redistribution”.
Oh c’mon now. Redistribution of heat within the ocean itself is not “removal” of heat from out of the ocean.
Again, the data clearly indicates that heat is accumulating in the oceans, and has continuously done so for many decades now. No amount of irrelevant hand waving red herrings will change that measured fact.
How can the heat be accumulating when NASA shows the SST declining since about 2003?
This is nothing more than the old “the heat is hiding in the deep ocean” meme. If the sub-surface ocean is warmer than the surface then just how do you suppose that warmer water doesn’t heat the surface water?
“How can the heat be accumulating when NASA shows the SST declining since about 2003?”
Really? So intentionally ignorant that you can’t figure out how this can happen?
Try this: wind patterns and ocean currents bring colder water up to the surface. This circumstance is otherwise known as “La Nina”. That water then warms up at the surface. The total heat content of the ocean has increased, even though the surface temperature has decreased.
And oh by the way, just for completeness, the claim that “NASA shows the SST declining since 2003” is also false. But what else is new. Practically everything Tim states is false. That’s what WUWT does to people.
Lordy, you really do like playing the deliberately dense denier ignoramus, don’t you, Tim.
You said yourself the cold water in the deep has to be stirred to the top to get warmed!
So how does the deep ocean get warmed if the heat doesn’t appear on the surface first?
Meaning THE SURFACE HEATS FIRST! But the surface is cooling! So how does that warm the deep ocean?
Nope. NASA saw this as far back as 2006. go here: https://www.nasa.gov/home/hqnews/2006/sep/HQ_06318_Ocean_Cooling.html
Why do *INSIST* on always sticking your foot in your mouth?
re: “But the surface is cooling! So how does that warm the deep ocean?”
My God you are such an ignorant fool. Answer this question by answering your own stupid question that you asked in some other renditions of this same conversation in other threads:
“what replaces the cold water that came up from the bottom”?
re: “NASA saw this (SST declining since 2003) as far back as 2006”
Oh my God, you are so DUMB.
DUMB DUMB DUMB DUMB DUMB DUMB DUMB.
Yeah, there was a short term decline in SST back in 2006, that actually continued through about 2008. That does not mean that a SST decline has continued to the present day. Your 2006 reference does not support the claim “SST declining since 2003”.
In fact, no reference will ever support your foolish statement, because it is false. The graph below in fact proves that it is false.
You must be doing this on purpose, Tim. Just being as sensationally stupid and as deliberately dumb as possible, on purpose. You are certainly putting on quite an entertaining show, LOL!
Warm water from the western Pacific during La Niña needs a great deal of solar energy to move eastward as the current carries it toward Antarctica.
But that stopped 7 years ago. Please explain? Is it like going to start up again soon or…?
That’s a chart of sea surface temperature (SST), not ocean heat content.
So water doesn’t conduct heat? Tell us how the water below the surface gets warmed while the surface doesn’t warm? Is there some hidden “heat transporter” on some satellite somewhere that is a well-kept secret?
“So water doesn’t conduct heat?
It does. But that rate of heat transfer is orders of magnitude slower than mechanical mixing. In the link provided, please pay special attention to the rate of heat transfer in and out of the 90% of ocean volume called “deep”. And even that source is from another source of ocean mixing.
https://scied.ucar.edu/learning-zone/earth-system/transfer-and-storage-heat-oceans
“It does”
Then how does the heat get in the deep ocean without traversing the surface? How does the deep ocean heat up without also warming the surface?
It does, indeed, “traverse the surface”. Via the mechanical methods in the link. The deep ocean is cooler, so, no one claims that it “warms the surface”.
If you had read the link I spoon fed you, then you would have a fundamental understanding…
Oh really? Then why are so many CAGW advocates like MGC claiming the heat is hiding in the deep oceans while the ocean is cooling?
Gorman says:
“Is there some hidden “heat transporter” on some satellite somewhere that is a well-kept secret?”
Thanks for once again so comically demonstrating your willful ignorance, Timmy Boy. Ever hear of ocean currents? The oceans are not a quiescent bathtub, as you apparently want to pretend.
The outright stupidity of so many WUWT comments like this one is just unbelievable. And yet fools like Gorman want to pretend that they (ha ha ha ha ha!) “know better” than the entire worldwide scientific community?
Oh please. What a joke. What a disgrace. Grow up already.
Every time you open your mouth you stick your foot in it!
How does the heat in the ocean currents get there if it didn’t pass through the surface!
You are *still* trying to convince us that the heat is hiding in the ocean, as if the Enterprise is up there in orbit, using a Romulan cloaking device, and transporting all the heat into the deep ocean!
Have you *ever* jumped in the deep end of a swimming pool? Which is warmer? The surface or the drain at the bottom? Stir it up all you want, the surface *has* to warm before the heat can be “stirred” toward the bottom! Meaning the surface temps go up!
Stop sucking your toes and think about it for just five seconds!
Here’s Goofball Gorman still playing the intentionally ignorant fool.
Stir some cold water from the bottom up to the surface. Let that water sit in the sun and warm up some. The total heat content of the water has increased, even though its surface temperature has actually decreased.
DUH.
Lordy, you WUWT cultists are just SO friggin’ STUPID. STUPID STUPID STUPID. And yet you still want to pretend that you “know better” than science professionals from all over the world.
What did that water from the bottom get back filled by? Warmer water? Does warmer water rise or fall?
Yet another tragically Timian example of how to be deliberately dumb.
For the deep water to rise, the surface must rise first – or maybe it’s the other way round according to you?
But let’s stay with convention and go with the first. If the water at the surface has not risen for 7 years then the deep water CANNOT GAIN HEAT either. Can it? MORON. Therefore, your claim that extra co2 causing the oceans to warm has not occurred for 7 years. Please explain why without trying to hide in the deep ocean.
Mike you can try to hand wave around this topic as much as you want. Regardless how it happens, measurement data demonstrates that the oceans most certainly have been warming, even during and all throughout the latest “pause” in atmospheric warming.
Pretending otherwise is, sorry, just being willfully ignorant.
I’m not pretending anything. I am asking you a question since you think you know everything, but you cannot answer it. I posted a chart which shows the surface of the ocean has not warmed since 2015. You say the rest of the ocean is still accumulating heat even during this pause. I say that is not possible.
What you are obviously seeing is an artifact of earlier warmed water moving around in the 3 billion cubic miles of ocean. If you think I’m wrong, tell me how it is warming even while there is no increase in land or atmosphere.
“I say bullshit.”
Because I, the great and powerful Mikey Mike, “know better” than the people who have actually made these measurements and published their data. And how do I know that I “know better” than them? Because I SAY SO, that’s why.
So ridiculously juvenile.
https://www.ncei.noaa.gov/access/global-ocean-heat-content/
‘Because I, the great and powerful Mikey Mike, “know better” than the people who have actually made these measurements and published their data.’
Check your own reference at the link you gave and you will see that those people only claim to have measured the ocean heat content down to a depth of 2,000 metres. But the average depth of the oceans is about 4,000 metres.
Therefore, they cannot possibly have measured the whole ocean heat content, which I think means that they are just as ignorant as everybody else on the planet about what is happening to the heat content of the lower half of it that they haven’t been able to measure (because the ARGO buoys that do the measuring only go down as far as 2,000 metres).
I think this knowledge-deficit must invalidate the proposed scientific basis for their claims to know that the whole ocean heat content is rising and that it is doing so at a specific rate. The whole ocean heat content could even be falling for all that anyone can really tell.
John Power:
There are ways to estimate total ocean heat content change (down to the very bottom of the oceans) other than just temperature measurements. One, for example, is sea level rise, a major component of which is thermal expansion due to temperature increase of the ocean water.
Estimation via this method is not as precise, but it is more than good enough to know that total ocean heat content is definitely increasing.
The claims that “they are just as ignorant as everybody else on the planet about what is happening” and “The whole ocean heat content could even be falling for all that anyone can really tell” are simply not correct.
But estimates are not measurements, are they? Estimates are products of ones prior assumptions and do not contain any new information about the object of inquiry, whereas measurements are the products of one’s observations and may contain new information about it.
Estimates cannot substitute for measurements in real science and it is misleading to misrepresent them as measurements in the scientific literature and discourse, because they are posing as new information and knowledge when they are really just rehashes of the authors’ prior assumptions in new guises. These misrepresentations do not advance our scientific knowledge but actually hold it back by deceiving people into thinking that the necessary science has already been done when it hasn’t.
I understand that there are ways to estimate changes in total ocean heat content (OCH) in the absence of comprehensive and authentic measurements of it and I have no objection to anyone doing that if they want to. But I think we should not kid ourselves that any such estimates are going to produce any new information or knowledge about the total OCH, because they are not capable of doing that.
Proxies (e.g. changes in sea-level, which you mentioned) may enable changes in total OCH to be guesstimated, but they do not enable them to be measured. Knowledge is information and we cannot get new information/knowledge from estimates, as I have explained above. We can only get re-presentations of our pre-existing assumptions from them and our pre-existing assumptions are not new knowledge. So your belief that current estimates of sea-level rises enable us to know that total OCH is also rising is an illusion and we cannot really know whether or not it really is rising until we have measured it directly, i.e. without the supposed mediation of uncertain and unreliable proxies.
Oops! Sorry, ‘OCH’ should have been ‘OHC’ in all instances above.
Cheng et al. 2022
I’m afraid Cheng et al. also claim to have measured the ocean heat content only down to a depth of 2,000 metres, i.e. only half the ocean’s average depth.
Correct. That means these OHC datasets that only go down to 2000m are underestimating the total ocean heat content uptake. See Bagnell et al. 2021 and Desbruyeres et al. 2016 for datasets that go down to the deep and abyssal depths.
“That means these OHC datasets that only go down to 2000m are underestimating the total ocean heat content uptake.’
Not necessarily. We cannot know what the total OHC is really doing if we’ve only measured the heat content of the top half of the ocean. To think that we can is to indulge in make-believe.
Re. Bagnell et al. 2021, From the Abstract:
“Here, we provide a global reconstruction of historical changes in full-depth ocean heat content based on interpolated subsurface temperature data using an auto-regressive artificial neural network, providing estimates of total ocean warming for the period 1946-2019.”
As I have pointed out to MGC above, estimates are not measurements and do not provide any new information about the object of study. I don’t doubt that interpolated subsurface temperature data and an auto-regressive artificial neural network may provide any amount of data relating to the heat content of the lower 2,000 metres of the ocean, but none of it will contain any useful, reliable information about it whatsoever. As the last sentence of the Abstract says, “These results suggest a delayed onset of a positive Earth energy imbalance relative to previous estimates, although large uncertainties remain.” It’s all a bit vague and uncertain, don’t you agree?
Re. Desbruyeres et al. 2016, they report having used ship-board “hydrographic” methods to investigate the ocean heat content below 2,000 metres but, again, their measurements of it are very uncertain (although I won’t subject readers here to the tedium of showing how they are so). As they say themselves regarding the small fruits of their 35-year effort (Introduction, para.1), “However, much of the ocean volume remains unmonitored or sparsely sampled in space and time…”. How much, you might ask? They don’t appear to say, so we are left still in unlimited uncertainty about what the true uncertainty of their measurements of OHC might be, which is a deeper, more compounded kind of uncertainty than we might have thought we would be in after reading their paper.
‘Science’ which leads people into deeper and greater uncertainty rather than lifting them out of it by the provision of hard information is no science at all by my reckoning. On the contrary, it is the very opposite of real science. I don’t know what we should call it, but ‘junk science’ seems like an apt term to use provisionally.
Why do you reference that? You already admitted above there is a pause and you don’t know how long it will last. Is there some kind of brain blockage or what?
Why does Mike continue to lie? No one admitted to any “pause” of ocean heat content accumulation, because there is no such “pause”.
To do as Mike says would make one a liar, just like Mike.
I referenced Cheng et al. 2021 because it is a dataset that shows that the oceans are warming. I referenced Bagnell et al. 2021 and Desbruyeres et al. 2016 because John Power pointed out that Cheng et al. 2021 only goes down to 2000m.
I standby what I said above. That is there is a pause in the atmospheric warming trend as assessed by the Monckton method. That does not say anything about the warming trend in the other heat reservoirs of the climate system especially the hydrosphere which takes on about 90% of the excess heat.
”I referenced Cheng et al. 2021 because it is a dataset that shows that the oceans are warming.”
Ok let’s start at the beginning. Just above you agreed there is a pause in the ”surface” warming. About 8 years or so now.
Yet both you and MGC maintain the oceans are still warming so there really isn’t a pause when all is taken into account.
Tell me… How do you think the ocean is warmed? Is it a, from below or b, from above?
Mike said: “k let’s start at the beginning. Just above you agreed there is a pause in the ”surface” warming. About 8 years or so now.”
The Monckton Pause is for the UAH TLT timeseries. That’s much higher than the surface. But, yes, there is definitely a 91 month pause in the UAH TLT trend as assessed by the Monckton method.
Mike said: “Yet both you and MGC maintain the oceans are still warming so there really isn’t a pause when all is taken into account.”
Correct.
Mike said: “Tell me… How do you think the ocean is warmed?”
The uptake of excess heat caused by a positive planetary energy imbalance.
Mike said: “Is it a, from below or b, from above?”
Above. The planetary energy imbalance is the difference between absorbed solar radiation (energy-in) and outgoing longwave radiation (energy-out).
Since El Nino in 2016, epa.gov shows the global average SST to be cooling. If the deep ocean is heated from above then how can the ocean’s heat content go up while the surface is cooling? The heat increase *has* to traverse the surface in order to reach the deeper ocean. That increased heat content traversing the surface of the ocean should warm it, not cool it.
BTW, if cold water falls and hot water rises and the deep ocean is warming then why isn’t it rising and increasing the temp of the surface?
As La Niña rises, the global sea surface temperature drops.
Yes, but not ocean heat content. That increases during periods of La Niña, as we have been seeing over the past couple of years. The heat is still piling in.
Total ocean heat content is a guess at best. The error bars dwarf any change.
Total heat content is an example of ‘handwaved’ science – it’s not just a guess – it’s a contrived way of explaining why their sums add up when, in reality, they don’t. It’s a major fig leaf for their embarrassment and has never measured, only guesstimated in outrageously overblown models.
Widely distributed Argo floats have been measuring ocean temperature accurately to 2,000m for more than 20 years now. There are around 4,000 of them. It is not guesswork.
Argo floats accurate? Their uncertainty is at least +/- 0.5C, about the same accuracy as land-based thermometers. Don’t confuse the sensor precision with the float accuracy. They are two different things!
The WUWT cultists sadly continue to demonstrate their ignorance.
Richard Page claims ocean heat content “isn’t” measured, but as TheFinalNail points out, this is laughably false.
Meanwhile, Tim Gorman and Graemethecat try to pretend that there is too much uncertainty in these measurements. But research publications by the scientific professionals who set up the measurement system explain and demonstrate why this uncertainty objection is also false.
These amateur hacks should all go read the scientific literature on Argo ocean temperature measurements and actually learn some real science for a change, instead of wasting their time filling their heads with anti-science garbage at this WUWT propaganda site.
They also space on the fact that, even if the worst possible estimates of measurement “uncertainty” were true, they add almost nothing to the standard error of trend evaluations over physically/statistically significant time periods. Ironically, even if the pause data in this post had significant distributed errors, the basic standard error of the trend is so bad that it would be increased by very little by considering them as well
You don’t even understand that uncertainty adds when you have measurements of different things. The propagated uncertainty will quickly overwhelm whatever difference you are trying to identify!
The standard error of trend evaluations only tells you about the fit of the trend line to the stated values of the data. If that data has uncertainty intervals then the standard error of the trend evaluations tells you *NOTHING* about the accuracy of the trend line. If you include the error bars for the individual data elements in most temperature data sets then the trend lines can range from positive to negative and *still* be within the error bars!
“You don’t even understand that uncertainty adds when you have measurements of different things.”
NO clue what you’re even referencing. We are discussing temperature measurements. Nothing else. They all have resolution and accuracy, no matter how or when obtained. That means they can all be evaluated together.
AGAIN. In my biz every physical, geological and rheological parameter we use together is:
Snap out of it….
“NO clue what you’re even referencing.”
I know you don’t have a clue. Neither do today’s climate scientists and CAGW advocates!
Uncertainty in a set of measurements when you are measuring the same thing using the same instrument and no systematic error exists. This should (but not always) generate a random distribution of measurements, each with its own individual random error. If that random error is Gaussian then the average of all the readings tends to see the random error cancel itself out – i.e. for every positive error +u there will be a negative error -u. So you get +u – u = 0 for the error.
If you have any systematic error then it will not cancel nor will the average be accurate. It might be precise but not accurate. In other words if you take many samples from the distribution then the standard deviation of the means of those samples will be small but they won’t be accurate. The systematic error will still remain.
Temperature measurements are different measurements of different things using different instruments. There is no guarantee that the measurements will form a Gaussian distribution. With no Gaussian distribution you will never get complete cancellation of error. The uncertainty in the final result will grow, either by direct addition or by root-sum-square addition. Root-sum-square addition assumes you might get *some* cancellation of error but not complete cancellation.
If you have a distribution that is not Gaussian then the average is meaningless. The usual statistical descriptive factors of standard deviation and average simply do not apply.
Even worse when you combine northern hemisphere temperatures with southern hemisphere temperatures you get a multi-modal distribution. Not only are the seasons 180deg out of phase but the variance of temperatures in the winter is higher than in summer – meaning anomalies will be greater and combining data with smaller anomalies in summer than in winter skews the averages thus calculated.
And this doesn’t even begin to address the problems of trying to determine averages, be they direct or anomalies, from time varying, cyclical process like temperature!
Bottom line? Global temperature average is a farce! The actual uncertainty associated with it far outweighs the differences trying to be identified in the hundredths of a degree C.
“With no Gaussian distribution you will never get complete cancellation of error.”
You really don’t have a clue what you are talking about, do you?
Try throwing a six sided die a million times, and see how close the mean is to 3.5. Or generate a million values from a Poisson distribution and see if that is close to the mean.
Throwing a die is *NOT* the same thing as taking a series of measurements! There is no uncertainty in what the face of the die says!
It is *YOU* that really doesn’t have a clue.
And, once again, we see you ignoring UNCERTAINTY! You pick a set of stated values with no associated uncertainty! One more piece of evidence that you have no real understanding of physical measurements that have uncertainty and how to treat them.
As I keep pointing out, you are reading statistics books where only stated values are provided in the learning examples. No treatment of the uncertainty that might go along with those stated values.
You just never learn, do you?
“Throwing a die is *NOT* the same thing as taking a series of measurements! There is no uncertainty in what the face of the die says!”
Stop thinking like an engineer and try to understand what an example is. You said that if the measurement errors do not form a Gaussian distribution, then the errors will never cancel out. In this case the die roll represents the measurement errors, not the measurements, and the point is that despite being a uniform distribution the errors do cancel and tend towards the average. If it helps, assume the die is numbered {-3,-2,-1,+1,+2,+3}. Each number represents the measurement error, and take enough of them and the average error will tend to zero.
“And, once again, we see you ignoring UNCERTAINTY! You pick a set of stated values with no associated uncertainty!”
And again you keep flipping between talking about the distribution of measurements and the distribution of errors. But it doesn’t matter as in both cases the mean of the sample will tend to the mean of the distribution.
“Stop thinking like an engineer and try to understand what an example is.”
Eh?
We actual engineers agree with you, and are thankful for your good posts They are very clear and correct. But you might not be hip to the heavy dose of statistics we had to learn during our engineering lessons – and through out our careers. In particular, petroleum engineers, by necessity, are about half statistician.
You might be mislead by the fact that that most of those in these fora who claim engineering expertise, don’t.
You obviously didn’t learn anything about uncertainty. And, BTW, I learned a lot about statistics studying quantum effects in semi-conductors and in studying nuclear physics for my power engineering focus. (It’s why the Navy wanted me to be a nuclear power officer on submarines when I graduated).
Your statistics studying was apparently much like Bellman’s. Your textbooks had nothing in them about uncertainty associated with stated values. All examples only listed stated values, no uncertainty!
I must apologise for that cheap shot. It was meant to be sending up how Tim is is always telling me I’m thinking like a Mathematician, and should be thinking like an Engineer. But without that context it just looks like an insult to all engineers.
I certainly have no disrespect, quite the reverse, for Engineers in general, and wouldn’t like to suggest the Gormans are remotely typical of the profession.
Got it.
The Gorman’s, in particular, are either not credentialed engineers, or they got thru on fraternity files and/or mommy/daddy endowments. They are part of a tiny coterie here that follow the faith based meanderings of a couple of other posters. They substitute instinctual reactions for any nonintuitive facts. A good tell is the fact that a skeptic like Roy Spencer – who occasionally posts here – does not support their silliness in any way.
I had to work hard for my cred and find these particular appeals to faux authority infuriating. I have offered my Oklahoma professional engineering number twice in these fora, and a 30 second search would give my real name and year of award. I won’t aks them to do the same. Just don’t lie.
“The Gorman’s, in particular, are either not credentialed engineers, or they got thru on fraternity files and/or mommy/daddy endowments.”
Sorry bud, but I WORKED my way through college. In the hay fields of Kansas in the summer and in filling stations during the school term! Busted my butt. I also worked my butt off in high school and scored a small scholarship ($2000 per year).
If all you have is ad hominems then buzz off!
Credentials mean nothing if you don’t understand what you are talking about. And you have yet to offer ANY refutation to any point I have made, not a SINGLE ONE.
You apparently don’t even know what a 5-figure description of a data set is! And you are a credentialed engineer?
You mean *your* example? In which no uncertainty exists? You live in a world where uncertainty doesn’t exist! Join the rest of us in reality.
That’s correct. Because unless you have a Gaussian distribution there is no expectation that for every +u you have a countering -u.
Like I said, there is no uncertainty in a roll of a die. And uncertainty intervals have no probability distribution, not even a uniform one. In an uncertainty interval the true value has a probability of 1 and all other values have a probability of 0. The issue is that you just don’t know which value has the probability of 1. That’s *not* a uniform distribution!
This is circular logic. You start with a set of values that guarantees a Gaussian distribution and then say that proves that all error distributions are Gaussian. Your conclusion doesn’t follow from your premise. What if the dies had faces of -3, -1, -0.5, +1, +4, and +5? Will they all cancel when you roll a large number of times? When you are measuring different things with different measurement devices there is no guarantee that your errors will all be -3, -2, -1, +1, +2, +3. That only happens when you are measuring the same thing multiple times with the same instrument. And it assumes all error is random with no systematic error.
With (-3, -1, -0.5, +1, +4, and +5) you might get some cancellation but not total like in a Gaussian distribution. That’s when you have to make a decision as to whether the uncertainties add directly or if they add in quadrature.
No flipping here. Uncertainty doesn’t have values or a distribution, it has an interval. *YOU* keep wanting to talk about values from a distribution – that’s what the STATED value is. It’s just more proof that even after all of our discussions you have yet to internalize what uncertainty is in the real world.
“Like I said, there is no uncertainty in a roll of a die.”
I didn’t realise you had precognition.
“You start with a set of values that guarantees a Gaussian distribution and then say that proves that all error distributions are Gaussian.”
As I’ve said elsewhere you don’t seem understand what a Gaussian distribution is, which is causing a great deal of confusion in this discussion. What I think you mean is an error distribution where the mean is not zero. This does not have to be a Gaussian distribution, and a Gaussian distribution does not have to have a mean of zero.
“What if the dies had faces of -3, -1, -0.5, +1, +4, and +5? Will they all cancel when you roll a large number of times?”
No. They would converge to the mean, ~0.92. This would be the case if you have a systematic bias in your instruments. You would have a precise but not true mean.
But this leaves two problems for your argument.
That is *NOT* what I mean. When your error distribution is a Gaussian distribution, i.e. equal errors above and below zero, you have a Gaussian error distribution!
The uncertainties you list are absolutely a Gaussian distribution around zero! (-3, -2, -1, +1, +2, +3) *ARE* a Gaussian distribution around zero! How can it be anything else?
An error distribution that is Gaussian *cancels*, the average is considered to be the true value.
An error distribution that is not Gaussian around zero means you have systematic error and the errors will *NOT* cancel leaving the mean with an uncertainty interval! There will always be an uncertainty interval surrounding the mean if the errors don’t cancel!
Why is this so hard for you to understand?
Good. Now, how does measurements of multiple different things using different measurement devices generate a random distribution of error around a value of zero?
Even if there is no systematic bias in any of the measurement devices will all those measurements have offsetting errors that cancel? How do you know that would be the case?
The uncertainty of the mean of measurements of different things using different instruments *will* grow as you add measurements with uncertainty. Why do you think Taylor even goes into Chapter 3 if this is not the case? What’s the purpose of *ADDING* uncertainties in quadrature if the uncertainty doesn’t grow when you add elements?
All you do is just revert to the same old argument – all error is random around zero and therefore cancels no matter how many different measurements you have! You just keep blowing off the fact that things like temperature are measurements of different things using different measurement devices that do *NOT* generate a random error distribution. Therefore the errors do *not* cancel, not even if there is no systematic error involved!
That’s the whole point of adding in quadrature! There *will* be some cancellation of random error, it just won’t be complete! And systematic error will always remain!
YOU STILL HAVEN’T ACTUALLY STUDIED TAYLOR AND DONE THE EXERCISES! If you had you would understand all this! Instead you just remain in the same old box that all error is random around a zero base and therefore it all cancels. Thus making the standard deviation of the sample means the uncertainty of the mean calculated from those sample means because you can ignore propagation of uncertainty from the individual elements – it all CANCELS!
“The uncertainties you list are absolutely a Gaussian distribution around zero! (-3, -2, -1, +1, +2, +3) *ARE* a Gaussian distribution around zero! How can it be anything else?”
I was prepared to accept you’d made a simple mistake, and simply didn’t understand what a Gaussian distribution was. But even after I’ve pointed it out, you fail to accept your error. It would only take you a few seconds to check on the internet, but instead you double down on your ignorance.
In other words you can’t actually show where I am wrong so you just state that I am and move on. That’s the argumentative fallacy of Argument by Dismissal!
You set up an experiment where the cancellation of the random error values was guaranteed. And now you are whining because someone called you on it!
Just how old *are* you anyway?
We are wrong because every definition of Gaussian shows you are wrong. If you disagree, point to your definition of Gaussian. Accusing me of just dismissing your arguments when you state “The uncertainties you list are absolutely a Gaussian distribution around zero!” is pretty ironic.
On the assumption that you won’t bother to check your facts let me do it for you
https://www.math.net/gaussian-distribution
My emphasis.
https://www.statology.org/normal-vs-uniform-distribution/
Lists some key differences between normal (Gaussian) and uniform distributions.
From sciencedirect.com
It’s pretty simple. And there is simply no way for a conglomeration of measurements of different things using different measurement devices to reliably produce a distribution with an equal number of measurements above and below the mean value. That applies for both the stated value and its associated uncertainty.
If the distribution is skewed at all then you simply don’t get complete cancellation of uncertainty meaning you *must* use either direct addition or root-sum-square to evaluate total uncertainty.
What bit of “bell shaped curve” don’t you understand? A uniform distribution is not bell shaped, so not a Gaussian.
You said my uniform distribution was Gaussian, and that’s where you are wrong. You keep saying that any symmetrical distribution is Gaussian. And you don’t seem to understand that a Gaussian does not necessarily have a mean of zero.
And you’re final point is wrong. A distribution can be skewed and still trend towards zero with sampling. It just requires the mean to be zero. This should be pretty obvious.
“What bit of “bell shaped curve” don’t you understand? A uniform distribution is not bell shaped, so not a Gaussian.”
So what? In an uncertainty interval associated with multiple measurements of different things using different devices not every value can be the true value! A uniform distribution is as wrong as a Gaussian distribution in trying describe such an uncertainty interval.
Only ONE value can be the true value, therefore it has a probability of 1. All others cannot be the true value so they have a probability of 0. The issue is identifying which value has the probability of 1! You can’t fix this issue by just assuming that *all* values in the interval has an equal possibility of being the true value.
The so what, is that you were insisting that a uniform distribution was a Gaussian, saying I was being deceitful in saying it wasn’t and refusing to accept any possibility that you had misunderstood something.
So now you realise your error you deflect and change what was being discussed. We were talking about the distribution of the error, that was what you were talking about when you were insisting that only a Gaussian distribution would have errors that cancel. But now you want to turn the discussion into another pointless philosophical argument about the definition of an uncertainty interval.
“The issue is identifying which value has the probability of 1! You can’t fix this issue by just assuming that *all* values in the interval has an equal possibility of being the true value.”
Using that logic, you can’t fix the issue at all. All measurements have errors, and you can never know what one value has the probability of 1.
“You said my uniform distribution was Gaussian”
An error data set of (-3, -2, -1, +1, +2, +3) is actually not a probability distribution at all! You can assume that each value is equally probable but then that probability doesn’t correctly describe an uncertainty interval. What this does is define an uncertainty interval of X +/- 3 where X is the stated value! And, again, +/- 3 does not mean that all values in the interval X-3 to X+3 have an equal probability of being the true value. Only ONE value is the true value!
“An error data set of (-3, -2, -1, +1, +2, +3) is actually not a probability distribution at all!”
It’s a discrete probability distribution.
“You can assume that each value is equally probable but then that probability doesn’t correctly describe an uncertainty interval. ”
The probability isn’t trying to describe an uncertainty interval.
“What this does is define an uncertainty interval of X +/- 3 where X is the stated value!”
Make your mind up, does define an uncertainty interval or doesn’t it?
“Only ONE value is the true value!”
Literally none of the values in that error distribution can be the true value.
“And you don’t seem to understand that a Gaussian does not necessarily have a mean of zero.”
All Gaussian distributions can be normalized to where the mean is Zero!
As can any distribution.
“A distribution can be skewed and still trend towards zero with sampling. It just requires the mean to be zero. This should be pretty obvious.”
What can trend to zero? The standard deviation of the sample means?
You *still* apparently think that all error can cancel, even in a skewed skewed distribution and therefore uncertainty can be ignored in favor of the standard deviation of the sample means.
“What can trend to zero? The standard deviation of the sample means?”
The mean will tend to zero.
“The mean will tend to zero.”
And still be as inaccurate as all git out!
“That can only happen if there is no systematic error.”
Please try to focus. We are describing the error distribution. If the mean is zero then there is no systematic error.
“You *still* apparently think that all error can cancel, even in a skewed skewed distribution and therefore uncertainty can be ignored in favor of the standard deviation of the sample means”
You keep failing to distinguish me pointing out why your maths is wrong, from me making a real world claim. One again, the issue with whether an error probability distribution will have a sample mean that tends to zero as samples increase has nothing to do with how many times you add the word skewed to it. What matters is what the mean of the probability distribution is.
“Please try to focus. We are describing the error distribution. If the mean is zero then there is no systematic error.”
Malarky! You *still* demonstrate that you don’t understand uncertainty at all!
See attached picture. X marks the center of the target, the “true value”. The little dots are where your rifle shoots when aimed at the X. Plot all the little dots and normalize the distribution. The mean of the shots will be at zero, the distribution will be symmetric, and distribution will be close to Gaussian. Take a million shots and do 100 samples of 1000. The standard deviation of the sample means will be small. BUT that mean calculated from the sample means simply won’t be accurate. The systematic error will remain. You can’t get rid of it. You can’t assume that all the error will cancel and you can use the standard deviation of the sample means as your uncertainty of the mean.
In fact, if you repeat the experiment with a different load, i.e. different bullet weights and different powder loads, you may still wind up with a precise grouping of shots but your accuracy may get worse. Thus the meme that adding different things with different uncertainty *adds* to the overall uncertainty, As you add data using more and more different loads, the overall uncertainty probably will add by root-sum-square. But it will *not* equal the standard deviation of the sample means. You must propagate the uncertainty from the individual elements into each mean you calculate and then that propagated uncertainty of the sample means will propagate into the uncertainty of the mean calculated using the sample means.
“See attached picture”
I’ll imagine it as I’m sure is the usual one used to demonstrate the difference between precision and trueness.
“The systematic error will remain.”
As I’ve told you repeatedly I agree. But as we are discussing here, the assumption is that in this hypothetical case there are no systematic errors because the mean of the error distribution is zero. I agree, no real world example will have zero systematic error.
The trouble is you keep jumping from these hypothetical examples you set up, and when I try to explain why your example is wrong, because you don’t understand what a Gaussian distribution is, or that a skewed distribution can have a mean of zero, you immediately jump to “but what about systematic errors!?”
The problem is, for some reason you think a) systematic errors mean you have to add the uncertainties when taking, a mean, and b) for some reason this doesn’t happen if all the errors follow a Gaussian distribution, which c) you can only get by measuring the same thing with the same instrument.
And I keep asking, why do you think you are less likely to get less of a systematic error if you keep using the same instrument, then if you use multiple different instruments?
You forgot to emphasize the word “symmetrical”!
And you have yet to provide any kind of a link that proves that random error is *always* symmetrical around a mean – i.e. a Gaussian distribution.
I’m sure you don’t have a textbook on statistics that states this because I have yet to find a university level textbook that even addresses how to handle uncertainty let alone make the claim that uncertainty is always a Gaussian distribution!
The problem with this is that every value in an uncertainty interval is *NOT* equally likely to occur! One value has a probability of 1 for being the true value and all the rest have a probability of 0 of being the true value. The issue is you just don’t know which value has the probability of 1! There is only ONE true value, not multiples.
I emphasised the words that explained why you were wrong. You are falling into a logical fallacy, assuming that as all Gaussians are symmetrical then all symmetrical distributions must be Gaussian.
And again, symmetrical about a mean does not mean it is symmetrical about zero.
Why should I give you text book references for something I don’t believe is true. I do not assume that all random error is symmetrical around a mean. I don’t know or care if this is likely to be true in the real world, I’m just pointing out you’re assumptions are wrong. An error distribution does not have to be Gaussian or symmetrical about zero to tend to cancel out with increasing measurements.
This is really obvious. The mean of repeated samples from a distribution will tend to the mean of that distribution. The clue’s in the word mean. If the meanof an error distribution is zero that means the repeated measurements tends to zero, and therefore the measurement errors tend to cancel out.
The Gaussian is an exponential function:
f(x)=a exp[ -(x – b)^2 / (2c^2) ]
If it is “skewed” it is not a Gaussian, duh.
“If it is “skewed” it is not a Gaussian”
Correct. Do you have a point?
“And again, symmetrical about a mean does not mean it is symmetrical about zero.”
A Gaussian distribution can always be normalized to the mean being zero!
“Why should I give you text book references for something I don’t believe is true. I do not assume that all random error is symmetrical around a mean. ”
Of course you do! You do so when you claim the standard deviation of the sample means is the uncertainty of the mean calculated from the sample means. That can only be true if all error cancels!
“An error distribution does not have to be Gaussian or symmetrical about zero to tend to cancel out with increasing measurements.”
And how does that work? If you have more values on one side of the mean than on the other side then how does cancellation work?
Does one error value on the small side of the mean cancel out TWO values on the large side of mean? How does *that* work?
In essence you are saying that if you take enough measurements you will eventually get a Gaussian distribution of errors!
“The mean of repeated samples from a distribution will tend to the mean of that distribution. “
One more time! That does not mean that the mean calculated from the sample means is ACCURATE! The standard deviation of the sample means does *NOT* define the accuracy of the calculated mean unless ALL error is symmetric and cancels!
And you you say you don’t assume that all random error is symmetric around zero? Of course that’s what you assume! It’s the only way you can justify saying the standard deviation of the sample means define the uncertainty of the mean calculated from the sample means.
“A Gaussian distribution can always be normalized to the mean being zero!”
As can any distribution. Stop deflecting.
“Of course you do! You do so when you claim the standard deviation of the sample means is the uncertainty of the mean calculated from the sample means. That can only be true if all error cancels!”
You can keep lying about what I’ve said till the cows come how, and I’ll just keep telling you your wrong.
You seem to be admitting that I never actually said it now, but that it was an inference you made. Only problem is your inference is based on faulty logic. You think that only a distribution that is symmetrical can have a mean that tends to zero, and therefore if I say the mean tends to zero I’m saying the distribution must be symmetrical. This is a problem with your understanding, not with what I’m saying.
And whenever I’ve said the standard error if the mean is the standard error of the mean (not calculated from sample means), that has been in the context of explaining why your claims based on random errors is wrong. You claimed that 100 temperature readings each with a random independent uncertainty of ±0.5°C would have an uncertainty in the mean equal to the uncertainty of the sum, i.e. ±5.0°C. Your argument about the uncertainty of the sum only makes sense if you are assuming there are no systematic errors.
When it’s clear your argument is wrong you try to turn this into one about systematic errors. But I’ve never said there can be no systematic errors and if there are they will not reduce with sample size.
“You think that only a distribution that is symmetrical can have a mean that tends to zero, and therefore if I say the mean tends to zero I’m saying the distribution must be symmetrical. This is a problem with your understanding, not with what I’m saying.”
There is no guarantee that a non-symmetric distribution will either tend to zero, and that includes the error distribution as well as the stated value distribution.
You simply cannot assume that a the mean of a non-symmetric distribution tends to zero or that the distribution of the errors tends to zero. You’ll be wrong most of the time.
As you’ve been told before, a Gaussian distribution gives you some expectation as to what the next value will be. That’s not true of a skewed distribution and it is ESPECIALLY not true when the distribution is not made up of similar things!
There is no difference between combining temperatures from different stations with different measuring devices and combining the weights of all the fruit in a diversified orchard using a different scale for each measurment. Combining the weights of apples, pears, oranges, peaches, etc into a distribution and then calculating the mean weight will not give you any expectation of the weight of the next piece of fruit off the wagon. You’ll have a multi-modal distribution where the average tells you nothing useful.
“There is no guarantee that a non-symmetric distribution will either tend to zero, and that includes the error distribution as well as the stated value distribution.”
Stop twisting my words. I said a non-symmetric distribution will tend to it’s mean, and if that mean is zero it will tend to zero. I also say that is the case for a symmetric distribution. If you don;t agree, just give me one example of a non-symmetric distribution where repeated sampling will tend to a mean that is different from the distribution mean.
“As you’ve been told before, a Gaussian distribution gives you some expectation as to what the next value will be.”
It gives you no more expectation of what the net vale will be than any other distribution.
“That’s not true of a skewed distribution and it is ESPECIALLY not true when the distribution is not made up of similar things!”
You keep making claims like this with zero explanation or evidence. Nor do you define what you mean by expectation.
“Combining the weights of apples, pears, oranges, peaches, etc into a distribution and then calculating the mean weight will not give you any expectation of the weight of the next piece of fruit off the wagon.”
And now you return to changing the subject again. This discussion has nothing to do with predicting the next piece of fruit, it’s to do with whether measurement uncertainties defined by a skewed distribution can cancel.
“And how does that work? If you have more values on one side of the mean than on the other side then how does cancellation work?”
Suppose you have a fair die with the numbers {-5, -4, -3, -2, -1, +15}. Not symmetrical, 5 times as many negatives as pluses, but the mean is 0. How close to zero do you think the mean of 1000 or 1000000 throws will be?
“In essence you are saying that if you take enough measurements you will eventually get a Gaussian distribution of errors!”
It isn’t necessary to the argument, but yes, that’s the Central Limit Theory.
What does the mean have to do with cancellation of error? What if those are the uncertainties of the data element? Do the uncertainties cancel?
You’ve led this sub-thread down the rabbit hole trying to avoid having to admit that you can’t assume all error cancels in a non-symmetric distribution of errors – i.e. measurements of different things using different measuring devices.
You won’t even study Taylor, Chapter 3, and work out all the problems for fear of having to admit that uncertainty adds either directly or in root-sum-square in a non-Gaussian distribution of error.
Find someone else to indulge you in your delusions about all error cancelling all the time so you can use the standard deviation of the sample means as your measure of uncertainty!
“What does the mean have to do with cancellation of error?”
What do you think cancellation of errors means? If I measure a number of different things and take their mean, and each measurement has a random error, then the measurement error of the mean will be the mean of the errors, and if they tend to zero the errors are cancelling out.
You seem to think that errors can only cancel out if every plus is matched with a negative, whereas I’m saying if you are taking a mean, a +2 can cancel out two -1s, a +10 can cancel out five -2s, etc.
“What if those are the uncertainties of the data element? Do the uncertainties cancel?”
Your going to have to say what you mean by uncertainty, as people keep insisting that errors are not uncertainty, and that uncertainties cannot have a probability distribution.
All I’m saying is that if random errors tend to cancel out, I’m not sure where you think the increasing uncertainty is coming from.
“You’ve led this sub-thread down the rabbit hole trying to avoid having to admit that you can’t assume all error cancels in a non-symmetric distribution of errors – i.e. measurements of different things using different measuring devices.”
Of course you cannot assume that in the real world. All I’ve been trying to get you to understand is that this has nothing to do with whether the error distributions are Gaussian or symmetric, or made up from multiple different distributions, all that matters is if the mean is zero.
“You won’t even study Taylor, Chapter 3, and work out all the problems…”
Stop treating this like a sacred text with hidden meanings, and just tell me which problems I need to solve in order to understand why a non-Gaussian error distribution won;t tend to it’s mean, and then I’ll tell you whether this is correct or not.
“Find someone else to indulge you in your delusions about all error cancelling all the time so you can use the standard deviation of the sample means as your measure of uncertainty!”
Maybe I will, but first you must stop telling lies about me. I’ve repeatedly explained why I don’t believe any of the things you’ve just claimed about me.
“One more time! That does not mean that the mean calculated from the sample means is ACCURATE!”
Please focus. We are talking about the distribution of errors. If the mean of that distribution is zero there is no systematic bias, the calculated mean will be accurate as it will tend to zero.
“And you you say you don’t assume that all random error is symmetric around zero?”
I’m assuming that if, and only if, the probability distributions of measurement errors is zero, then there will be no systematic measurement errors and all errors are random. I am not assuming this ever happens in the real world.
Me focus?
You can’t stay focused in two consecutive messages. Again, you are trying to avoid the inevitable conclusion that errors that aren’t symmetric don’t cancel and must be added in either direct or root-sum-square addition. That means that in a distribution of different things measured by different things the propagated uncertainty is always the sum of the individual uncertainties. That applies to the global average temperature. Thus every time you add one more measurement to the data set the propagated uncertainty goes UP! The uncertainty of the mean is *NOT* the standard deviation of the sample means. It is propagated uncertainty from the individual elements making up the distribution.
This is my last post on this subject in this thread. I will not humor your delusions any longer. You are the typical troll.
“Again, you are trying to avoid the inevitable conclusion that errors that aren’t symmetric don’t cancel and must be added in either direct or root-sum-square addition.”
And so we are back to argument by assertion. I give you a testable hypothesis, you refuse to test it and simple assert it’s inevitable I’m wrong.
I on the other hand find it difficult to understand why you cannot see the inevitable truth that the mean of random elements drawn from a probability distribution will tend to the mean of that probability distribution. Or the inevitable consequence of this is that if the mean of the distribution is zero, then the sample mean will tend to zero.
And to be clear, when I say the sample tends to the distribution mean, I mean that the larger the sample the more likely it will be that the sample mean will be close to the distribution mean.
But you could easily prove me wrong by explaining why you think that’s wrong, and what you think the mean will tend to be. Or better yet you could run some tests to see what happens. But you won’t. You’ll just ramble on about how everything just keeps adding up because that’s what you think some text book said, call me a troll and run away in a huff.
I guess I’m not going to get an answer to my question, so I’d better test it myself. Selecting measurement errors from the deliberately absurd, skewed distribution {-5, -4, -3, -2, -1, +15} with equal probability. According to Time, as this is not a symetrical distribution, the values cannot cancel and so the mean will not tend to zero with increased sample size.
I calculated a running mean for these values up to a sample size of 10000. Repeated over 10 different trials. Here are the results, starting at N = 5.
Here are the figures for some values of N.
N = 0
N = 100
N = 1000
N = 10000
“The problem with this is that every value in an uncertainty interval is *NOT* equally likely to occur! One value has a probability of 1 for being the true value and all the rest have a probability of 0 of being the true value. The issue is you just don’t know which value has the probability of 1! There is only ONE true value, not multiples.”
The uniform distribution was for the measurement errors. Your the one who said “With no Gaussian distribution you will never get complete cancellation of error.” So I assume you accept that errors form a probability distribution.
“Good. Now, how does measurements of multiple different things using different measurement devices generate a random distribution of error around a value of zero?”
Who says they will? Your claim is that the uncertainties will increase with sampling. That is the point I’m disagreeing with. Again, I’ll ask you why you think systematic errors will be a problem with multiple measurements if different things, but not a problem when measuring a single thing with the same instrument?
“Your claim is that the uncertainties will increase with sampling. “
That is *NOT* my claim. How many times do you have to be told that?
My claim is that adding more measurements of different things using different measurement instruments to a data set causes the final uncertainty to grow. Either by direct addition or by root-sum-square addition! It’s what Taylor’s entire Chapter 3 is about!
“ Again, I’ll ask you why you think systematic errors will be a problem with multiple measurements if different things, but not a problem when measuring a single thing with the same instrument?”
I’ve told you multiple times that systemic error can’t be cancelled, either in multiple measurements of the same thing using the same instrument or in multiple measurements of different things using different instruments!
Learn it, live it, love it!
“The uncertainty of the mean of measurements of different things using different instruments *will* grow as you add measurements with uncertainty. Why do you think Taylor even goes into Chapter 3 if this is not the case? What’s the purpose of *ADDING* uncertainties in quadrature if the uncertainty doesn’t grow when you add elements?”
You’ve ignored the other 500 times when I’ve tried to explain, so I doubt this will make a difference – but you are confusing adding with taking a mean. The uncertainties add when you add values. The uncertainty in a sum of values is bigger than any individual uncertainty. But when you divide the sum by the sample size you also divide the uncertainty by the size, and this makes the uncertainty in the mean smaller.
“All you do is just revert to the same old argument – all error is random around zero and therefore cancels no matter how many different measurements you have!”
Not an argument I’ve made. I keep saying there may be systematic errors in any measurement.
“You just keep blowing off the fact that things like temperature are measurements of different things using different measurement devices that do *NOT* generate a random error distribution.”
Of course all temperatures are different. There would be no point taking an average if they were all the same. I still don’t know why you think errors caused by different things will not generate a random error distribution. That seems impossible – there has to be a distribution.
“Therefore the errors do *not* cancel, not even if there is no systematic error involved!”
And I’ve demonstrated that they do, but you just keep asserting it’s impossible as your believes don’t allow it.
“but you are confusing adding with taking a mean.”
Nope! You are the only one doing that!
If I take three boards , each from a different sawmill and each with a different uncertainty in its overall length, and measure each one with a different measuring device I will get an estimate of their total length. That estimate will be the sum of the three stated values and the total uncertainty will be the direct sum of the combined uncertainties of the boards themselves and the uncertainties of the measurement devices. That has absolutely nothing to do with the mean value of their lengths.
If I *do* calculate their average length then the uncertainties associated with each will propagate into the uncertainty of the mean. If you have a million boards and you take samples the exact some thing will apply. The mean of each sample will have the uncertainties of the individual elements in the sample propagate into the sample mean.
YOU want to believe that by sampling the universe you can ignore the uncertainty associated with the data elements and that the standard deviation of the sample means is the uncertainty of that calculated mean.
You simply ignore the fact that such an assumption can be disproven by considering data elements that have systematic error. That systematic error will show up in the calculated mean showing that it is *NOT* just the standard deviation of the sample means that determines the uncertainty.
If you have a million data entries, each value 50 + 5 (no uncertainty, just a systematic offset), then you believe apparently that you can sample those million entries and come up with an average of 50 and an uncertainty of zero – i.e. the standard deviation of the sample means will be zero. All sample means will be exactly 50 and so will the calculated mean of the sample means!
And yet that calculated mean of the sample means will be offset by a value of 5 – meaning your calculated mean of the sample means is inaccurate as all get out! It will be off by 10%!
“If I *do* calculate their average length then the uncertainties associated with each will propagate into the uncertainty of the mean.”
You’re avoiding saying how you propagate these uncertainties into the uncertainty of the mean. I say you will have to divide the total uncertainty by the number of boards, you in the past have insisted that you don noting to the total uncertainty. Hence my claim that you are saying the uncertainty of the mean is the same as the uncertainty of the total.
“YOU want to believe that by sampling the universe you can ignore the uncertainty associated with the data elements and that the standard deviation of the sample means is the uncertainty of that calculated mean.”
And you keep dodging the problem by talking about what I believe. And not getting that right. What I believe, and have told you on numerous occasions, is that the larger the sample size the more likely it is that random measurement errors will cancel, and so the measurement uncertainty of the mean will reduce. What I also believe is that systematic measurement errors will not cancel and so will still be present in any uncertainty of the mean, regardless of how big your sample size is. What I also believe is that in many real world cases the measurement uncertainties are likely to be small compared with the uncertainties caused by sampling, whether random or systematic.
“If you have a million data entries, each value 50 + 5 (no uncertainty, just a systematic offset), then you believe apparently that you can sample those million entries and come up with an average of 50 and an uncertainty of zero”
That is absolutely, positively, what I do not believe.
I do believe that it is pretty stupid to be sampling a million data entries when there is such a large systematic error in your measurements. What I also believe is that you keep confusing your argument with this constant emphasis on systematic errors. You keep claiming that uncertainties reduce when measuring the same thing with the same instrument repeatedly, but the uncertainties increase when using different instruments. But if it’s systematic errors you are worried about, they can occur both with the same instrument or different instruments, so why make the distinction?
“And yet that calculated mean of the sample means will be offset by a value of 5 – meaning your calculated mean of the sample means is inaccurate as all get out! It will be off by 10%!”
I agree. The problem is that shows your own logic is wrong. You insist that you have to add the uncertainties to get the uncertainty of the sum, and not divide by sample size to get the uncertainty of the mean. If you believed this, you would be claiming the uncertainty here would be 50 ± 5,000,000.
“Of course all temperatures are different. There would be no point taking an average if they were all the same. I still don’t know why you think errors caused by different things will not generate a random error distribution. That seems impossible – there has to be a distribution.”
The entire Taylor Chapter 3 is about why this doesn’t happen!
If multiple measurements of different things by different devices generate a random error distribution then why do we worry about uncertainty at all? All the errors will cancel out in anything that you do! All beams spanning a foundation will always work out exactly correct because all uncertainty will cancel! All stud walls will always work out perfectly level so you’ll have no waves in the attached drywall because all error will cancel out! All rifles will see a one-hole grouping of shots on a target because all error will cancel out each time!
Of course multiple measurements of different things using different devices will generate a distribution of errors! But there is no guarantee that the distribution will be anywhere near a Gaussian distribution which is required for all the error to cancel! That is why the uncertainties, i.e. the error, either adds directly or by root-sum-square!
“And I’ve demonstrated that they do, but you just keep asserting it’s impossible as your believes don’t allow it.”
You really didn’t do anything of the sort. Like I pointed out already you built your conclusion into the assumptions of the experiment. You started out with a Gaussian distribution and of course wound up with exactly what you wanted! Just like the climate scientists do!
“YOU STILL HAVEN’T ACTUALLY STUDIED TAYLOR AND DONE THE EXERCISES! If you had you would understand all this! Instead you just remain in the same old box that all error is random around a zero base and therefore it all cancels. Thus making the standard deviation of the sample means the uncertainty of the mean calculated from those sample means because you can ignore propagation of uncertainty from the individual elements – it all CANCELS!”
Taylor is not a religious text. I don’t have to learn it by heart to get some divine inspiration. I’ve pointed out all the parts where Taylor agrees with known statistics, but you keep insisting that there is some deeper meaning that Taylor only revels in the hidden sections of the text, to keep the infidels from discovering the sacred truth.
All this is nonsense. You don’t have to use an argument from authority, to know that bigger sample sizes are better than smaller ones. That it’s not possible for the measurement uncertainty of the mean to be greater than the uncertainty of any single measurement. You can work it out yourself, and you can test it.
“Taylor is not a religious text. I don’t have to learn it by heart to get some divine inspiration.”
Of course it isn’t a religious text. But it is one of the best textbooks for explaining how to handle uncertainty. Even Bevington says right in his book that his textbook is focused solely on situations with no systematic error, only random error and Gaussian error at that!
The fact that you refuse to study Taylor and work the example stands as proof that you are simply uninterested in having your preconceptions about all error being Gaussian and canceling destroyed.
Taylor agrees with standard statistics WHEN THE UNCERTAINTY IS PURELY RANDOM! The exact quotes on this have been provided to you multiple times! And you absolutely REFUSE to accept that.
“You don’t have to use an argument from authority, to know that bigger sample sizes are better than smaller ones.”
That *ONLY* applies when you have Gaussian random error! Until you accept that you will never actually understand metrology and uncertainty!
It is truly simple to understand. The more uncertainty that you add the more uncertainty you get! It is only when you have solely random Gaussian error that you get complete cancellation. In all other situations the more uncertainty you add the more you get!
Close your statistics textbook which simply doesn’t address uncertainty. Study Taylor!
“Uncertainty doesn’t have values or a distribution, it has an interval.”
As we keep discussing this is not true. It doesn’t matter if you define uncertainty in terms of errors or in terms of your believe system as to where the true value lies, there is still an implied probability distribution. If there wasn’t, there wouldn’t be any point in talking about standard uncertainty verses expanded uncertainty.
Again, there is no probability distribution. If there was then you could assign a probability to each value in the interval for it being the true value. If I give you a stated value of 50 +/- 5 then what is the probability that the true value is 52? That it is 48? Is the probability that it is 52 the same that it is 48?
I know that many statisticians like to say that every value in the interval has an equal probability of being the true value but that just ignores reality. There is ONE value in the interval that is the true value. Only one. Not two. Not three. Not more than three.
If there is only ONE VALUE that is the true value then it must, by definition, be the one value that has a probability of 1 of being the true value. All the rest have a probability of zero of being the true value. Once again, the issue is that you simply don’t know which value has the probability of 1 – but that does *NOT* mean that all values have the same probability of being the true value.
That is why you propagate uncertainty as an interval and not as a value.
Why do you keep trying to expound on things you *obviously* do not understand at all?
go here: https://www.itl.nist.gov/div898/handbook/mpc/section5/mpc57.htm
“All uncertainty components (standard deviations) are combined by root-sum-squares (quadrature) to arrive at a ‘standard uncertainty’, u, which is the standard deviation of the reported value, taking into account all sources of error, both random and systematic, that affect the measurement result.” (bolding mine, tpg)
————————————————————
If the purpose of the uncertainty statement is to provide coverage with a high level of confidence, an expanded uncertainty is computed as
U = k u
where k is chosen to be the tα/2,ν critical value from the t-table for v degrees of freedom.
For large degrees of freedom, it is suggested to use k = 2 to approximate 95% coverage. Details for these calculations are found under degrees of freedom.
———————————————————–
Expanded uncertainty is used to increase the confidence level in the uncertainty value by including a degree of freedom factor.
You are a troll. You keep throwing out nonsense hoping something will stick. You can’t even tell that it is nonsense!
Absolutely correct.
Total bullshit, an uncertainty value implies NO distribution, regardless if it is standard or expanded.
Your clue shields must be made of neutronium.
For once I’d like you to give me a testable example of how uncertainty will increase with non-Gaussian distribution, but for now I’ll extend my examples. Lets use an exponential distribution. Maybe I’m measuring radioactive decay.
I’ll generate a sample of random values from the exponential distribution with the rate set to 1. But I’m not going to assume the values are measured accurately, so I’ll add a random error to each value, but the errors are uniformly distributed from a range of ±0.2.
Now neither the real values or the measurement errors are Gaussian, and so your hypothesis is
So what sort of results do you think I’ll get if I generate a sample of size 10 and take the mean, and how will it change if I increase the size to 100, 1000 or even a million? Will the uncertainty increase with sample size or will it decrease? Should I expect the result to be closer to 1 with the smaller sample size, or with the bigger samples?
Feel free to test this yourself, but here are my results. For each sample size I repeated the test 5 times and calculated the mean in each case (remember the true average is 1).
n = 10
n = 100
n = 1000
n = 1000000
That’s to 2 decimal places. To make the n=1000000 case clearer I’ll add a couple more places
You started with a uniformly distributed error distribution!
Again, what will you get if you have an error distribution that is not uniform!
Start with (-3, -1, -0.5, +1, +4, +5) and see what you get!
As I’ve said elsewhere, you’d get means that are out by +0.92 as there’s a systematic error in your measurements. This has nothing to do with using a uniform distribution.
This is why it’s better to use different instruments, to reduce the chance that they all have the same systematic bias – but for some reason you think that wouls make things worse.
How many times must I do this? Do we have to go over building a beam spanning a foundation for the umpteenth time?
You’ve never had to measure the journals on a crankshaft. Or *anything* actually involving measurements!
Have you ever even measured the tire pressures in your car tires using different gauges?
That’s a counting situation, not a measuring situation! You simply don’t understand metrology at all! Do any tech schools near you offer any machinist courses?
“so I’ll add a random error to each value, but the errors are uniformly distributed from a range of ±0.2.”
JUDAS H. PRIEST! So you fall right back into the same circular argument. You generate random values guaranteed to be Gaussian and then say it proves all error distributions must be Gaussian!
What in Pete’s freaking name do you think “uniformly distributed” means? It means you have an equal number of pluses and minuses! Just like your distribution of (-3, -2, -1, +1, +2, +3)!
Of course those will cancel! You just can’t seem to get out of that box you are trapped in.
Do the uncertainty intervals (-3, -1, -0,.5, +1, +4, +5) cancel? Are they uniformly distributed? Why would you expect to get uniformly distributed error distribution when you are measuring different things using different instruments?
Why do you think our professor in my first electronics lab cautioned us on trying to get the correct answer by averaging six different experiments built using different parts and measured with six different sets of instruments? The student at each position built their circuit with parts with uncertainty intervals that all added up create larger uncertainty in the overall circuit which were then measured with different instruments that had uncertainty intervals that each added even more to the total uncertainty at each station. These uncertainties were *NOT* a random distribution which cancelled allowing us to average them and get a “true value”!
And now we are right back to you ignoring the uncertainty associated with measuring different things with different instruments!
If there are systematic errors involved then you will *NEVER* approach the true value no matter how many samples of whatever size you take!
If you are measuring different things then the mean is meaningless in any case. If you have a pile of 2″x4″x 4′ boards and a pile of 2″x4″x8′ boards and you pull 100 samples from the piles will the average give you any expectation of what the length will be of the next randomly chosen board will be? Does it matter how precisely you calculate that mean if it doesn’t describe the boards you have?
It could have saved a lot of problems if you’d said at the start you didn’t know what a Gaussian distribution is.
A uniform distribution is not a Gaussian distribution.
If you are saying that the mean of the error distribution should be zero, then yes. If it is’nt then you have a bias, a systematic error, and that won’t cancel out. This is true if you are measuring the same thing with the same instrument, or different things with different instruments.
It doesn’t matter if it is a uniform distribution or a Gaussian distribution – you have equal numbers of plus and minus values which cancel in their sum!
YOU KEEP TRYING TO SAY THAT ALL ERROR CANCELS!
It doesn’t!
“YOU KEEP TRYING TO SAY THAT ALL ERROR CANCELS!”
And you keep shouting out these lies about me. I do not claim that all errors cancel. I say that all random would cancel if you could have a sample of infinite size. This would leave the systematic error.
I keep shouting it out because its TRUE! Your words show it. You believe that all error, even from multiple measurements of different things using different devices, cancels because it is random and Gaussian. You just tried to claim that in the message above!
Random error does *NOT* have to be Gaussian. It is only when it is Gaussian that it cancels! You just proved that what I am saying about you is TRUE!
I gave you a random error distribution that is *NOT* Gaussian. And you admitted that it didn’t cancel. And yet here you are, once again, trying to say that random error *does* always cancel!
You just can’t get out of your box, can you?
“Random error does *NOT* have to be Gaussian. It is only when it is Gaussian that it cancels! You just proved that what I am saying about you is TRUE!”
Or maybe, just maybe, the fact that you don;t understand what a Gaussian distribution is, leads to make incorrect deductions about what I’m saying.
“And yet here you are, once again, trying to say that random error *does* always cancel!”
I’ll say this yet again for anyone trying to follow this – I do not say that all random errors always cancel. What I say is that if your random errors have a probability distribution with a mean of zero, and if you took an infinite sample, all random errors would cancel.
“How many times must I do this? Do we have to go over building a beam spanning a foundation for the umpteenth time?”
None of which give a testable example of your hypothesis that increasing sample size will increase the uncertainty of the mean.
“That’s a counting situation, not a measuring situation!”
No, as I said I’m using an exponential distribution. I’m timing the gap between clicks. But it doesn’t matter what specific thing I’m measuring, the point was to use a non-Gaussian distribution.
“What in Pete’s freaking name do you think “uniformly distributed” means? It means you have an equal number of pluses and minuses!”
OK, so we can add uniform distribution to the list of terms you don’t understand.
A Poisson distribution *is* a counting distribution, it is not continuous, it is integer based!
An exponential distribution is a description of the time between successive events.
What does an exponential distribution have to do with temperature measurements and uncertainty?
In a non-Gaussian distribution the mean and the median are usually not the same. So how do you get random error cancellation around a true value – i.e. the mean? If you don’t get error cancellation then you *must* propagate the uncertainty through to any calculation of the mean!
“What does an exponential distribution have to do with temperature measurements and uncertainty?”
Nothing. I was giving you an example of a non Gaussian distribution.
“In a non-Gaussian distribution the mean and the median are usually not the same. So how do you get random error cancellation around a true value – i.e. the mean?”
You keep confusing terms, and I’m not sure here if you are talking about the population or error distribution. Assuming you mean the error distribution then even if it is skewed the mean will tend to the mean, not the median. So if the mean of the error distribution is zero the errors will tend to zero.
Say each measurement i is M_i = T_i + e_i, where T is the true vale and e is the error. Sum all the measurements and you have sum(M) = sum(T) + sum(e), and so mean(M) = mean(T) + mean(e). As the mean of all errors is zero, the mean of the sample of errors will tend to zero.
“So if the mean of the error distribution is zero the errors will tend to zero.”
But how often is the error distribution Gaussian? You keep spouting the religious belief that all error distributions are Gaussian. You even tried using a Gaussian error distribution to prove that all error distributions are Gaussian!
“Say each measurement i is M_i = T_i + e_i, where T is the true vale and e is the error. Sum all the measurements and you have sum(M) = sum(T) + sum(e), and so mean(M) = mean(T) + mean(e). As the mean of all errors is zero, the mean of the sample of errors will tend to zero.”
Only a Gaussian distribution will have a mean of zero! Again, you assume all error distributions are Gaussian.
Is (-3, -1, -0.5, +1, +4, +5) a Gaussian distribution? Does it have a mean of zero? It is a perfectly acceptable mean for a situation where you are measuring different things with different devices! Why do you keep saying that random error distributions are always Gaussian?
“But how often is the error distribution Gaussian? You keep spouting the religious belief that all error distributions are Gaussian. You even tried using a Gaussian error distribution to prove that all error distributions are Gaussian!”
And in today’s game of is Tim a troll or just dense, we see him repeatedly ignoring everything I’ve told him about Gaussian distributions and lying about what I have said.
For the last time I do not have any believe that all error distributions are Gaussian. I’ve specifically given examples where the distributions are not Gaussian but have a mean of zero, and I’ve discussed what happens if the distribution does not have a mean of zero whether it’s Gaussian or not.
“Only a Gaussian distribution will have a mean of zero!”
Tim says. Despite me having shown him an example of a non Gaussian distribution with a mean of zero.
“Is (-3, -1, -0.5, +1, +4, +5) a Gaussian distribution? Does it have a mean of zero?”
No and no. I’m sure I’ve already told you that.
“ It is a perfectly acceptable mean for a situation where you are measuring different things with different devices!”
What are you on about now? It’s a distribution not a mean. How would you think that is a likely distribution for errors caused by multiple devices? What would the distribution for a single one of those devices look like?
“Why do you keep saying that random error distributions are always Gaussian?”
Why do you keep lying about me? I have never said that. I’ve explicitly said the opposite.
“If you have a pile of 2″x4″x 4′ boards and a pile of 2″x4″x8′ boards and you pull 100 samples from the piles will the average give you any expectation of what the length will be of the next randomly chosen board will be?”
Here we go again.
Will the mean tell me the length of any specific board? No.
Will the mean give me any indication of the expected length of the next board? Yes to an extent. But it depends on what your objective is.
If the mean doesn’t describe the distribution then of what use is it?
It will *NOT* give you *any* expectation of the length of the next board. How can it! By definition the mean is supposed to be the value with the highest number of occurrences! If there are no occurrences of the mean then how can it give you any expectation of anything?
“By definition the mean is supposed to be the value with the highest number of occurrences!”
That is not the definition of the mean. If it was, there would be no need to distinguish it from the mode.
And the mean does not describe the distribution, it’s just one aspect of the distribution. The same for any other average. By definition an average is just a single value, it can never fully describe a multi dimensional object.
It *is* true for a Gaussian distribution. If it isn’t then you don’t have a Gaussian distribution and cancellation of random error is not complete!
The mean *is* one component of what is called descriptive statistics.
The mean and standard deviation *do* fully describe a Gaussian distribution. Again, if the mean and average don’t fully describe a distribution then you don’t have a Gaussian distribution and cancellation of random error is not complete!
You are hoist on your own petard! Not every error distribution is Gaussian. Yet *you* want to treat them as such so you don’t have to worry about propagating error! Just like the climate scientists.
Now, tell us all how multiple measurements of different things using different instruments can generate a Gaussian random error distribution so you don’t have to worry about error propagation!
“It will *NOT* give you *any* expectation of the length of the next board.”
Depends on what you mean by “expectation”. In the mathematical sense the mean is the expected value of the next board.
As always it depends on what you want of the average. The mean is giving you the “best” estimate in the sense of minimizing the error. The mode is giving the “best” estimate of what the next board will be in a probabilistic sense. Which is most useful depends on your requirements.
“Depends on what you mean by “expectation”. In the mathematical sense the mean is the expected value of the next board.”
If the next board can NEVER be the mean value then exactly what expectation is the mean giving you? It doesn’t matter if it is in a “mathematical” sense or a “reality” sense. It’s a false expectation.
“As always it depends on what you want of the average. The mean is giving you the “best” estimate in the sense of minimizing the error. “
And, once again, you are falling back into the same trap of thinking all error distributions have to be Gaussian!
“And, once again, you are falling back into the same trap of thinking all error distributions have to be Gaussian!”
Are you trolling at this point, or just being incredibly stupid? I’ve explained several times what a Gaussian distribution is, and nothing I said here depends on the distribution being Gaussian.
“If the next board can NEVER be the mean value then exactly what expectation is the mean giving you?”
It’s giving you an expectation of what the long term average value is, and a probabilistic expectation of what an individual selection will be.
Lets say instead of a box of planks we have a box of envelopes with different amounts of money in. Some have $1, some $100. You open a random sample and see that 40 have $100, and 60 $1. The mean is $46, and the mode is $1. Which value is going to help you decide if betting $10 to keep the contents of the next envelope is a good or bad bet?
Irony alert, level 42.
“science professionals”?
You mean those people that can’t figure out that the uncertainty from individual measurements of different things do *NOT* create a random, Gaussian distribution and therefore the uncertainty doesn’t cancel?
You mean those people that haven’t the slightest clue as to how to propagate uncertainty?
You mean those people that think the GUM applies to measurements that have systematic error and are therefore not subject to random cancellation of all error?
You mean those people that think a multi-modal distribution can be described by the usual standard deviation and average characteristics instead of the usual five-figure description? Do you even know what the five-figure description of a distribution *is*?
You mean those people that don’t understand that an average or trend line of a time series is famously suspect?
You mean those people that can’t figure out that the sun traverses the surface of the earth in a sine wave pattern thus impacting the correlation between two individual measurement stations as cos(ⱷ) where ⱷ is a function consisting of numerous factors such as distance, humidity, elevation, terrain, etc?
My guess is that you don’t understand the impacts of anything I’ve posted here. All you have is your religious dogma as spouted by you “science professional” priests!
Same tired old, long refuted spews of truly disgraceful Timian ignorance, yet again on shameful parade. Multiple commenters here have already ripped these so-called “arguments” completely to shreds multiple times. Addressing the foolishness (and dishonesty) of these “arguments” yet again would only be redundant.
Timmy Boy trots out these silly pseudo-scientific head-in-the-sand excuses just to avoid having to face the reality of a warming world driven by human greenhouse gas emissions.
And specifically, on this particular topic: Tim has never, ever read any of the actual Argo temperature measurement research publications. None. Until he does, anything he says about it can be regarded as little but willfully ignorant handwaving blather.
Nope. No one has even tried to refute them. Neither have you. You have just resorted to your typical use of argumentative fallacies, this one being a False Appeal to Authority.
And you can’t refute a single one. Why is that? If you have nothing concrete to offer then why do you insist in showing off your ignorance?
In other words you didn’t even bother to go look up the reference I gave you. Hadfield, 2007. Typical. Just fall back on your religious dogma.
Repeat: Tim has never, ever read any of the actual Argo temperature measurement research publications. None. Until he does, anything he says about those measurements can be regarded as little but willfully ignorant handwaving blather.
”avoid having to face the reality of a warming world driven by human greenhouse gas emissions.”
Hmmm. What’s the correct Equilibrium climate sensitivity?
Hmmm. What has the “correct equilibrium climate sensitivity” got to do with this question, Mike? Just randomly throwing irrelevant red herring non-sequiturs into the discussion now, are we?
As long as ECS is any value at all higher than 1.0, then the question of it’s actual “correct” value is totally irrelevant to this topic. And it is most certainly higher than 1.0.
”Hmmm. What has the “correct equilibrium climate sensitivity” got to do with this question, Mike?”
If there is a reality, you should be able to tell me how much. If you can’t you are guessing how much. If you are guessing, you are no different to any other table pounding nincompoop and not worth listening to.
” And it is most certainly higher than 1.0.”
Most certainly eh? Yep, another nincompoop.
Only morons are certain of anything in an hypothesis in progress.
Sherwood et al. 2020 should answer your question Mike. If you have question please ask.
Excellent recent references that you provide, bdgwx. Thank you.
“Their uncertainty is at least +/- 0.5C, about the same accuracy as land-based thermometers.”
Source, please?
And in any case, have you yet progressed past your hysterical blindness w.r.t. more data not improving resolution?
Finally, even if there were uncorrectable, imbedded inaccuracy, it would be, by definition, the horizontal asymptote from the value known only to the Imaginary Guy In The Sky – either up or down, but not both – arrived at when the number of observations goes to infinity. So, how does that change trends?
https://argo.ucsd.edu/data/data-faq/#accurate
What your link references is the SENSOR uncertainty, not the float uncertainty.
The document that calculated the float uncertainty was removed from the internet by the manufacturer three years ago. If I can find my copy I’ll provide it to you.
The float uncertainty includes variation in fluid flow through the float – where dirt or other impediments can affect the flow by the sensor. They found that the flow through the float does not remain pristine when in actual use.
Try looking up Hadfield, 2007. I’m pretty sure ou’ll find an uncertainty ranging around 0.5C for the Argo floats.
The float uncertainty is *NOT* the sensor uncertainty!
OHC uncertainty is assessed at about ±10e21 joules for an annual mean in the ARGO era. The OHC change over the pause period is significantly higher than the error bars. [1][2].
So now that we have a pause, is it still ”piling in” ?
Yes. The climate system is still taking on heat. See Cheng et al. 2022 and Schuckmann et al. 2020. It is only the atmosphere where ΔE = 0. But that cannot go on indefinitely. Nature desires high entropy states so the atmosphere will be forced to warm to equilibriate with the rest of the climate system.
Look up inertial lag. Ever notice that even after the summer solstice it keeps getting warmer even though insolation is decreasing?
Why is it so difficult for you to understand this simple concept?
I know what inertial lag is. Not that it matters since the climate system as a whole continues to take up excess heat whether I understand the concept or not.
BTW…my post above is not meant to challenge you. I’m not your enemy here. I’m just trying to answer your question.
(bolding mine, tpg)
Your criticism is not appropriate.
CoM said: “ “There has been no global warming – none at all – for 7 years 7 months””
You said it can only be a matter of time until that changes.
That doesn’t prove CoM’s statement is incorrect. Especially since you can’t pinpoint when it will become incorrect.
Tim once again sadly reveals his reading comprehension difficulties.
Because heat has continued to accumulate in the world’s oceans, there has been no actual “pause” in overall global warming. None.
Thus the claim “There has been no global warming – none at all – for 7 years 7 months” is most definitely incorrect, because it does not consider the entire globe.
re: “you can’t pinpoint when it will become incorrect.”
Wrong again, son! It was incorrect from the very moment when it was typed, LOL.
This is just the old “the heat is hiding in the deep ocean” meme that was disproved a decade ago!
“Thus the claim “There has been no global warming – none at all – for 7 years 7 months” is most definitely incorrect, because it does not consider the entire globe.”
The same argument can be used against the average global temperature because *IT* doesn’t consider the entire globe!
You just stuck your foot in your mouth again! Do you like sucking your toes?
Tim once again reveals that he’s been totally hoodwinked by his WUWT propaganda puppet masters.
Accumulation of heat in the ocean has never been “disproved”. The graph at the beginning of this thread clearly demonstrates that this lying denier claim is ridiculously false.
Again, how do you “trap” heat in the deep ocean without it traversing the surface thus raising the surface temperature?
Stop whining and answer the question!
Stop babbling Gormanian nonsense just this once and try actually thinking for a change.
Stir cold water from the bottom up to the surface. Let that water warm in the sun for a little while. The total heat content of the water has increased but the surface temperature has actually decreased.
Even a grade school child should be able to understand something so simple. But this is apparently way over the head of WUWT cultists like Tim.
Again, what happens to backfill the water you removed from the bottom? You are only looking at part of the thermodynamics of the entire system.
Please stop being so deliberately dumb, Gormanian fool.
”Please stop being so deliberately dumb,”
I hope you are looking in the mirror when you sat that.
Stir cold water from the bottom up to the surface. Let that water warm in the sun for a little while. The total heat content of the water has increased but the surface temperature has actually decreased.
So you admit that for last 7 years heat has not accumulated in the ocean. Just circulated.
Mike, what part of “The total heat content of the water has increased” were you unable to comprehend?
Moreover, measurement data clearly demonstrates that heat most certainly has accumulated in the oceans over the past 7 years. Why do you want to deny measured data?
”Moreover, measurement data clearly demonstrates that heat most certainly has accumulated in the oceans over the past 7 years. ”
Bullshit. It tells you no such thing. All it shows is an temperature increase where it was measured. Your beloved measurements are a guess as to what’s actually happening in the oceans. One thing is for certain though, your contention that the ocean is heating during the pause – in heating – is nonsense.
Let’s use your brilliant experiment suggestion. Put a heat source over a glass of water, measure the surface temperature, measure the lower part of the water, stir it and measure it. It warms up. During the measuring, remove the heat source, the temperature of the water is still rising momentarily. Hey presto, the deep ocean is rising in temp even while the heat source has stabilized. (Hint, the ocean is much larger than a glass of water).
Cheng et al. 2022
Here’s Mike now tragically pretending that measurements of ocean temperatures at thousands of locations throughout the ocean depths all over the world are really just a “guess” of what’s happening.
How do people like Mike become so sensationally stupid and so deliberately dumb? Answer: that’s what WUWT does to people.
How can morons like mgc fail to understand how we can measure an increase in a body’s temperature well after the input has ceased?
It must be often embarrassing in your world…
Mike once again reveals his disgraceful dishonesty and his woefully intentional ignorance. He simply hides his head from the measured data which demonstrates that accumulating heat in the ocean is a scientific fact. He childishly pretends away reality.
This is what WUWT does to people. They imagine that their own ignorance and lack of understanding of how ocean heat accumulation occurs is somehow a valid excuse to pretend that ocean heat accumulation “isn’t” happening, even though it is measured fact.
Idiot. I know you would like people to take you seriously but you’re not doing to well yet are you? How can heat accumulate in the ocean while the atmosphere and surface is flat-lining? This I gotta see…..
Warm water from the western Pacific during La Niña needs a great deal of solar energy to move eastward as the current carries it toward Antarctica.
Mike, there are two separate questions here.
The first is just whether or not heat has been accumulating in the oceans. The measurement data has already been posted here, which demonstrates that yes, heat most definitely has been accumulating in the oceans.
The second question is the one you raise: how does it happen? But you first need to acknowledge the measurement data demonstrating that it is occurring before we can discuss how it happens.
What say you?
”The first is just whether or not heat has been accumulating in the oceans.”
Has been, perhaps. Is?…No.
”The second question is the one you raise: how does it happen? But you first need to acknowledge the measurement data demonstrating that it is occurring before we can discuss how it happens.”
Is occurring? Is? No, that is not possible at the moment. Therefore, your suggestion that the oceans are accumulating heat during the current pause is drivel. But before we go on, you need to man-up and admit it.
Cheng et al. 2022
Spammer.
Mike sadly continues to deny already measured fact. So tragically typical of the WUWT cult crowd.
You are still confused. There are 2 facts. 1. The measurements of the deep ocean temps (where they are being measured) are going up (more or less). 2. The deep oceans are not ”gaining heat” at the moment because the input from above has stabilized.
re: “The deep oceans are not ”gaining heat” at the moment”
Mike sadly continues to lie. The data demonstrating that he is lying has been posted here multiple times by multiple commenters.
Here is yet another reference to that data for weak minded Mikey Boy:
https://www.ncei.noaa.gov/access/global-ocean-heat-content/
Graph 3 from your link. MGC sadly continues to fail to understand what he looks at. Yet more evidence that deeper ocean measurements do not correlate with those more shallow. That the shallower the measurement the lower the warming and once we get to the surface where the ocean is heated from in the first place – zero….
Do you still believe the ocean is accumulating heat?
Thanks for that. Reinforces what I said. Keep it coming!
Mikey Mike once again sadly reveals his truly tragic stupidity.
Of course graph 3 shows that the 0-2000 m depth region has more total heat content increase than just the 0-700 m depth region. It’s three times larger! Moreover, the heat content increase of the 0-700 m region is included within the 0-2000 m region increase.
Duh !! Duh !! Duh !! Duh !! Duh !!
The 0-700 region also has more heat content increase per meter of depth. So the warming increases as one moves toward the surface, not decreases as Mike so foolishly imagines.
The plunge to the deepest depths of massively ditzy dumbness that these WUWT fools so routinely display is truly unbelievable.
And yet these utterly ignorant WUWT cultists like Mike still want to pretend that they somehow “know better” than the entire worldwide professional scientific community, while at the same time demonstrating that they can’t even read a simple graph correctly.
What a joke, Mike. Grow up already.
”The 0-700 region also has more heat content increase per meter of depth. So the warming increases as one moves toward the surface, not decreases as Mike so foolishly imagines.”
Forget about total heat content for a second. The RATE of increase between 0-700 and 0-2000 diverges after 1995. Before that the RATE was the same for both profiles. Why would that be?
Don’t whine.
Right, but incomplete. You fail to mention that every one of these monthly screeds ignores the fact that these claimed flat trends are statistically lame. Their standard errors are routinely much higher than their magnitudes, even assuming that the individual monthly values are deterministic and have no error bands.
Well said, Bob. Yeah, the error bars are too large because the timeframe is too small. This nonsense is like pretending that a few colder than usual days in early June is somehow “evidence” that summer is “over”.
And you fail to mention that the total amount of warming since the end of the Little Ice Age is probably also well within the bounds of the errors in the ‘measurements,’ which are unfit for the purpose of quantifying changes to the ‘climate.’
And MGC once again conveniently ignores that fact that any warming of the oceans is not due to CO2 in the atmosphere, but due to insolation. Infrared does not penetrate the ocean beyond a few microns and does not heat it.
Wong & Minnett 2018 is relevant here. Not that we weed the microphysics explanation to know that infrared radiation warms water below the absorption limit since it is intuitive and common knowledge. Afterall, the effect is in use by countless food service establishments to keep food warmer than it would otherwise be. If that does not convince you then I encourage you to do a controlled experiment with readily available IR lamps and a vessel of water and prove it for yourself. I guarantee you that vessel of water achieve a higher steady-state temperature with the lamps on than with them off.
re: “Infrared does not penetrate the ocean beyond a few microns and does not heat it.”
Yet another blind parroting of a well worn and ridiculously false anti-science denier meme.
Put an infrared lamp over a pot of water and watch what happens. It warms up. Its basic conservation of energy. DUH.
Just another example of laughably ludicrous scientific ignorance from the WUWT cultist crowd, who want to pretend that they “know better” than scientific professionals from all over the world.
Amazingly false. You cannot heat water from above with infrared radiation.
Water is opaque to infrared radiation. It’s penetration is microns deep and the only effect there is to slightly increase evaporation on the surface which has a net cooling effect on the body of water. The same effect sweating has.
You WUWT fools just keep insisting on demonstrating your woeful scientific ignorance, don’t you?
If water is opaque to infrared, then it is absorbing the infrared … and the water is also absorbing the infrared’s heat energy.
Now, tell us, Doonman: what happens to any substance when it absorbs heat energy?
Doonman apparently wants to pretend that when a substance absorbs heat energy, it gets cooler!
OMG LOL !!
I keep seeing this patently false claim on various contrarian blogs. Where did it come from? Where did you first see it?
Anyway, this claim is so ludicrous it would be the equivalent of going on to a astronomy blog and claiming that gravity causes masses to push away from each other.
Your own everyday experiences should be enough to definitively convince you that IR radiation warms water as opposed to cooling it. But if you’re not convinced by your everyday experiences then do a controlled experiment like what Dr. Spencer did.
https://www.drroyspencer.com/2015/06/can-infrared-radiation-warm-a-water-body-part-ii/
This ridiculously false “infrared can’t warm water” meme so tragically reveals the depths of utter stupidity that WUWT cultists are willing to go to in order to “defend” their anti-science fairy tale dreamworld of denier delusions.
Let’s go with this for a second: Let’s say that “recent” last 45 years of warming is entirely human-caused, anthropogenic. Let’s say that the surface data is correct, and MSU and RSS are low-balling it, and the Urban Heat Island is correctly accounted for, neither of which is remotely true, but let’s go with it. The grand total of the highest level observed warming is still well below model estimates, and every time we have a pause of several years or even decades, the observed trend- using the most favorable data for the warmists- keeps diverging even more from the models. Every pause proves your projections wrong, unless the plan is to delay the next glacial period by a few thousand years, in which case, who would disagree??….
This is commonly claimed but it just isn’t true. Yes, some of the models in the ensemble are hotter than observations, as others are cooler, but that is expected, given the range of inputs. As the IPCC stated, actual temperatures are expected to be more in line with the multi-model average. That has proven to be the case.
What is interesting about your chart there is that it uses observations up to 2005, then uses guesstimated ‘projections’ from 2005 to 2020. Such guesstimates have not been supported by real world observations and using actual observed temperatures would show them slipping below even the coolest of models. I call bullshit on this one – whatever the IPCC likes to state, actual temperatures are moving further and further away from the global average.
Richard, the black lines on the chart are observed temperatures. They are HadCRUT5.0, Cowtan & Way, NASA GISTEMP, NOAA GlobalTemp, BEST.
Reference: climate lab book.
The black lines are all observations. The hindcast from 2005 refers to the models, not the observations. Observations are currently well inside the model range.
Yes, this claim that
“The grand total of the highest level observed warming is still well below model estimates”
is just another one of the false and lying denier memes that WUWT has dishonestly vomited into the empty skulls of its willfully ignorant sheep-like followers.
Here are some more references to studies that look at the relationship between models and observations, that are actually published in the peer reviewed scientific literature, or published by the likes of NASA or by the National Academies of Science, not just some biased handwaving screed on a denier propaganda website like WUWT:
Evaluating the Performance of Past Climate Model Projections Geophysical Research Letters Oct 2019
https://agupubs.onlinelibrary.wiley.com/doi/full/10.1029/2019GL085378
We find that climate models published over the past five decades were skillful in predicting subsequent GMST changes, with most models examined showing warming consistent with observations, particularly when mismatches between model-projected and observationally estimated forcings were taken into account.
Study Confirms Climate Models are Getting Future Warming Projections Right
https://climate.nasa.gov/news/2943/study-confirms-climate-models-are-getting-future-warming-projections-right/
Climate Models Reliably Project Future Conditions
National Academies of Science, Engineering, and Medicine
https://www.nationalacademies.org/based-on-science/climate-models-reliably-project-future-conditions
Do you see a positive temperature anomaly in the Arctic in April 2022?
I have real trouble looking at the very end of the UAH graph (the bit that shows ~0.26C temperature rise over the last month), imagining that increase stretched out over 20 years (to match the current 0.13C/decade trend, and thinking that represents some kind of crisis.
For Australia UAH lower troposphere, analysed by the Viscount Monckton method, shows no warming for 9 years 9 months.
One wonders about the physics of alleged CO2 heating, allowing big blobs of heat to selectively warm some regions while others cool. One is not suggesting that money changes hands.
Geoff S
The stratospheric polar vortex and Antarctic jet stream are already operating in Australia.

Ireneusz,
Thank you for the pretty pictures. I do not doubt that there are influences like polar vortices and jet stream distortions that can affect weather patterns. I have more of a problem linking them to CO2.
There is also the matter of the uncertainty in those temperature measurements that you show. Starting from first principles. with a lonely thermometer in a screen somewhere in this vast land before there were many educated people, one can calculate how far apart two temperature observations need to be to be statistically different. Assuming for the moment that normal distribution type statistics apply, I calculate that prior to 2000, the uncertainty as 2 sigma is about +/- 1.4 degrees C. It is a longer, more involved story as to how that uncertainty is diminished by the wishful thinking of people who actually believe that these maps represent something useful – something that could be reproduced, to look just the same, by another team of people working blind, with the same starting data. I await such an attempt to bring sanity into the mix.
If you changed the anomaly reference period from 1981-2010 to be 1991-2020, there would be a lot more blue, but what would that mean? Geoff S
During the winter season, the stratospheric polar vortex has a huge impact on temperatures in high and mid latitudes. The temperature of the stratosphere depends only on ozone production and ionizing radiation.
Well, does the temperature in Australia count towards the UAH average?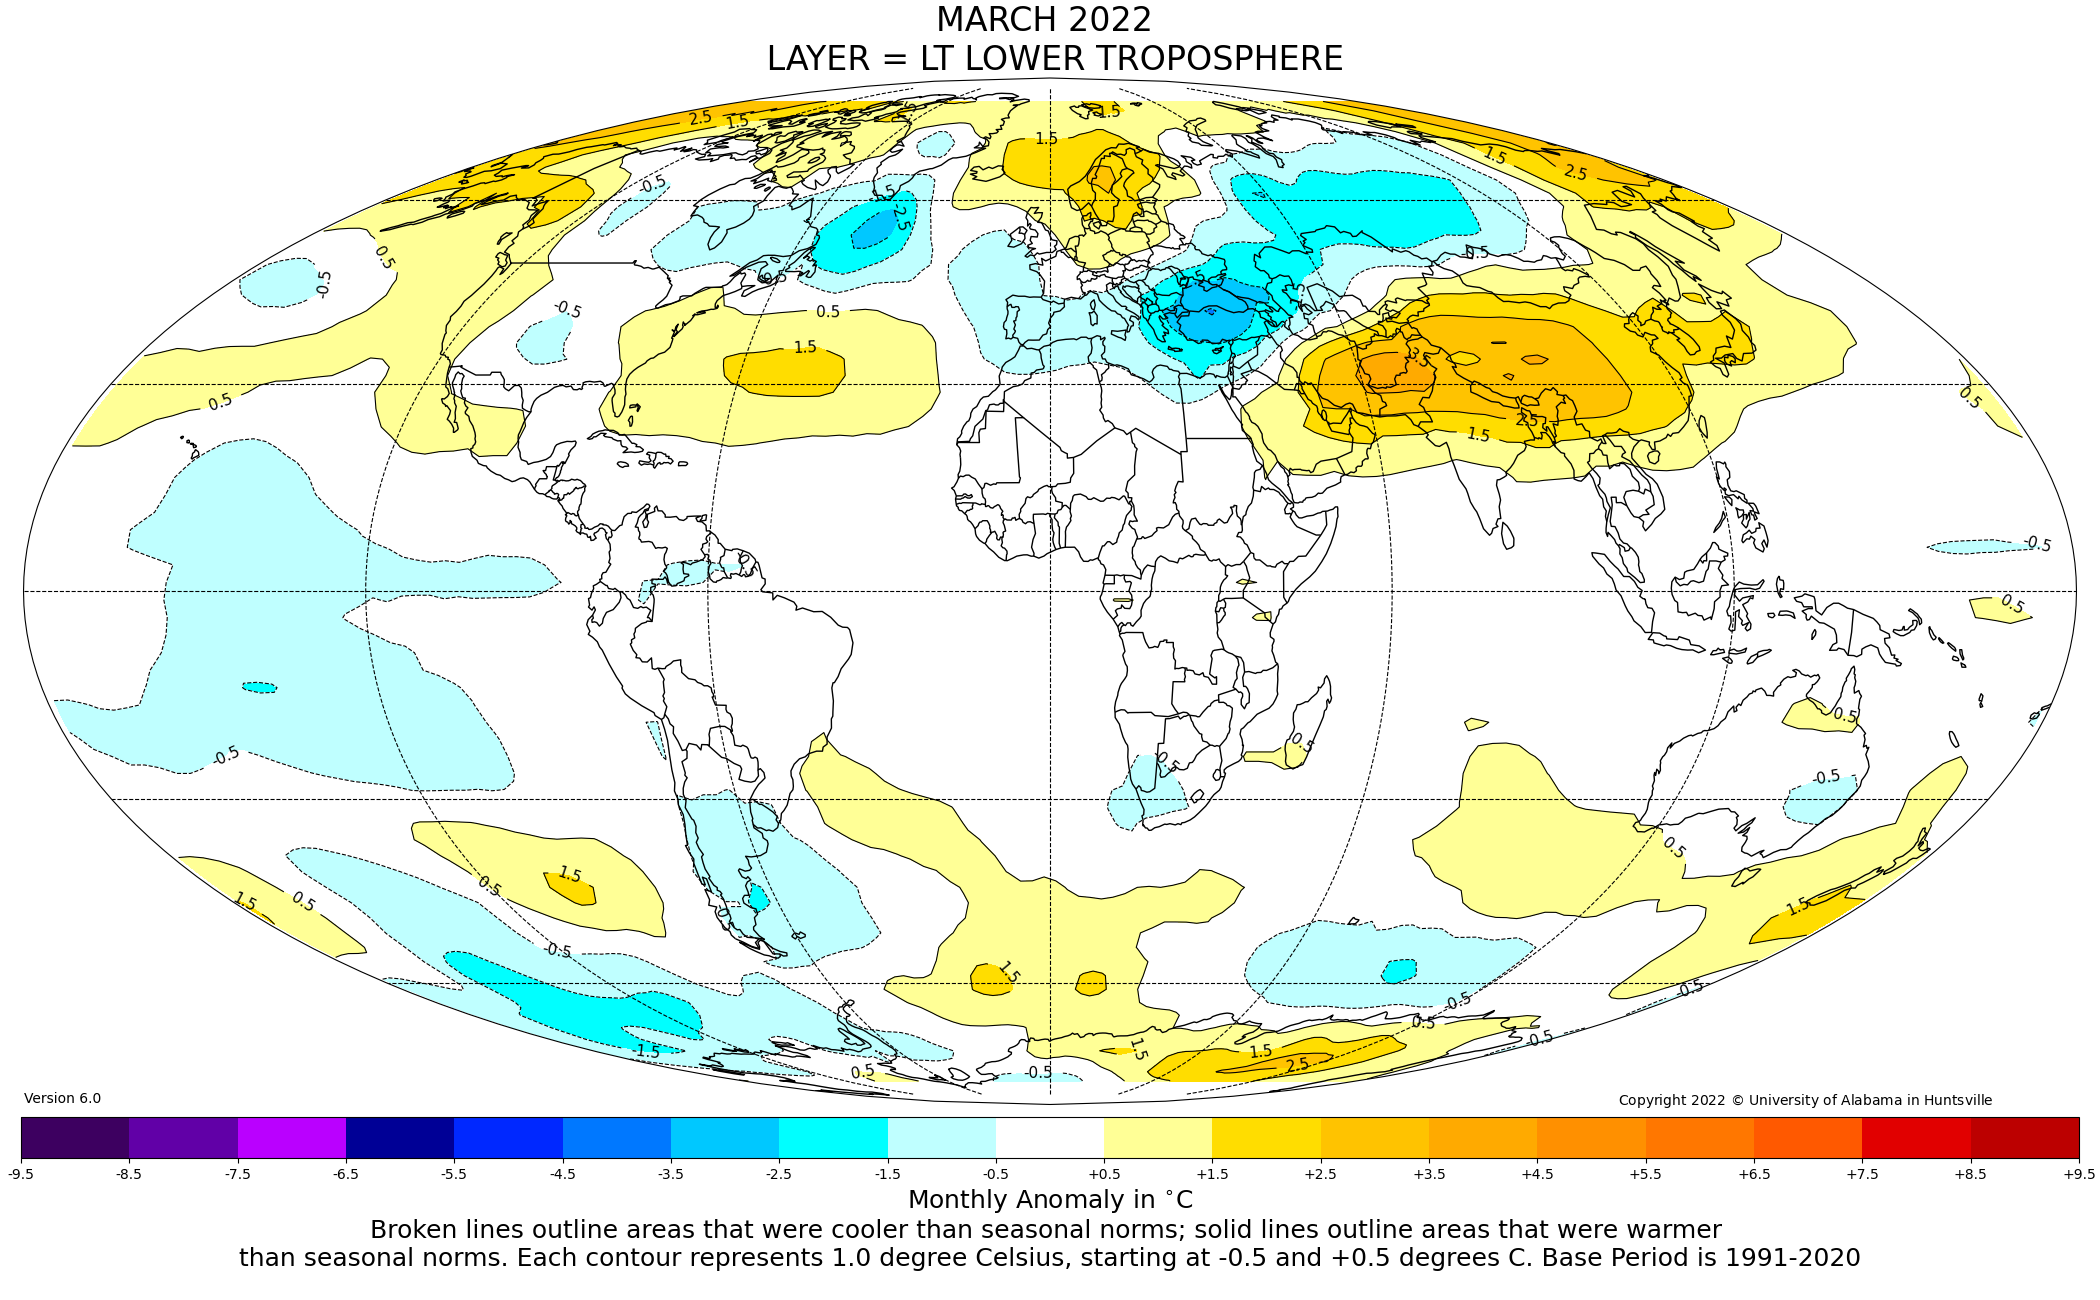
In March 2022, for example, it was 0.02.
The Outback must be having radiational cooling off the charts. Pretty interesting.
The last two years of Covid tyranny have illuminated how the climate war is not about the climate or about energy engineering, it’s all about Malthusian de-industrialisation and global depopulation, see https://metatron.substack.com/p/how-the-government-abuses-the-general?s=r.
Your periodic reminder that, contrary to Lord Monckton’s claim, the cause of modelers’ exaggerated predictions is not that “they forgot the sun is shining.”
Joe Born,
Then what is the cause of the woeful modelling exaggerated predictions? Being wrong by 100%, after spending a collective few tens of billions of dollars on modelling, is a horrible situation that should have absolutely disallowed the use of these crook results in any policy planning. Geoff S
My guess? Bad guesses (or “parameterizations,” as they’re euphemistically called).
So your interpretation is that they are wilful idiots, but not completely incompetent?
Monckton’s claims here, here, and here that predictions are exaggerated are dead wrong as I discuss here. His response to me was that emissions followed scenario A in the 1990 FAR which is also dead wrong. He goes silent after that. The fact is that IPCC FAR predictions from 30 years ago are actually pretty close and if anything may have actually underestimated the warming.
And, right on cue come the Pause Deniers. At this point, they seem to be in a phase where they can’t seem to decide whether the Pause doesn’t exist, or it does, but only because “the heat is hiding in the oceans”. Fun.
Soon, the length of the Pause may meet or even exceed the length of the Climate Liar’s noses.
I don’t think anyone has denied this pause; we’ve just questioned its relevance.
The suggestion being made by Lord M seems to be that we should attach some significance to a 91-month period that has a zero or negative trend. What he doesn’t mention is that the UAH data set currently has 431 overlapping 91-month periods, fully 114 of which, including this one, have a zero or negative trend.
Why should we believe that this current ‘pause’ will have any greater impact on the long term statistically significant warming trend in UAH than any of the 113 others did?
Indeed, the linear warming trend in UAH from Jan 1979 up to the month before this latest pause began, September 2014, was +0.11C per decade (green trendline in the chart). If you include the period of the latest pause, the full UAH trend is now +0.13C per decade (blue trendline). This period of pause is real, like all the others, but it has had the effect of increasing the overall warming rate in the UAH data set! (It’s because temperatures have generally remained at very high levels throughout this pause.)
The UAH data are free to download. Why not do that and check this for yourself?
The relevant question for which the satellite data is best suited relates to the mechanisms of change. There is little question that temperatures have changed in lower troposphere. This change is purported to be by a forcing from mid-upper troposphere imbalances. We can compare mid-troposphere to model simulations to assess the validity of this claim. Here we see there is very little predictive ability in the CMIP simulations. It calls into question the consensus claims.
If we are to be following the science, it is clear the science has departed from consensus concepts. In reality, natural tropospheric mechanisms have been disrupted by perturbation to terrestrial process. It is the surface where we should seek the ‘forcings’. Historically, vegetated systems well supplied with water brightened clouds by emitting hygroscopic bacteria for nucleation, and cooled the surface directly by latent heat flux. Land use change has disrupted these natural processes, and so climates have changed. If the intent is a return to climates of the past, the logical way is to return to landscapes of the past. However, this may be impractical. In any event, an accurate problem definition is useful when considering interventions.
The significance of the pause is *NOT* that the temperature isn’t going up, it is falsification of the belief that CO2 is the temperature control knob. CO2 over the past seven years has gone up but the temperature hasn’t. Why don’t you spend your time on figuring out why that is instead of whining about the pause not really being a pause?
We know why temperature hasn’t gone up over that period – it’s called ENSO. But when you say temperatures haven’t gone up, you mean if you ignore the fact that temperatures over that period were around 0.25°C than they had been in previous decade.
Here’s my graph showing the predictions for temperatures over the pause if CO2 had been the only factor.
”I don’t think anyone has denied this pause; ”
Yes MGC does, He is convinced the deep oceans are still warming while everything else is not. He is a magic enthusiast.
Sorry Mike, but you’ve already been shown the measurement data which demonstrates that the oceans are most certainly warming.
Anyone who pretends that the oceans are “not” still warming is just fooling themselves into believing something already shown to be false via direct measurement.
”Sorry Mike, but you’ve already been shown the measurement data which demonstrates that the oceans are most certainly warming.”
No I haven’t.
Cheng et al. 2022
Why do you keep referencing that?
Do you agree that there is a current pause or not?
If so, then there cannot be any warming of the oceans during the pause, regardless of the measurements. What is it about that don’t you understand?
I’m responding to your comment “No I haven’t.” It is a reference to measurements which show that the ocean is warming.
And I gave you a NASA link showing the SST has been cooling. And you *still* haven’t told us how the surface can be cooling while the deep ocean is warming. You’ve just thrown out some excuse about “mixing”.
You provided NASA data from 2006. That does not show “SST has been cooling” over the past 15 years, you mindless fool.
And you have provided – ABSOLUTELY NOTHING!
Are you saying that the ocean cooling has stopped? That we are not experiencing a La Nina?
Tell me again who is the fool?
MGC likes to look at graphs but does not like to use what is left of his brain to interpret it. A common problem with alarmists.
Yet another sorry spew of mindless gibberish from the WUWT cult crowd.
Tim claims “you have provided – ABSOLUTELY NOTHING”
Timmy Boy sadly continues to blatantly lie. I’ve provided a graph of the measured ocean heat content increase elsewhere in comments on this article.
But what else is new. This is what WUWT does to people. WUWT’s own incessant lying inveigles its brain washed sheeple into believing that outright lying is somehow an acceptable behavior.
The Monckton Pause is no less real than:
The overall trend of +0.13 C/decade lasting 520 starting in 1979/01.
The current 2x warming trend of +0.26 C/decade lasting 184 months starting in 2006/11.
The current peak warming trend of +0.34 C/decade lasting 135 months starting in 2011/02.
If we are to accept the 0 C/decade trend lasting 91 months then we have no choice but to accept all combinations of the trends including those I listed above.
Your handwavy whataboutism is duly noted.
If all trends are handwaving then the Monckton Pause must also be handwaving.
Nope. Nice try.
Would you mind providing an objective and repeatable test that can definitively adjudicate the “hand waving” nature of arbitrary trends and which shows that the Monckton Pause is not handwaving but the other 5e1198 of them are?
Yet another typical “Nuh Uh because I say so” from the WUWT cult crowd.
Two pauses in 14 years darn. I wanted to buy beach front property in Greenland and grow chardonnay.
Bogged down in a massacre?
Love your Climatology stuff Monky Baby, but, hey, stay out of world politics.
Idiot.
You would prefer “special military operation” then?
Moron.
CMoB,
I noticed you are still using version 4 of HadCRUT. That is the old version and is not updated anymore. The latest is version 5 and can be found here.
The “New Pause” with HadCRUT4 starts in February 2014 (and ends in December 2021).
The HadCRUT5 “Non-infilled” version, which replaces HadCRUT4, has a “New Pause” starting in March 2014 (and ends in February 2022).
Even the HadCRUT5 “Infilled / Analysis” version, which will replace the Cowtan & Way “kriged HAdCRUT4” dataset, has a “New Pause” that starts in July 2014 (and also ends in February 2022).
PS : Does anyone know why BEST still hasn’t been updated past December 2021 ?
Another good post from his Lordship. It challenges government on the credibility of climate alarmism and in particular, on the lack of serious warming. Of course, governments are deaf to this sort of stuff and cite that 197 countries signed up to the Glasgow Pact (whatever that is) after COP26.
I have my own favourite arguments, e.g. John Christy’s great graphs showing CMIP5 model projections compared with observation and the same again for CMIP6. If I need to attack the models further, there are good papers by Ross McKitrick and Pat Frank.
Politicians are not technically minded, as everyone knows, and so another approach is to point out that the IPCC is a political organisation, not a scientific one. The way it operates is well documented by the Canadian journalist, Donna Laframboise. If one looks into the history and the role of Maurice Strong, it becomes clear that the UN is using climate change as a vehicle for undermining capitalism, re-distributing wealth and gaining a greater role in global governance. The IPCC role is to collect evidence that CO2 emissions (mainly by Western, wealthy countries) has an impact on the rest. The wealth redistribution is, in fact, climate damage reparation.
The IPCC is therefore only concerned with man made CO2 and tends to ignore the fact that we have warmed up from the LIA. As far as I understand, it also chooses to ignore much of cloud effects, solar effects and the possibility of absorption band saturation. It is a powerful agency, and together with its sister agencies, the WMO and WCRP, it controls everything. (WCRP is in charge of the CMIP model program.)
This rather lengthy story has a point or perhaps a question. A great many people who present blogs on this site and do not accept the alarmist position, refer to the IPCC as a sort of definitive source of information. As I understand it, the IPCC effectively compiles a literature search which is then documented in a report. But during that process, information is selected or rejected until the resulting findings strike the right notes with the UN campaign. Nevertheless, the process covers a lot of gathered information and some of this is treated as reference material by all, including opponents who disagree with the IPCC.
Is this clumsy analysis sort of right? It could be at the heart of the problem that Chris Monckton is trying to address. How do you discredit the organisation that writes your science reference Bible?
Shrodinger’s Cat said: “I have my own favourite arguments, e.g. John Christy’s great graphs showing CMIP5 model projections compared with observation and the same again for CMIP6.”
Here is a graph of the CMIP5 prediction as compared to BEST, GISS, NOAA, HadCRUT, UAH, RSS, RATPAC, and ERA.
Make the argument as simple as possible and hope some come to their senses. Maybe in a few decades the truth will be undeniable. Let’s hope for some global cooling.
Let’s hope for some long overdue sanity.
It takes a great deal of solar energy for, during La Niña, warm water from the western Pacific to move eastward.
What confuses me is that I just did a Google search and found an older article from you that says the pause is 18 years long. So is the pause growing or SHRINKING?
Two separate pauses.
Pause is the new climate change ; )
Two pauses lasting a combined 25 years with an 11 month overlap, and during that time UAH shows temperatures have risen by 0.29°C.
Graph from:
https://skepticalscience.com/trend.php