Several subjects to be covered/touched on/updated in this important contested area flooded with Gov funded misinformation.
A – The usually reliable Dwellingup 9538 failed to record rain on 31March when radar shows ~50mm fell.
www.bom.gov.au/products/IDW60801/IDW60801.94620.shtml
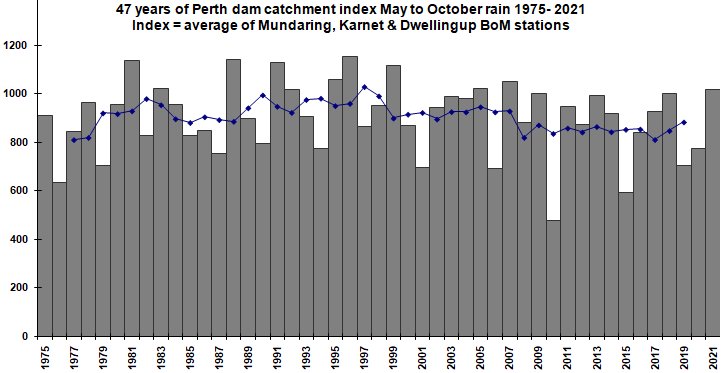
Long term readers here should know that over a decade ago I constructed my “Perth Dams Catchments May-Oct Rainfall Index” series from three stations – Mundaring Weir 9031, Karnet 9011 and Dwellingup 9538. In recent years BoM has discontinued Mundaring Weir 9031(see C below) so I have replaced that with Mundaring 9030. I have been well aware that Karnet 9111 has been getting worse and may have to look for an alternative site (see B below). My last update of my “Perth Dams Catchments May-Oct Rainfall Index” series is to year 2021 and I still have to do the work to update 2022.
2021 update 47 years Perth dams catchment May-Oct rain index 4Aug2022
www.warwickhughes.com/blog/?p=6960
Here is best link to my full 2021 chart.
www.warwickhughes.com/agri16/per-dams-catch-index2021.jpg
B – The patchy and unreliable Karnet 9111 turned in an obviously gappy & incomplete 2022 total. Seemingly accepted by BoM.
www.bom.gov.au/jsp/ncc/cdio/weatherData/av?p_nccObsCode=136&p_display_type=dailyDataFile&p_startYear=2022&p_c=-16612931&p_stn_num=9111
Why Karnet 9111 should be so unreliable I fail to understand as it is near a State run prison where there would be no shortage of labour to reliably curate rainfall gear.
I might have to include the well curated Bickley 9240 into my “Perth Dams Catchments May-Oct Rainfall Index” series to replace Karnet.
C – BoM has killed off in recent years several unreliable rain stations down the line of Perth dams – see previous blog
BoM chooses not to explain Perth dams faulty rainfall data 23Jul2018
www.warwickhughes.com/blog/?p=5871
D – All the above & below subjects mesh with my Muja blog where I expose the “barking mad” claim by ABC/BoM/ANU Academic that Muja Power Station 9738 rainfall was really as low as 124/127mm for calendar 2022.
ABC sucked in by obvious rainfall errors at Muja Power Station a BoM site 1Jan2023
www.warwickhughes.com/blog/?p=7061
E – The ever GreenLeft Our/ABC after Christmas 2021 published this arm-waving twaddle –
Why WA’s south-west is drying out at one of the worst rates in the world 28Dec21
www.abc.net.au/news/2021-12-28/why-south-west-wa-is-drying-out/100625142
And for your interest while on the subject of “arm-waving twaddle” – I see these glossed-up wild claims.
Guided by nature – Indigenous Australians use their deep spiritual connection to the land to track the seasons, but elders are warning of a “massive shift” in climate. 31Mar23
www.abc.net.au/news/2023-03-31/indigenous-australian-seasons-guided-by-nature/100919396
F – I have various blogs and www pages over more than a decade exposing the WA Gov and Water Corporation dodgy claims that rainfall decline has caused streamflow into dam catchments decline. In fact decades of neglect of scientific “control or thinning of excessive catchment bush” is the main cause of any runoff decline.
No water shortage forced seawater desal on Perth 27Feb2018
www.warwickhughes.com/blog/?p=5608
see link to – There never was a rain shortage to justify seawater desalination for Perth’s water supply 4Dec2007
www.warwickhughes.com/blog/?p=145
This post is even more relevant now, since Cyclone Ilsa, Rowley Shoals and Troughton Island along with Adele Island are not showing up on the Kimberley Obsevation pages. Also Kalumburu has gone, then last year Browse Island and Roebuck disappeared.
The Islands were a good idea of trends in sea temperature.
Bedout Island crashed during the Cyclone too when wind gusts went to 289km/hr
I had a look in CDO Tom
www.bom.gov.au/climate/data/?ref=ftr
for those rainfall stations – a mixed lot.
Rowley Shoals did not show for me as open or closed.
Troughton Island 001007 was one of the best – has recent data.
Adele Island 200735 only showed a micro amount of data ~1974.
Kalumburu 001019 was one of the best
Browse Island 200784 like Adele Island only showed a micro amount of data ~1974.
Roebuck I did not find.
Good to hear from you Tom.
Did anybody notice the huge WA Gov DPIRD rain errors 20-23rd April 2023?
See my little www page for an example
www.warwickhughes.com/agri16/WA-DPIRD-rain-errs21apr23.html
BoM seem to have fixed it now and I have not chased down any DPIRD stations to see what they show now on the days when they were showing the huge errors on the BoM pages.
Some of those Kimberley stations are now back, but in italics with and without data.
Interesting that right now a more normal type of “rain station error” is visible right now at
www.bom.gov.au/wa/flood/swan_avon.shtml
Note the Glen Eagle DPIRD station reading 26mm – radar shows that to be an error.
I have a couple of screen saves for after 9am 30 April 2023 when the page disappears.
www.warwickhughes.com/agri16/Glen-Eagle-rain-err29Apr23w.jpg
and a later screen save showing the nearby Jarrahdale DRIRD station reading 0.4mm
www.warwickhughes.com/agri16/Glen-Eagle2-rain-err29Apr23.jpg
This discovery of Canberra radar errors in measuring rainfall should be on a separate blog but for now I am starting it here.
This first text between arrowheads is from a comment of mine at JoNova.
>>>>>>>>>>>>>>>>>>>>>>>>>>>>>>>>>>>>>>>>>>
joannenova.com.au/2023/04/sunday-3/#comments
wazz
April 30, 2023 at 3:23 pm · Reply
Right now there is an interesting error showing in BoM rain radar 24hrs totals for the 128 km Canberra (Captains Flat) 24 hour Rainfalls.
www.bom.gov.au/products/IDR40D.loop.shtml
Note the eye catching arc of Red contours(+100mm rain) from between Tarago & Bungendore through Canberra, Tuggeranong, Tharwa, Michelago, Bredbo to Numeralla.
Note on the BoM rain stations map there is no support from rain gauges for that eye catching arc of Red +100m rain contours from the radar.
www.bom.gov.au/nsw/flood/southcoast.shtml
The Red +100m rain contours from the radar in the Nowra to Clyde region look in tune with rain gauges.
Note Cooma on the 128 km Canberra (Captains Flat) 24 hour Rainfalls map only has rain gauges peak readings ~under half of that indicated by the radar map.
Has anybody ever seen the radar overestimating rain by 100% like this?
I am keeping screensaves and will post more on this overnight or tomorrow.
>>>>>>>>>>>>>>>>>>>>>>>>>>>>>>>>>>>>>>>>>>>>>>
Below are links to two screen saves – the first as discussed above – www.warwickhughes.com/agri16/Canberra-comp-radar-rain-errors30Apr23.jpg
The second from the next 24hr period “24hrs to 9am 1st of May. Where the radar contouring of rainfall seems out of kilter around Kowen Forest. www.warwickhughes.com/agri16/Canberra-comp-radar-rain-errors1May23.jpg
Added 630pm 2May23 – Right now a NSW Gov rainfall station near Bega shows a 22mm for 24hrs to 9am on 2May23 reading
www.warwickhughes.com/agri16/Bega-rain-err-NSW-2May23.jpg
thats looks in error when compared to radar which shows zero rain near Bega for that 24hr period.
www.warwickhughes.com/agri16/Bega-radar-comp-rain-error2May23.jpg
For background – over years now I have been collecting screensaves of very high rainfall errors showing at the BoM pages –
www.bom.gov.au/australia/flood/index.shtml
I know most of these are culled before getting into CDO (Climate Data Online).
But logically all errors will not be obvious high extremes.
In recent months I have been finding errors in the lower rainfall ranges and some of these will find their way into CDO or State Gov data which in the case of NSW may be curated by the Manly Hydraulic Lab.