This blogpost is based on data collected via our 2022 Early Results Service for Primary schools. By uploading their KS1 and KS2 assessments, Aspire schools can access an early 2022 national analysis of their results before the end of term. There’s still time to take part – the next submission window closes on Friday 15 July!
This year saw the return of national assessments at Key Stages 1 and 2 following their postponement for two years as a result of the pandemic.
Although researchers (including ourselves) have attempted to quantify the impact of the pandemic on pupil attainment, these national datasets will provide us with the first large scale collection of data to examine changes in attainment and how the effects of COVID have impacted different groups of pupils and different areas.
Headline national Key Stage 2 results will be published tomorrow (5th July). Ahead of that, we take a look at attainment at Key Stage 1. For this cohort, the whole of Key Stage 1 was disrupted by COVID.
Data
As part of FFT’s 2022 Early Results service, we collected KS1 teacher assessments and scaled scores from over 1,100 primary schools. Of those, over half previously shared their data with us when the assessments were last carried out nationally in 2019.
For the first time this year, we’ve also been able to link results data with daily absence data collected via our Attendance Tracker system. Of the 1,100 schools that used the early results service, 780 also use Attendance Tracker.
Teacher assessments
Let’s first take a look at teacher assessments in reading, writing and maths.
We use data from the 620 schools for which we have data for both 2019 and 2022. In other words, we can see how things have changed in the same set of schools. Attainment at these schools was very close to the national average in 2019.
Pupils working at the standard of the national curriculum assessments are assessed on a three point scale (greater depth, expected standard, working towards). Pupils working below these standards are assessed using pre-key stage standards or the newly introduced engagement model if not pursuing subject-specific study. Further details can be found here.

Proportionately fewer pupils have reached the expected standard this year, particularly in writing.
The percentage achieving the expected standard or above in writing fell from 70% in 2019 to 59% in 2022. In reading, the percentage of pupils achieving this standard fell from 76% to 68% and in maths from 77% to 70%.
By converting percentile ranks to standardized scores we can calculate a rough estimate of the change in teacher assessments between 2019 and 2022. We estimate that these changes are 0.15 standard deviations (SD) in maths, 0.16SD in reading and 0.22SD in writing.
To put those figures in context, the difference in mean Key Stage 1 standardised scores between September and August born pupils tends to be just below 0.5SD in each subject.
We also note in passing that the number of pupils above Year 2 age assessed at these schools more than doubled from 70 in 2019 to 150 in 2022 even though the total number of pupils fell by 3%. Given that there were over 28,000 pupils assessed in 2022 these remain small numbers but the increase may be a result of the increased disruption the cohort had suffered.
Pupil groups
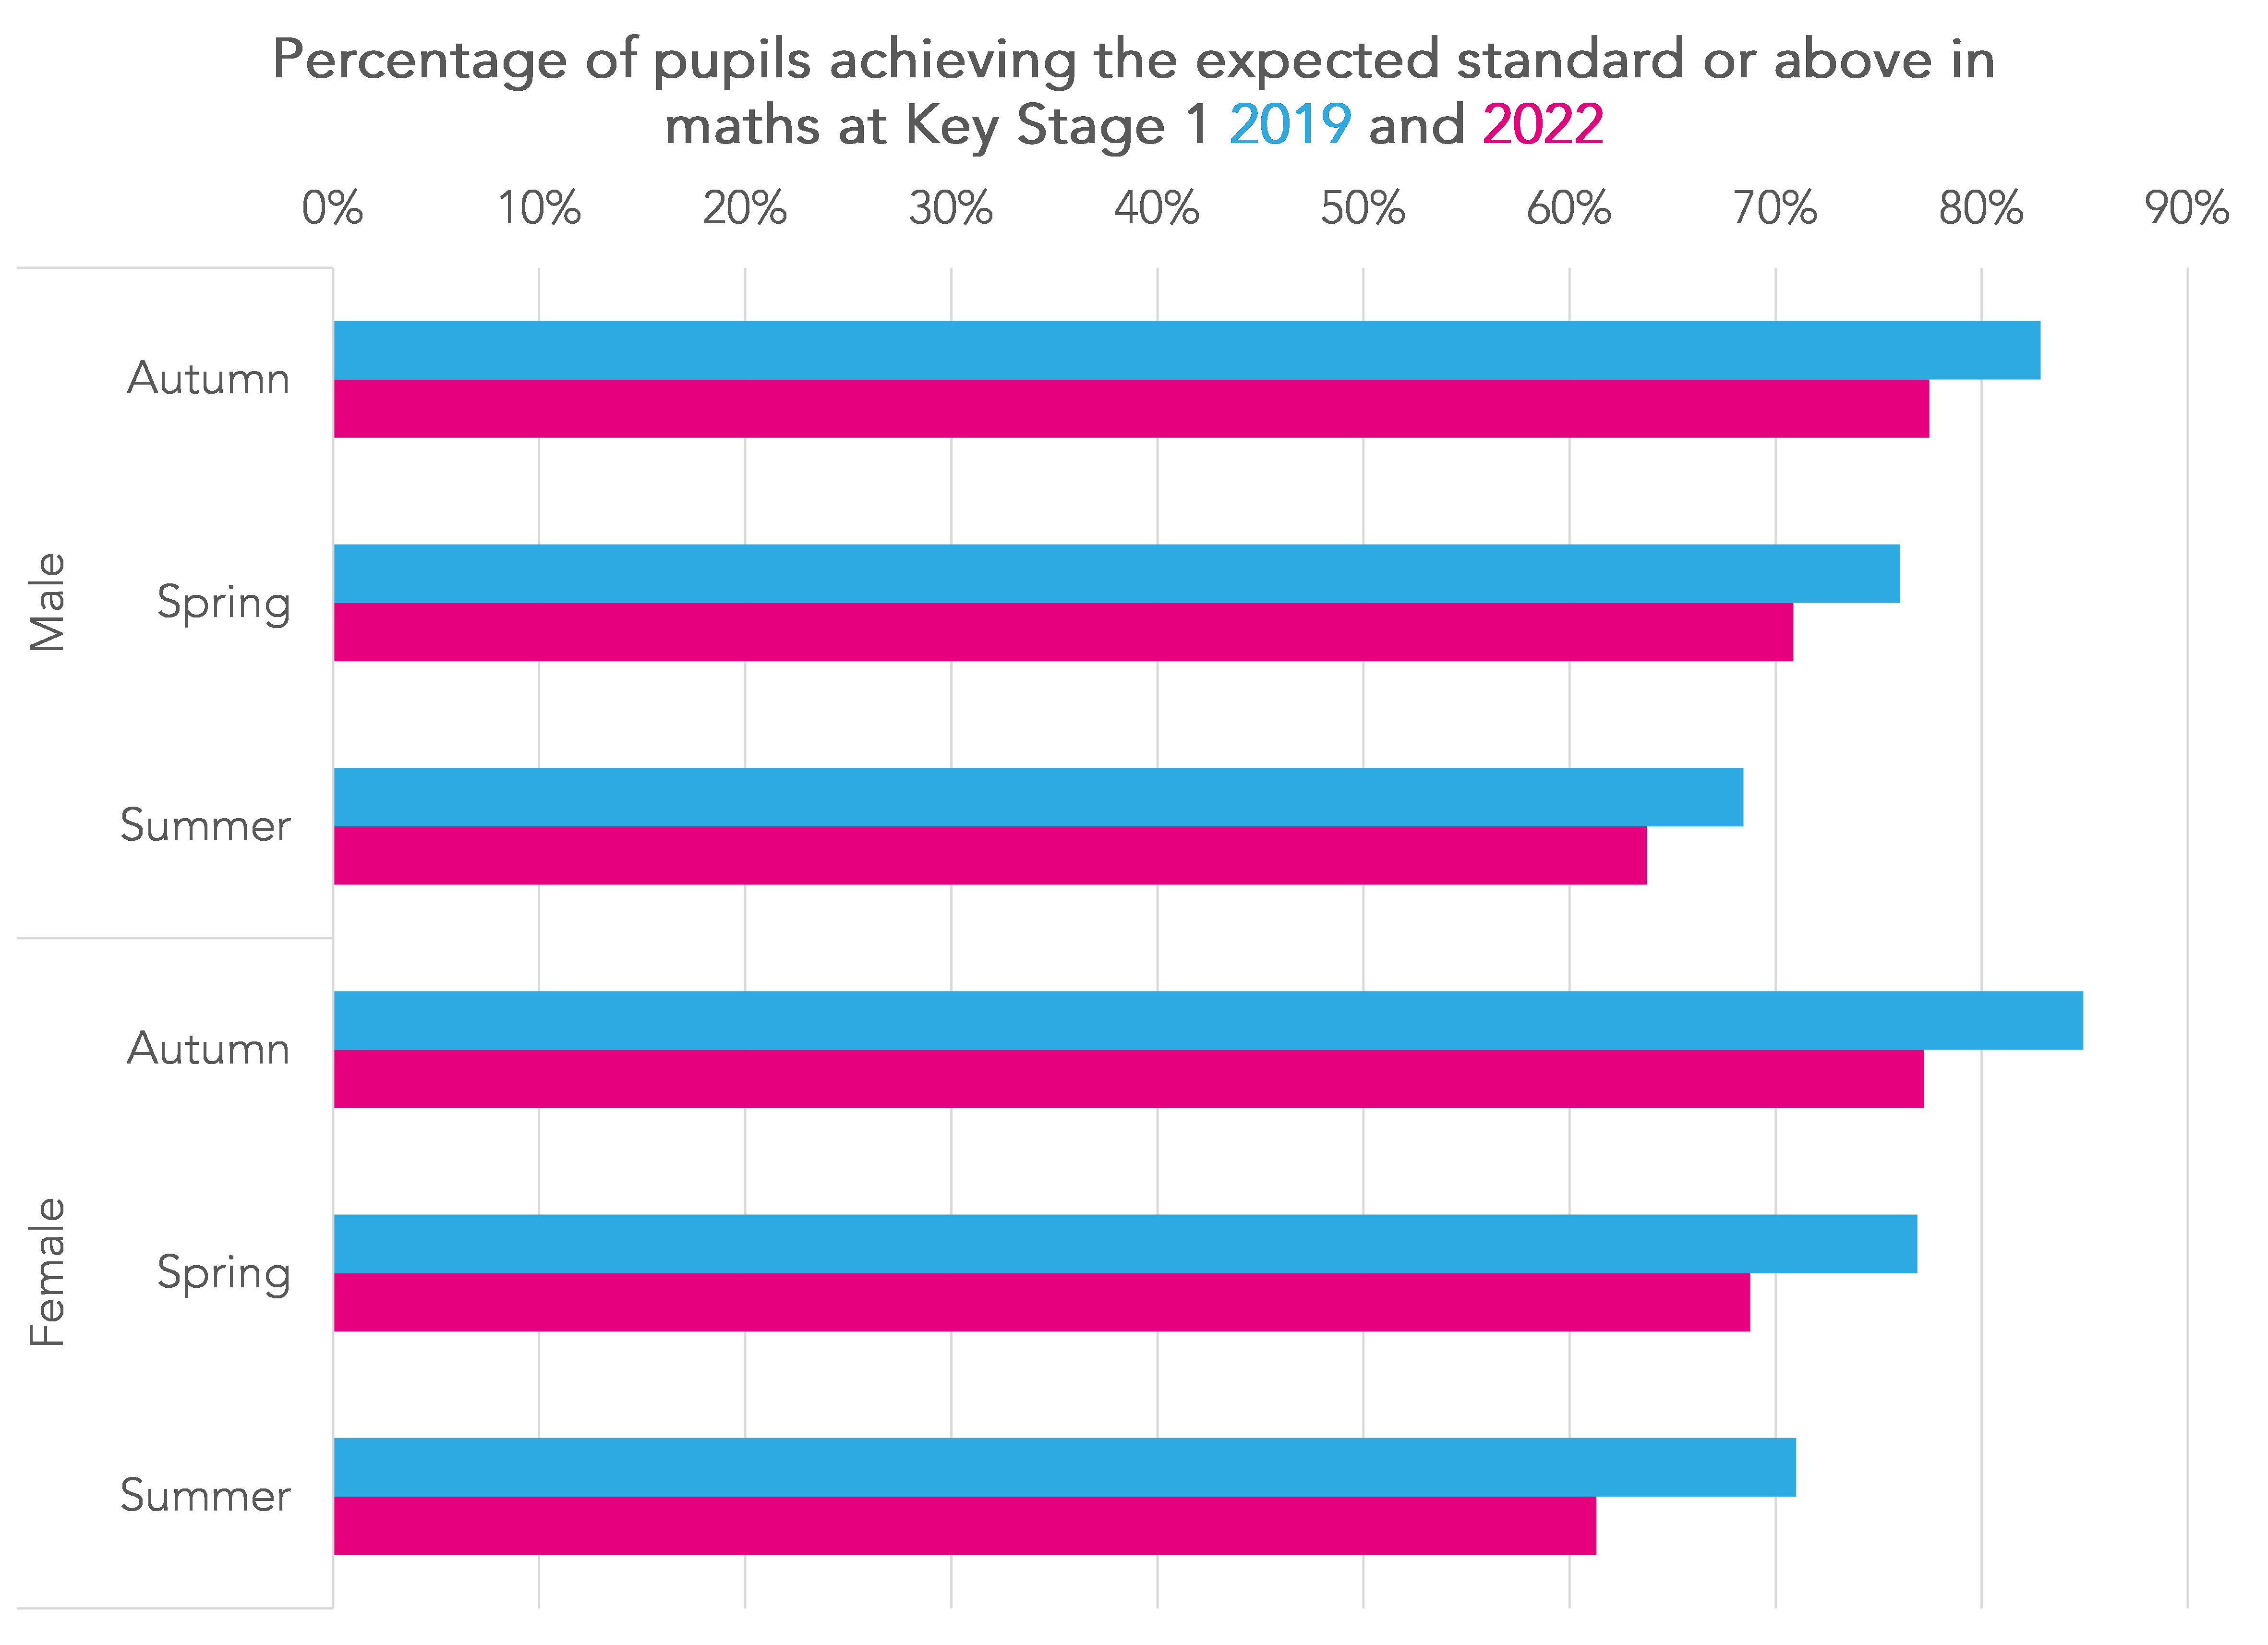
Looking at the data, it would seem that attainment has fallen among summer born girls more so than other groups. However, bear in mind we are working with a small convenience sample.
In the charts below we show the percentage of pupils who achieved the expected standard or above in each subject based on gender and term of birth. The largest percentage point fall between 2019 and 2022 in each subject was among summer born girls.


Test scores
Tests in reading and maths form part of the evidence teachers used to arrive at teacher assessments for those subjects.
Not all pupils take the tests – only those pupils working above the pre-Key Stage standards are expected to take them.
Test marks are converted into scaled scores using lookup tables produced by the Standards and Testing Agency. As not all pupils sit the tests we have given untested pupils working at the pre-Key Stage standards or working towards the expected standard a default score of 85 for the following analysis.
The charts below show the distributions of scores in both 2019 and 2022 for the matched sample.
How to interpret a box plot
The charts used here are box plots, a type of chart which most people are likely to recognise – but the details of which we may not all remember.
The line across the middle of the box is the median – the value which exactly half of results fall below, and the other half fall above. The box itself shows the range between the lower quartile – the value below which exactly a quarter of results fall – and the upper quartile – the value above which exactly a quarter of results fall. This definition means that exactly 50% of results are within the range of values covered by the box.
The difference between the lower quartile and the upper quartile is the inter-quartile range. The whiskers stretching out from the box reach to the maximum and minimum values, excluding outliers, which are shown as dots. Outliers are defined as results more than 1.5 times the inter-quartile range away from either the lower or upper quartile.
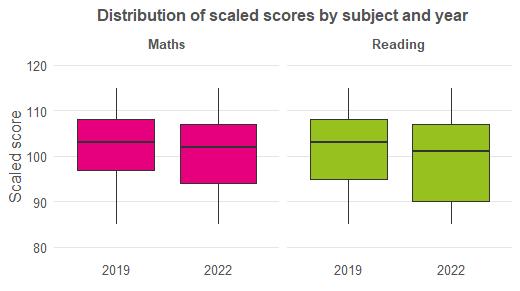
This shows that the median scaled score has fallen from 103 to 102 in maths and 103 to 101 in reading[1].
It can also be seen that the “box” (the interquartile range which covers the 50% of pupils in the middle of the distribution) has widened in reading although the position of the upper quartile has only changed slightly. In other words, there appears to be more variation in reading scaled scores this year.
The disadvantage gap
Using the full set of 1,100 schools we can look at how disadvantaged pupils (those ever classified as being eligible for free school meals since Reception) have achieved compared to other pupils.
We’ve written at length about a) the 2018 changes in free school meal eligibility which affect comparisons over time and b) the impact of universal infant free school meals on free school meal eligibility.
All of that notwithstanding, the boxplot below shows the distribution of scores in reading and maths in 2022.
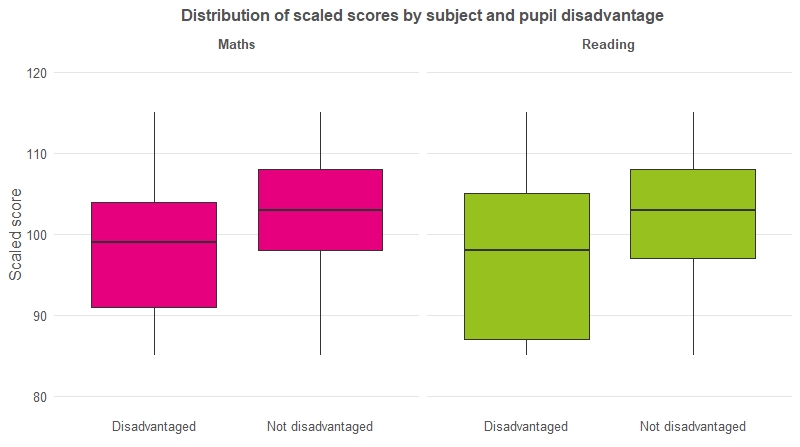
The median scores of disadvantaged pupils are lower than other pupils by 3 points in maths and 4 points in reading[2]. The upper quartiles of the distributions for disadvantaged pupils are 1 point higher than the median of other pupils in both subjects.
20% of disadvantaged pupils achieved a score of 87 or lower in reading.
The relationship between absence and attainment
Pupils at the 780 schools for which we have absence data for 2021/22 were absent for 6.9% of sessions up to the end of the Spring term. This compares a national average of 4.0% in 2018/19. 23% missed at least 10% of sessions and 5% missed at least 20% [3].
The chart below shows the smoothed relationship[4] between Year 2 absence and mean scores in reading and maths.
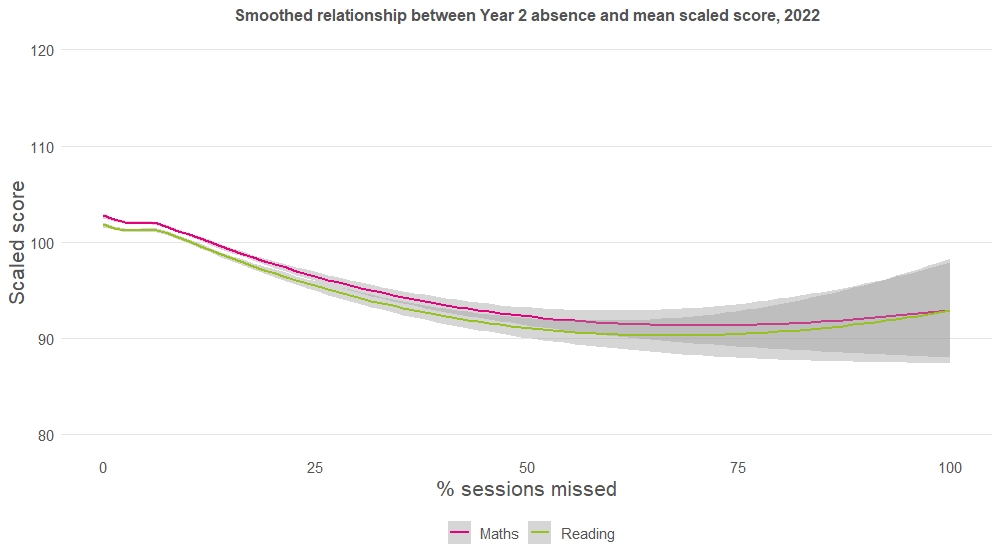
Here we are showing how the mean scores in reading and maths decline as pupil absences increase. However, all the variation around the mean is hidden and there’s a lot of this, particularly for higher levels of absence (bearing in mind that only 5% of pupils missed 20% or more of sessions).
The chart shows that absence and attainment are (weakly) correlated[5]. This isn’t necessarily causal- underlying factors may contribute to both absence and attainment.
Summing up
Pupils in Year 2 this year have had the whole of Key Stage 1 disrupted by COVID.
Given that context, it is unsurprising that their attainment was lower compared to previous cohorts, at least in the 600 schools that have shared data with us. Perhaps in retrospect the differences aren’t as large as might have been feared.
This cohort will be assessed at the end of Key Stage 2 in 2026. Assuming that the patterns in Key Stage 1 results hold in the national data when it is published, the government’s target that 90% of pupils will achieve the expected standard in reading, writing and maths by 2030 now seems even further way.
- The mean score fell by 1.3 points in both subjects, from 102.6 to 101.3 in maths and 101.8 to 100.5 in reading.
- The difference in mean scores was 4 points in both subjects (97.3 and 101.5 in reading and 98.2 and 102.3 in maths).
- The 5% are a subset of the 23%
- Using a loess function from ggplot2 package in R
- -0.18 in reading and -0.19 in maths
Want to stay up-to-date with the latest research from FFT Education Datalab? Sign up to Datalab’s mailing list to get notifications about new blogposts, or to receive the team’s half-termly newsletter.

Leave A Comment