The ratio of the annual CO2 increase divided by the annual fossil fuel emission rate increase is referred to as the “airborne fraction.” It has long been assumed the airborne fraction should increase as fossil fuel emissions increase. But the opposite has happened.
Scientists have expressed consternation that the airborne fraction of anthropogenic CO2 emissions has not been rising to any significant degree since 1850 (Knorr, 2009). The lack of an increasing trend defies modeled expectations.
“Despite the predictions of coupled climate-carbon cycle models, no trend in the airborne fraction can be found.”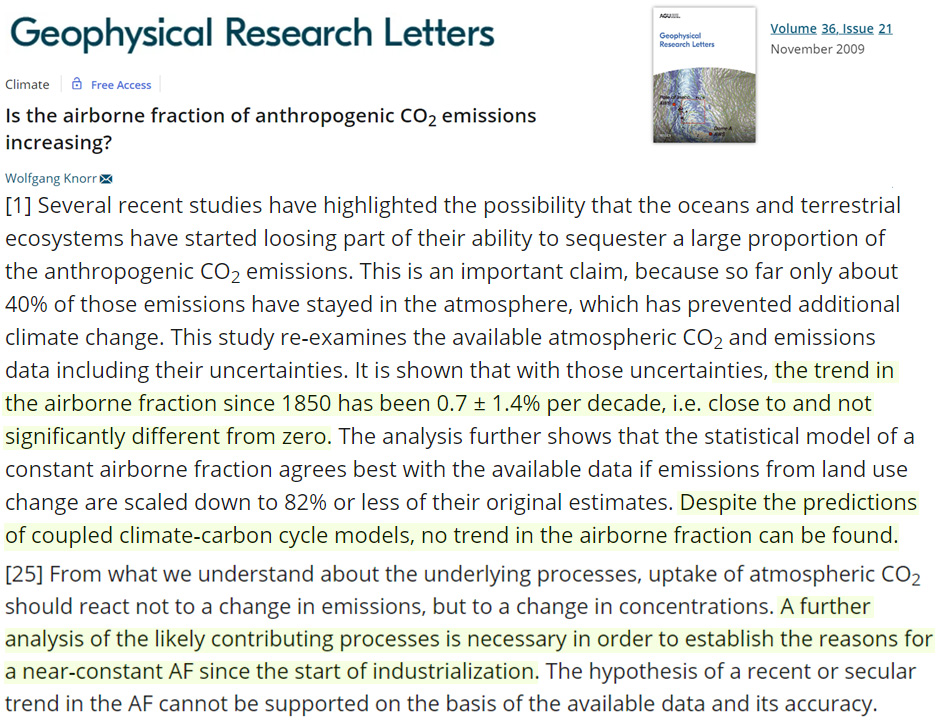
Image Source: Knorr, 2009
A new study (van Merle et al., 2022) suggests there is even more reason to assume there should be an increasing trend in the airborne fraction – especially since the late 1950s.
Not only have our fossil fuel CO2 emissions exploded from ~2.5 PgC/year to ~9.5 PgC/year in the last 60 years, but a massive increase in deforestation in tropical regions as well as a warming ocean and melting permafrost (contributing to outgassing) also suggest that natural land-ocean carbon sinks should not be expanding proportionately to emissions increases; instead, sinks should be stable to shrinking.
But this hasn’t happened.
Instead, the CO2 airborne fraction has not just been stable, it has been declining at a rate of -0.014 per decade since 1959.
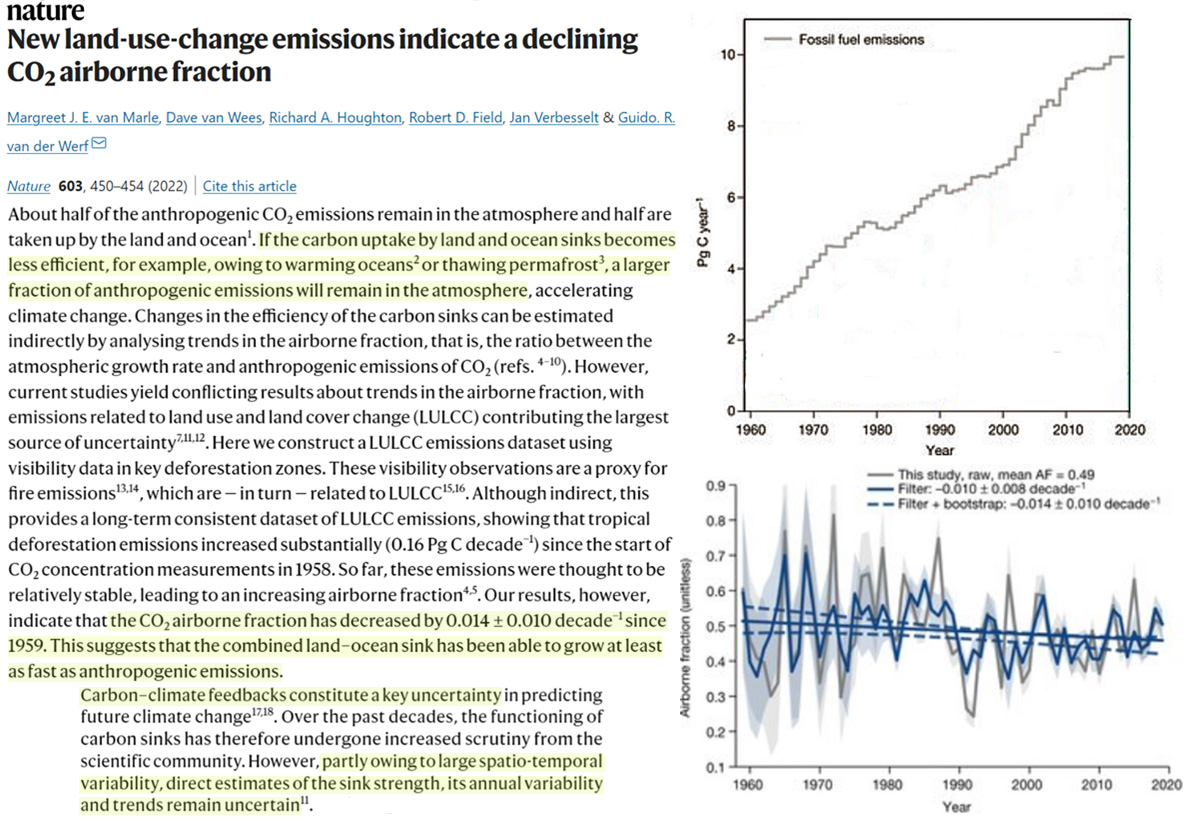
Image Source: van Merle et al., 2022
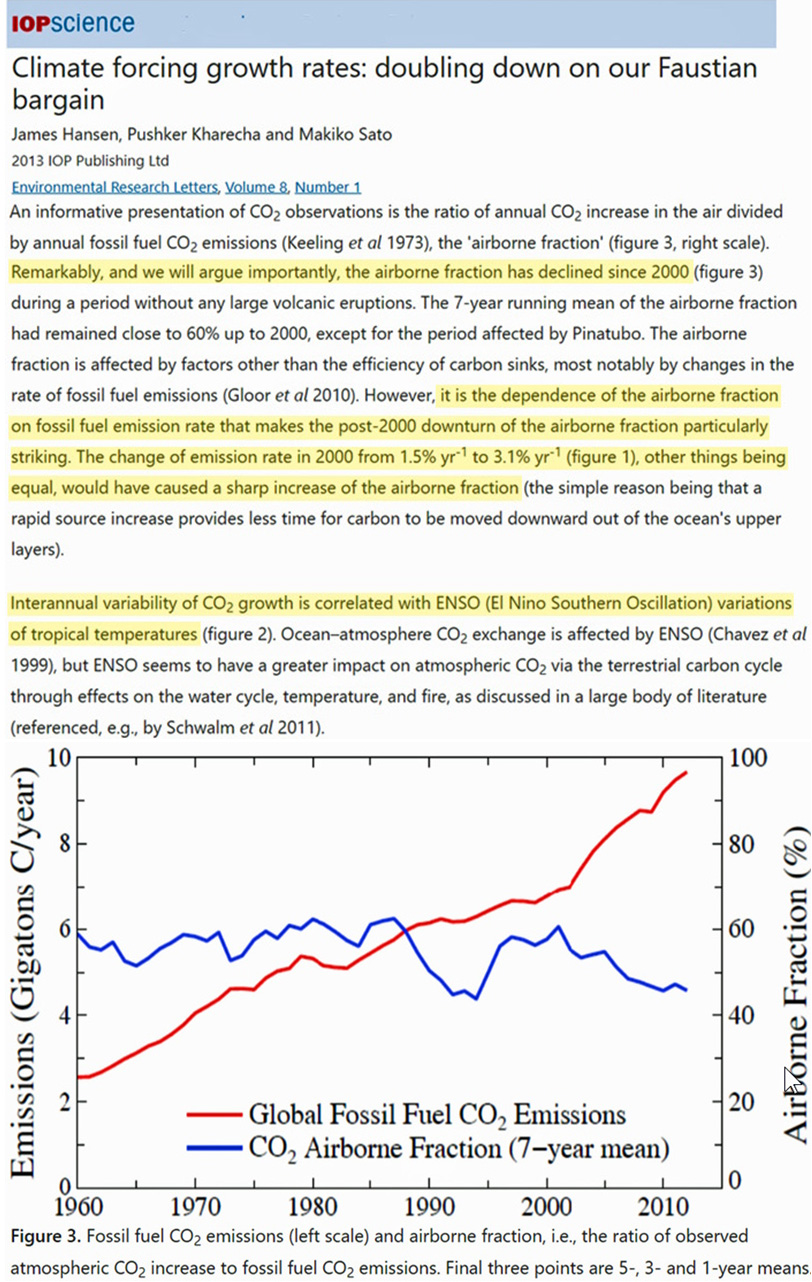
This contradiction of modeled expectations was previously (and surprisingly) highlighted by climate activist James Hansen 9 years ago (Hansen et al., 2013). He and his colleagues refer to the post-2000 decline in the airborne fraction as unexpectedly “striking” considering the massive post-2000 fossil fuel emissions rate increase.
Perhaps we know much less about the human impact on Earth’s carbon cycle processes than we think we do.


My take on the Jansen’s article :
The Pinatubo emitted so much CO2 as to induce a decrease of the AF of about 30% in 2 years.
Why ?
When we look at the CO2 concentration in the atmosphere, we see that the trend has practicaly not been modified (+ 2%) in those 2 years :
https://www.climate4you.com/images/CO2%20MaunaLoa%20MonthlySince1958.gif
This could be because of the rapid absorption of an amount of CO2 corresponding to almost all the emitted CO2 by the Pinatubo, by oceans (Henry’s law), vegetation and soils.
But in this absorbed CO2 corresponding to what the Pinatubo emitted, some was related to human emissions (thus contributing to the AF).
So the compensation mecanisms induced a significative increase of the in and out CO2 fluxes so that :
– the atmospheric CO2 concentration remained almost in equilibrium with oceans surface (Henry’s law),
– the AF decreased by some 30% during this in and out fluxes increase related to the Pinatubo eruption.
My conclusion is that if nature is able to compensate so easily a CO2 input flux so as to decrease the AF by 30% in 2 years, then … we are a ridiculously tiny player with respect to CO2 fluxes and most of all, the current increasing atmospheric CO2 concentration trend is very unlikely human induced.
This is nonsense.
The CO2 level is a measurement, since 1958.
CO2 emissions are a rough estimate, not a measurement.
The ratio depends on the accuracy of the CO2 emissions estimate.
There is no way to verify that estimate.
Therefore, the ratio accuracy is questionable.
The statement in the first comment:
“the current increasing atmospheric
CO2 concentration trend
is very unlikely human induced’
… is false, and marks the writer
as a climate science ignoramus.
Man made fossil fuel burning
CO2 emissions (ppm per year)
in the past decade are estimated
at an annual rate 5x faster
than in the 1960s.
“Man made fossil fuel burning
CO2 emissions (ppm per year)
in the past decade are estimated
at an annual rate 5x faster
than in the 1960s.”
Your own assertion makes my point even more plausible since the atmospheric CO2 concentration trend did not significantly evolve while we emitted 5x faster CO2 (and the trend doubled during the 2000’s as mentionned by J. Hansen – 2013).
How can you explain that ? Just by discarding CO2 measurements based on what ?
Calling names, denying data and observations does not add anything to the discussion apart showing you have no argument.
If you believe that the Mauna Loa CO2 measurments are questionable, you must show evidence of your claim. Same for the AF measurments.
If you believe that the Henry’s law does not exist : again, show evidences.
That’s how science go.
“climate science ignoramus” … hummm : first define what is “climate science” and what is the link between CO2 and climate. By the way I’m not even discussing this link :
– my point is not even on the causality CO2 -> climate, but on the atmospheric in and out CO2 fluxes variability as a plausible explanation of the AF decrease during the Pinatubo event and since the 2000’s.
If you have another plausible explanation of the AF blip during the Pinatubo event that contradicts or ven destroy mine, that’s fair, no problem, just make your point with data and evidences, not by calling names.
Regards.
I said CO2 levels were measurements.
I never said they were not accurate measurements.
In fact, they are accurate, since 1958.
I said CO2 emissions were estimates.
There is no way to verify if they are correct.
The ratio presented here suggests they may be incorrect.
Estimates and measurements are two different things!
You could look that up.
Henry’s law is almost irrelevant for the small increase in ocean temperatures since 1960, even if you round it up to +1 degree C. And there was also a multi-hundred year lag in temperature peaks and CO2 level peaks based on Antarctica ice core climate reconstructions.
“Calling names, denying data and observations does not add anything to the discussion apart showing you have no argument.”
— Calling names is part of a great internet tradition, that is encouraged until the word “H i t l e r” enters the argument, which results in a 10 yard penalty.
You have deliberately misinterpreted what I wrote, and asked me to prove claims I never made in my original comment. That is a red herring logical fallacy. Another great internet tradition.
Then you want me to define climate science, and the effect of CO2 in just one comment? Not easy to do … but I can do:
— Climate science is the study of the present and psst climate, based on data — from measurements and climate proxies. Climate science is NOT the always wrong, wild guess predictions of the future climate, because there are no data for the future — prediction rely only on unproven theories and speculation.
CO2 is a strong greenhouse gas for the first 100ppm, was a mild and harmless greenhouse gas from 300 to 400ppm, and will be an even milder greenhouse gas from 400ppm to 600ppm. My recommendation is a GOAL of 750ppm to 1000ppm atmospheric CO2 to optimize the growth of C3 photosynthesis plants used for food, while lowering their fresh water requirements. Any resulting global warming will be harmless, especially if following the warming pattern and timing measured by satellites since 1979.
I publish the best articles on climate science and energy I find every day on my blog, which had over 303,000 visits. This one did not qualify, as you might suspect. I don’t allow comments, so you can’t waltz over there, and post comments claiming I am a buffoon.
If I could do it over again, i would not have called you an ignoramus. That wasn’t funny. I was just trying to prepare you for the verbal backlash for when you talk climate science with leftists. If you really believe the CO2 increase in the past 120 years was not from man made CO2 emissions, your ability to refute climate alarmism will be near zero.
You can recognize the man made cause of most of that CO2 increase and ALSO observe that the warming since the 1970s has been GOOD NEWS for everyone living in higher latitudes of the Northern Hemisphere, barely affected people living in the tropics, and the CO2 increase was especially good news for plants and food production.
I tried to write my first comment in simple English, so that even a 12 year old child could understand it. Next time, please go out and find a 12 year old child to explain my comment to you. … Are we having fun yet? … PS: Due to great self-restraint, I did not call you a doofus or a dingbat in this comment.
“Man made fossil fuel burning CO2 emissions (ppm per year) in the past decade are estimated at an annual rate 5x faster than in the 1960s.”
Global Human CO2 Emissions Have Been On A Slightly Declining Trend Since 2011
The 1960s were measured at an average of about +0.5 ppm per year
2010 to 2020 at an average of about +2.5 ppm per year
+0.5 ppm per year x 5 = +2.5 ppm per year
Based on old math.
Who knows what the answer is with “new math”?
then indeed, James Hansen-
“This contradiction of modeled expectations was previously (and surprisingly) highlighted by climate activist James Hansen 9 years ago (Hansen et al., 2013). He and his colleagues refer to the post-2000 decline in the airborne fraction as unexpectedly “striking” considering the massive post-2000 fossil fuel emissions rate increase”
Hansen is the same guy who made three climate predictions in the 1980s with three assumptions.
One of the three Hansen predictions was in the ballpark, and one of the three assumptions was in the ballpark, although NOT the assumption related to the “best” prediction.
Then he claimed to be a genius of climate science.
Big deal — he got three guesses.
I predicted the future climate correctly with ONE guess in 1997:
“The climate will get warmer, unless it gets colder”
Still patiently waiting for my Nobel Prize.
Or at least a Nobel Prize Participation Trophy.
Attn Richard Greene: Maybe the CO2 emissions are rough estimates(China doesn’t help matters by its opaque data collection), but it is undisputable fact that they have drastically increased(you yourself state 5x rate increase since 1950’s). The fact that the airborne fraction has not increased, tells us that the amount of CO2 in the atmosphere is not a function of emissions, but of something else. What that else is should be definitely answered before any policy considerations of limiting emissions be undertaken. Furthermore since satellites have proved that the earth is greening during this time period, and that net warming has not increased for last 33 years according to NASA satellite data from UAH; that should be an indication that perhaps we are better off by the increase in measured CO2 by Mauna Loa.
China, being a huge CO2 emitter, also can’t be trusted for accurate data. The climate alarmists demonize CO2 and then expect honest data from nations around the world? That was my first thought.
Also how about underseas volcanoes.
Who measures those?
COI2 emissions are up
CO2 level measurements are up
There is positive correlation over the 1975 to 2020 period
But not over the 1940 to 1975 period.
Climate science is obviously not settled.
.
Greening increased.
Maybe the biosphere absorbing more CO2 than before.
Maybe the CO2 emissions estimate is wrong.
We ARE better off with rising CO2.
I support a 750 to 1000ppm CO2 level to optimize plant growth.
Just like greenhouse owners have done for many decades.
There are thousands of CO2 enrichment plant growth studies.
I have read about 200 of them in the past 25 years.
Maybe England and Michigan (where I live)
will get warmer winter nights in the future from more CO2 !
But we LOVE global warming here in Bingham Farms, Michigan !
Why does almost everyone claim that global warming is bad news — even after living with harmless warning from 1975 through 2020 — and also believe the future climate can only get worse?
UAH data show a +0.13 C. degree per decade warming trend since 1979.
The future trend is unknown. You can cherry pick start and end years
to get any trend you want. There is strong evidence that the current 30-45 year linear trends had NO correlation with the next 30-45 year linear trend.
Compare 1910 to 19840,
with 1940 to 1975 and
1975 to 2020.global average temperature – CO2 level correlation trends in just a 110 year period. How is that “settled science”?
Corrections:
Compare 1910 to 1940,
with 1940 to 1975, and
1975 to 2020.
There were three different
global average temperature – CO2 level
correlation trends in just a 110 year period.
How is that “settled science”?
We have been told the science is settled, so this must be magic or aliens, or something else. My bet is on Leprechauns.
If we can’t trust the emissions data, then the ipcc scenarios are almost useless. If we say the ratio tells us about the EFFECTIVE emissions data o what the air says they are actually doing- volume of atmosphere (constant) and increase in ppm CO2, then we have to select the emissions path that is the one ipcc scenario of value.
That leads us to discount most scenarios as the “science is settled” beyond the variable if CO2 emissions.
This seems am obvious fallout of the ratio conundrum. We could even get a fudge factor for what the world SAY they are hoing to emit to get to what they really will do …. except their promises are BS, so that won’t do.
.
An extensive post by tamponthongchai.
https://tambonthongchai.com/2019/08/27/carbonflows/
The estimates for the the natural emission of geologic carbon are massive and the isotopes are indistinguishable from the carbon burned by hydrocarbon fuels.
“We conclude from the information presented in the bibliography and the analysis above, that there are significant natural flows of carbon from geological sources such as hydrocarbon seeps, methane hydrates, submarine volcanism, and submarine mud volcanoes and that these flows make it difficult to interpret changes in atmospheric CO2 exclusively in terms of the use of fossil fuels in the industrial economy.”