Join Our Telegram channel to stay up to date on breaking news coverage
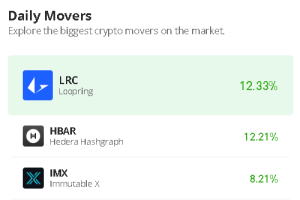
The Hedera Hashgraph price prediction shows that HBAR is moving with an uptrend, and traders could expect an early arrival of a price rally.
Hedera Hashgraph Prediction Statistics Data:
- Hedera Hashgraph price now – $0.086
- Hedera Hashgraph market cap – $2.46 billion
- Hedera Hashgraph circulating supply – 26 billion
- Hedera Hashgraph total supply – 50 billion
- Hedera Hashgraph Coinmarketcap ranking – #26
HBAR/USD Market
Key Levels:
Resistance levels: $0.110, $0.120, $0.130
Support levels: $0.055, $0.045, $0.035
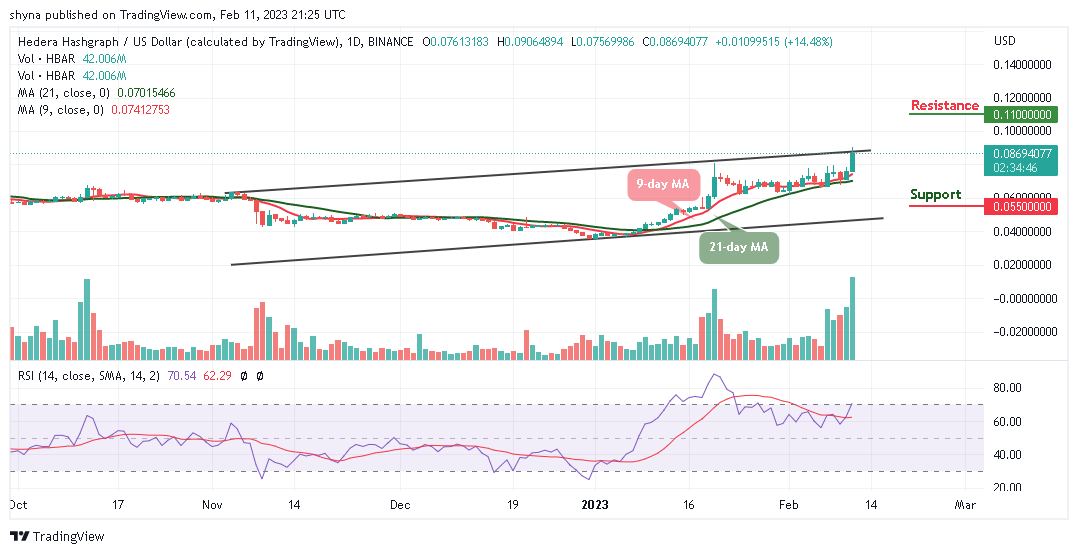
HBAR/USD is currently trading bullishly as the coin hovers above the 9-day and 21-day moving averages. The Hedera price has always sought to increase despite the pressure of the market. However, the crypto market is tremendously doing well, and the Hedera price will continue to be flourishing.
Hedera Hashgraph Price Prediction: HBAR Could Gain More Upwards
The Hedera HashGraph price continues to hold strong at $0.086, and it’s possible that if the $0.075 support is tested, it’s likely to break to the downside. Therefore, if HBAR/USD begins to abuse this level, the traders can expect the price to break beneath, and the critical support levels of $0.055, $0.045, and $0.035 may be tested.
At the moment, the Hedera Hashgraph price is hovering around $0.086 with weak bullish momentum supported by slightly positive technical levels. Therefore, any further bullish movement could hit the resistance levels at $0.110, $0.120, and $0.130 respectively. The technical indicator Relative Strength Index (14) is moving to cross above the upper boundary of the channel to increase the bullish movement.
When compares with Bitcoin, the Hedera price has been grinding higher tremendously. The market price is hovering above the 9-day and 21-day moving averages. However, the HBAR/BTC is now contained within the channel as traders wait for the bulls to hopefully push the market higher while the technical indicator Relative Strength Index (14) moves into the overbought region.
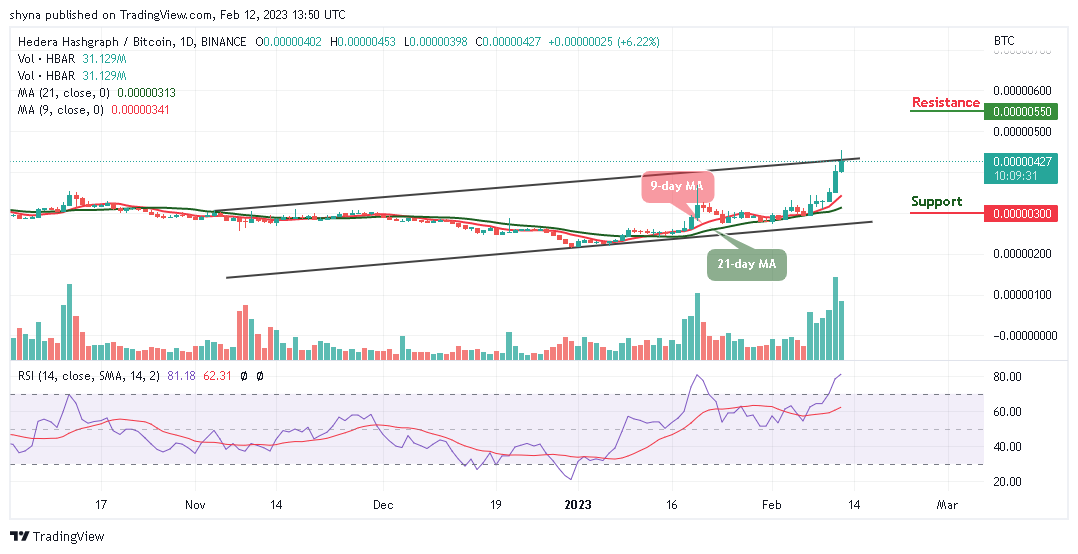
Moreover, should in case the bulls break above the upper boundary of the channel, traders can expect initial resistance at 500 SAT. Above this, higher resistance could be located at 550 SAT and above. From below, if the sellers bring the market beneath the 9-day and 21-day moving averages, traders can expect critical support at 300 SAT and below.
Hedera Hashgraph Alternatives
The Hedera Hashgraph (HBAR) is trading bullishly, therefore, if the buyers were able to push the price above the upper boundary of the channel, it could create additional gains for the coin. Meanwhile, the presale for the Meta Masters Guild token is selling fast and about $4.5 million has been raised so far. Traders are therefore encouraged to get in on the action before the tokens sell out.
Join Our Telegram channel to stay up to date on breaking news coverage