Guest Post by Willis Eschenbach
This is a follow-on from my previous post entitled Greenhouse Equilibrium. If you haven’t read it, you might want to, as it introduces many of the concepts I’ll discuss in this post.
I got to thinking about the oft-repeated claim that a doubling of CO2 increases top-of-atmosphere (TOA) radiative forcing by 3.7 watts per square meter (W/m2) … and that in turn, the additional 3.7 W/m2 of TOA forcing causes a ~3° warming of the temperature. In other words, they say that ~ 1.2 W/m2 of additional radiative forcing causes one degree of warming.
What set me to thinking was the Stefan-Boltzmann equation. It relates temperature to the amount of thermal radiation emitted. It turns out that the radiation varies as the fourth power of the temperature, T4. What this means is that the warmer an object is, the more energy needs to be added to the object to raise the object’s temperature by each additional degree.
So how much extra energy does it take to raise the temperature of the earth (which is at about 15°C) by one degree C?
Per the S-B equation, it requires an additional ~ 5.2 W/m2 to raise the temperature of the earth by one degree C. But as discussed in my previous post, only ~ 80% of the surface absorbed energy is expressed as temperature. This means that to warm the earth by 1°C requires 5.2 / .8 = 6.5 W/m2 absorbed energy at the surface per 1° warming.
Now, recall that their claim is that 1.2 W/m2 of TOA forcing causes one degree of warming … which in turn requires 6.5 W/m2 at the surface.
Presumably, their claim is that various feedbacks amplify the change in radiative forcing. But turning 1.2 W/m2 at the TOA into 6.5 W/m2 at the surface? That’s a neat trick. I’m not seeing that happening at all.
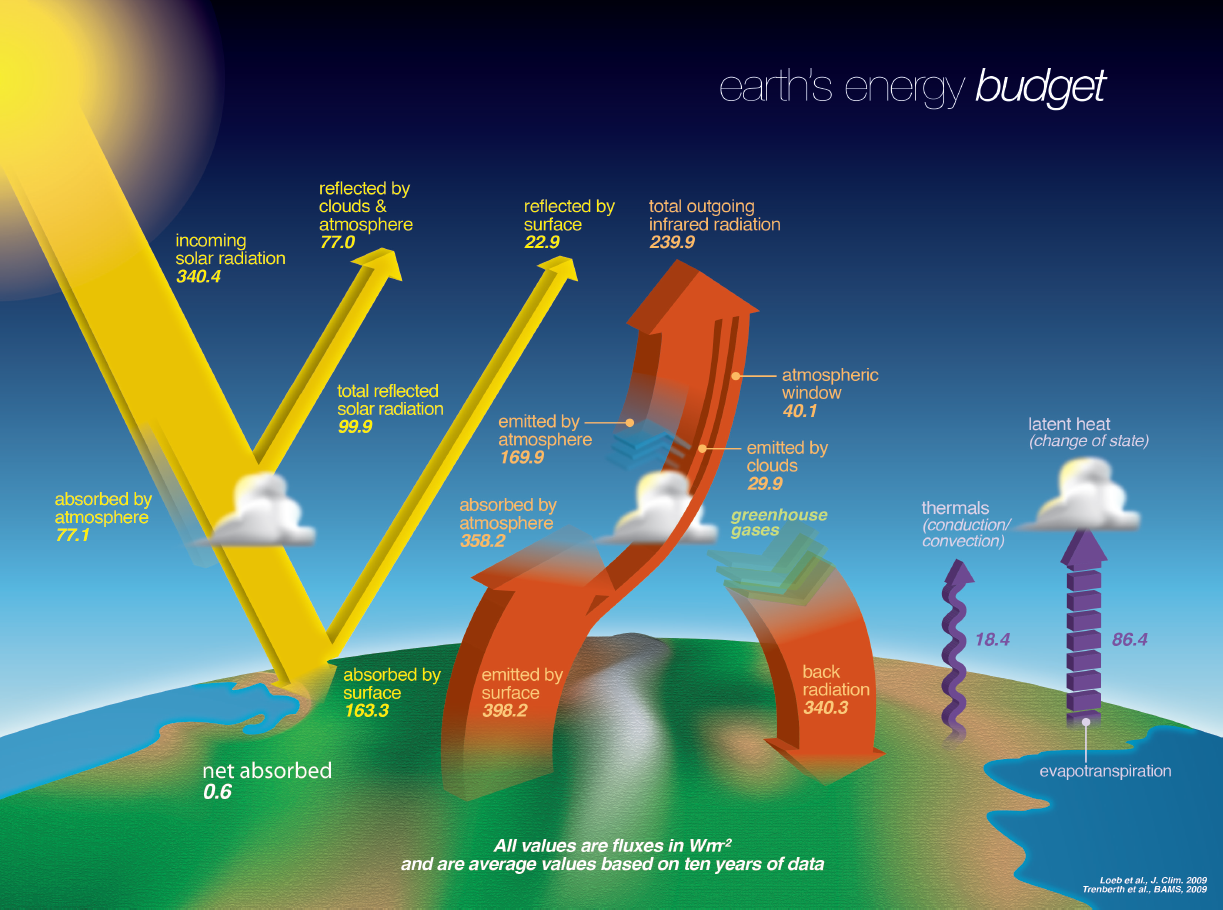
Now, let me back up to a graphic from my previous post, along with the caption.

Figure 1. Greenhouse multiplier. The multiplier is calculated as upwelling longwave surface radiation divided by incoming solar radiation (after albedo reflections). A multiplier of 2 would mean that the surface would be radiating two W/m2 of energy for each one W/m2 of solar energy actually entering the system. This shows that the greenhouse has increased the incoming solar radiation by about two-thirds, as measured at the surface.
Now, over the period of the CERES record, greenhouse gas forcing increased by about 0.7 W/m2.
Theoretically, this would be increased by feedback in the ratio 6.5/1.2 to the value at the surface. in this case, it converts the 0.7 TOA W/m2 to 3.8 W/m2 at the surface.
This allows us to see what the change in the greenhouse efficiency shown in Figure 1 should look like if the absorbed surface radiation increased by 3.8 W/m2. Figure 2 is the same as Figure 1, but including the expected change from the additional 3.8 W/m2 absorbed.

Figure 2. As in Figure 1, but including the trend in the multiplier that would be expected from the increase in TOA greenhouse gas forcing.
Hmmm … several points.
First, I simply don’t believe their numbers. Their claim is that a doubling of CO2 gives an additional 3.7 W/m2 at the TOA, and it results in 3°C of surface warming. That’s about 1.2 W/m2 per degree of warming.
But we know that it takes 6.5 W/m2 to raise the earth’s temperature by one degree …
I’m not seeing any physical processes by which the 1.2 W/m2 could somehow be increased to 6.5 W/m2.
Second, even if the warming were only 1°C per doubling of CO2, we still would be able to see it in the graphic. Figure 3 shows that result.

Figure 3. As in Figure 2, but with the CO2 forcing figured at one degree of warming per doubling of CO2, which is one degree per 3.7 W/m2.
But we don’t see that lesser trend in the multiplier either. Instead, the multiplier has a slight but not significant decrease, and it’s nothing like what we’d see if increasing GHGs actually were increasing the surface temperature.
However, at least that lesser trend is a bit believable since the increase from the TOA to the surface is from 3.7 W/m2 to 6.5 W/m2. Still a big reach, though … it would require strong positive feedback, and I haven’t seen that anywhere.
Now, the important thing to remember about this measurement of the efficiency of the system is that it is end-to-end. By that I mean we start with the energy entering the system (solar minus reflections) and we end up with surface temperature.
In between the sun and the surface, we have a range of emergent climate phenomen. Inter alia they include variable cloud shortwave and longwave radiation effects, changes in surface albedo and TOA albedo, massive variable advection of energy from the tropics to the poles, changes in aerosols, the La Nina/El Nino pump, variations in timing and strength of thunderstorms, variations in sensible/latent heat loss from the surface … and changes in greenhouse gases.
And what appears to be happening is that, as I’ve said for years, the changes in greenhouse gases are being counteracted by some combination of the other emergent climate variables included above.
What a marvelously complex world we inhabit!
w.
PS—As with the previous post, please stick to the topic. Claims that the greenhouse effect isn’t real or that downwelling radiation doesn’t exist have no place in the comments on this post, and they will be frowned upon from a great height. You are welcome to discuss those issues … just not on this particular post.
My Usual—I can defend my own words. I cannot defend your (mis)interpretation of my words. Please QUOTE THE EXACT WORDS you are discussing in your comments, so we can all understand who and what you are replying to.
If there was no moisture in the atmosphere CO2 would function as a GHG. Because there is percent concentration of moisture in the atmosphere CO2 is not a GHG. Same for CH4 and all the other “GHGs” the climate pseudo-scientists are on about.
The only reason why the fraud is still alive is too many billionaires are making money off subsidy farming.
CO2 is a greenhouse gas in competition with water vapor.
A weak greenhouse gas after 400ppm.
Weak after 200ppm (400 is generous)
Lets settle with weak because of 400 ppm
A fair argument James Hansen’s “runaway feedback” scenario is unfounded.
Runaway positive feedback is coming in the FUTURE
and always will be coming in the FUTURE.
It’s over the rainbow.
Or got lost in New Jersey,
I’m not sure which.
My first flight into Newark Airport, long before GPS, I got lost trying to get to Holmdel, NJ. Somehow wound up at some port along the harbor at 1am in the morning. It was 3am before I finally figured out, using a folding map, how to get to my hotel near Holmdel.
So you *can* get lost in NJ!
Not to mention the NJ concept of left turn lanes.
Invented in Connecticut
jug handles?
Is this the locals term?
I don’t know. That’s what they look like from inside an airplane, at least to me.
“…at 1am in the morning.”
You were lucky it wasn’t in the afternoon!
If you are in NJ you are lost
I have been lost in New Jersey several times
I used to live in New York.
Don’t get off the main highways
Obvious for a quarter Century.
But he still seems to have a few bucks to jingle in his pocket. Even The Mann still seems to be doing OK.
Always a good market for liars and charlatans.
I agree with you, Willis.
The 3.7 W/m^2 figure (still used by the IPCC) is from Myhre (1998), who estimated 3.7 ±0.4 W/m² per doubling of CO2. However, van Wijingaarden & Happer have recalculated it using an updated and expanded HITRAN database, and they found that the correct figure is only 3.0 W/m² per doubling of CO2.
https://sealevel.info/Radiative_Forcing_synopsis.html
Measurements by Feldman (2015) and by Kramer (2021) give results similar to van Wijingaarden & Happer’s figures, though with such wide error bars that they cannot rule out Myhre’s.
The question is, how much change at the surface could result from a 3.something W/m² forcing at TOA?
Positive feedbacks might increase the TOA forcing from a doubling of CO2, but not by a huge multiple. What’s more, Kramer’s results, which include effects of all but the slowest feedbacks, are still not much higher than van Wijingaarden & Happer’s calculated figure:
https://sealevel.info/Radiative_Forcing.html#kramer
Let’s do a little arithmetic.
The “average” temperature of the surface of the Earth is variously claimed to be 13.9 to 15 °C:
https://www.google.com/search?q=average+temperature+of+the+surface+of+the+earth
Add 273.15 to convert to temperature in K: 287.05 to 288.15 K.
For a temperature of 287.05K, a 3K increase would result in a ((287.05+3)/287.05)^4 – 1 = 4.24645% increase in radiative emissions at the surface.
https://www.google.com/search?q=%28%28%28287.05%2B3%29%2F287.05%29%5E4%29+-+1%3D
For a temperature of 288.15K, a 3K increase would result in a ((288.15+3)/288.15)^4 – 1 = 4.23000% increase in radiative emissions at the surface.
https://www.google.com/search?q=%28%28%28288.15%2B3%29%2F288.15%29%5E4%29+-+1%3D
If the surface emits 398.2 W/m², then a 4.24% increase would be +16.88 W/m².
That certainly does seem inconsistent with a TOA forcing of only 3.something W/m².
There’s a lot of variation in the figures for various components of Earth’s radiation budget, though you’d never guess it from the precision with which those figures are often given; e.g.:
https://science-edu.larc.nasa.gov/wp-content/uploads/sites/141/2020/07/ERB-poster-combined-update-8.2019v4.pdf
Many of the numbers in that diagram are “best guesses” and are actually quite rough. Here’s the equivalent diagram from AR4:
Note that in this diagram the surface emits only 390 W/m² (rather than 398.2), and it absorbs only 324 W/m² (rather than 340.3).
Here’s the equivalent diagram from Trenberth (2009):
Source: http://www.cgd.ucar.edu/cas/Trenberth/website-archive/trenberth.papers-moved/BAMSmarTrenberth.pdf#page=4
Note that in Trenberth’s diagram the surface emits 396 W/m², and absorbs 333 W/m².
Those large variations might be why NASA’s latest version rounds to integers:
https://science-edu.larc.nasa.gov/wp-content/uploads/sites/141/2021/08/ERB-Litho-Edits-2020.pdf
In this version, the surface emits 398 (rather than 398.2, or 396, or 390) and it absorbs 345 W/m² (rather than 340.3, or 333, or 324).
The Stefan-Boltzman relation is: E = ε σ T⁴, where:
epsilon ε is emissivity (estimates vary, perhaps (.29 * .85 land) + (.71 * .95 ocean) = about 0.92 average for the whole Earth. But some sources say as high as 0.96. It is actually a function of frequency, except for a perfect grey-body, but emissions from seawater and land are pretty grey.)
sigma σ is the Stefan-Boltzman constant = 5.670374419E−8 W/m²K⁴
temperature T is in Kelvin
E = radiative emission
Plugging in the high-end values T=288.15 and ε=0.96, we get:
E = 0.96 × 5.670374419E−8 × 288.15⁴ = only 375 W/m²
https://www.google.com/search?q=0.96+%C3%97+%285.670374419+%C3%97+10%5E%E2%88%928%29+%C3%97+%28288.15%5E4%29+%3D
To get 398.2 W/m² emission from the surface would require an impossible emissivity of 1.0186:
https://www.google.com/search?q=1.0186266+%C3%97+%285.670374419+%C3%97+10%5E%E2%88%928%29+%C3%97+%28288.15%5E4%29+%3D
Part of the problem is that “average” temperature is not the same thing as the temperature at which a body of uniform temperature would emit that much. This was discussed by ferdberple and bdgwx, here:
https://wattsupwiththat.com/2022/08/23/numbers-tricky-tricky-numbers-part-3/#comment-3584728
Hmmm… that “NASA’s latest version” ERB diagram link has gone stale. It worked about a month ago, but they’ve apparently moved their site from:
https://science-edu.larc.nasa.gov
to:
https://science.larc.nasa.gov
The ERB diagram moved to:
https://science.larc.nasa.gov/edu/wp-content/uploads/sites/141/2021/08/ERB-Litho-Edits-2020.pdf
Also, archive.org has a copy:
https://web.archive.org/web/20220716090536/https://science-edu.larc.nasa.gov/wp-content/uploads/sites/141/2021/08/ERB-Litho-Edits-2020.pdf
IIRC, Wijingaarden and Happer came up with a 2.0C rise with a doubling of CO2. HOWEVER, that was only taking radiative heat transfer into account and ignoring all the feedbacks due to phase changes in water.
I think Willis and Richard Linzden are on the right track in stating that tropical thunderstorms are a major negative feedback mechanism. One thing about the million year temperature record shows that there is a factor that limits maximum temperature. My assumption it is the saturation vapor pressure of water approximately doubling for every 10C rise in temperature. Note that the NWS reports on hurricanes assume that a SST of 26C is the minimum to sustain a hurricane.
Not right.
“Upon doubling the concentration of carbon dioxide to 800 parts per million, the radiated intensity decreases from 277 to 274 W/m2 (area below the red line). This causes an increase of the global temperature of 3*(60—16)/(394—274)F = 1.1 F = 0.6°C. The reason for this ultralow increase of temperature is the saturated nature of the absorption of carbon dioxide: when its concentration is increased, the same radiation will be absorbed in an increasingly smaller atmospheric layer. The only reason of there being any excess absorption at all, is in the non-saturated sidebands of carbon dioxide.”
SOURCE: 2021 presentation
Prof. Happer (Princeton ) explains CO2 – ingenuousness
Thank you for that link. Bookmarked separately.
The diagram you referenced is only related to surface radiation absorption. It doesn’t deal with the rate of flow of energy through the atmosphere.
If you double CO2 you now have twice as many CO2 molecules emitting energy.
At the same time the average emission-reabsorption distance (it’s upward) decreases.
The overall average of all the changes (including the wing absorption you referenced) appears to come out to zero.
No net change in the rate of energy emission to space.
Pretty cool design. Mother Nature is one smart cookie.
Is my memory faulty, but were Wijngaarden and Happer’s calculations based on clear-sky conditions?
Measuring the earth for over 2 years has never been 288K or 390w-m2. July 5th was the peak of 350.87w-m2. 1403.5w-m. Solar heating in the stratosphere makes up (105.825 w-m2 x 4) 423.3 leaving 980w-m2 (245*4). Summed excess energy was 849wm2 plus 640w-m2 going out. 209 is compression heating. 1.4*1.28*333 squared (110891) / 946.5.
So no empirical evidence, then?
Willis is diligently showing in his recent posts based on actual physical principals and measurements that the IPCC’s alarmist figures just don’t tie out. Here’s a back of the envelope calculation that pretty much shows how far they’re off:
IPCC fans throw out a lot of formulas / numbers, so it’s hard to ‘pin’ them down, i.e., check their work. But generally, they’ll agree that a doubling of CO2 by itself will increase green house forcing by 3.7 W/m^2 via the IPCC approved rule of thumb:
delta_F_2XCO2 = 5.35*ln(2).
Since this is the ‘instantaneous’ impact, they add another 3.7 W/m^2 for water vapor feedback, plus a smidge for other feedbacks, so the total equilibrium impact of CO2 doubling is about 9.8 W/m^2, which is how they get to a ‘consensus’ 3C impact for CO2 doubling via another IPCC approved rule of thumb:
delta_T = 0.31*delta_F
However, the Stephan-Boltzman equation, which is applicable to Earth’s surface (but not its atmosphere, h/t Howard Hayden) says that a 3 C increase in surface temperature will increase surface long-wave emission by about 16.5 W/m^2. This means the alarmists are ‘short’ forcing by about 6.7 W/m^2, meaning they would need either additional forcings and/or a reduction in albedo to tie out. Obviously neither of these are supportable, which is another clue why their models are running hot.
There are other things supporting your conclusion that the IPCC ‘standard rules’ do not square or tie out.
If the models were meant to reflect physical reality they would have been discarded when that tropical troposphere hotspot, that appeared on the front cover of AR3, didn’t appear in the real world.
The models are meant to reflect political reality. And they are working very well, thank you.
They are props to support pre-existing beliefs about CO2.
Science like computer games.
Big computers
Ph.D. scientists
How could they possibly be wrong?
No publicity on how wrong the predictions have been.
Except for the Russian INM model, which appears accurate, but gets no publicity for that either. Probably a lucky guess.
It would be interesting to see a plot of the implied ECS of the CMIP5 models versus the factor by which their hindcasts have overestimated temperature rise.
John Christy has supplied such plots of both hindcast and forecast, for example in his 2016 congressional testimony.
Your ECS inference, however, is not valid. To summarize my previous posts here on this topic, All climate models have to be parameterized because of computational intractability on relevant scales thanks to the CFL constraint on numerical solutions to PDEs. The parameters are ‘tuned’ (via two different methods) tobest hindcast 30 years per a written CMIP model submission requirement. So in general they don’t get the past ‘wrong’ independent of their future whatever ECS.
Perhaps I was unclear. The attached image shows CMIP6 models baselined to 1979 with projections through 2030 compared to Observations. It might be interesting to compare the implied ECS of each model to the degree which they have overestimated temperature rise to date. The question is not how they hindcast the past, but rather how they failed to project the present. Have I misinterpreted this and similar charts?
There must be a +3 degree or higher ECS to scare people.
And it must gradually increase to “worse than we thought”
That’s how climate scaremongering works.
No attempt at accurate predictions since 1988.
The scaremongering will continue because it does work.
It used to generally work. Then two things happened, which mean the whole thing is now falling apart.
We know that. But how many other people know that?
Leftists claim their models are accurate, believe it or not.
But Nut Zero fans in Europe are still blaming Putin. And the grid reliability problems are not yet at the tipping point convincing people that Nut Zero is not working. They see the high energy prices, but they don’t have the warning shot of blackouts … yet. Most people are still far from believing Nut Zero is not needed. Remember that they see Niut Zero as saving the planet — that’s their religion — which excludes engineering and science
It always makes me laugh when I read that “it’s worse than we thought!” then later [sometimes even the same article] we are told “the science is settled!”.
Don’t people recognize that these two phrases are incompatible?
Then I sigh, because it makes me sad to see the manipulation by the MSM with the tacit approval of the climate scientists. Confluence of interests indeed!
btw We are having another beautiful (if hot) summer day here in central Arizona – completely consistent with “climate change” [ie CC is not always “bad”]
But it’s my understanding that you will be getting a significant cut in water supply from the Colorado river?
And possibly electricity from the Glen Canyon Dam. Within the next year Lake Powell may drop below the level necessary to support generation. On our canyon vacation this summer we stopped to see how low the water is, and it is low. Back in the 1990’s on vacation with our then young kids, there was a rock jutting out of the water that was an easy swim from the nearby boat ramp, with all the kids taking turns jumping or diving from it. Now the water level is around 120 feet lower and the tall rock is a relatively easy walk from the extended shore line. The boat ramp is gone.
Climate Realists often say Climate Howlers claim the science of climate is settled. That overlooks all the new “it’s worse than we thought” studies, new predictions of doom, and the current attempt to define bad weather as a climate emergency.
The key to climate propaganda is to produce so many new studies predicting doom that Climate Realists can’t keep up with them. Refute one, and there are two more. Scaremongering is a steady job. “It’s worse than we thought” is a strategy for a new study to get attention in the media. They would never publish “it’s not as bad as we thought” studies !
“History doesn’t repeat itself, but it does rhyme.” – attributed to Mark Twain
Typo Willis- Phenomen
Best,
RD
P.S.
It would be great if you could give us a post where you link to all the different ways you have shown that ECS is well below 3. You’re amazing! Even more mystifying is how certain … interlocutors (not to say raving loons)…miss the significance of your contributions because they’re foaming at the mouth about “LUKEWARMISTS!!!”, back-radiation, and precious bodily fluids.
I’m more in tune with Dr. Strangelove’s fixation on the race to caverns stocked with shapely, nubile young women for the elites’ use of their precious bodily fluids.
just to say I am no one, and an old granny at that, but I love your posts ; they give me hope for the future of my grandchildren and their grandchildren.
Un Abrazo
¡Ay, mi jovencita, abrazos pa’tigo tambien! Mil gracias.
w.
The greenhouse effect is solar heated radiative active gases coupled with compression heating.
202,300 joules (1.75 × 340 x 340) / 1000. (Watt/joules)
Added together makes up the over 300 watts of downwelling infrared radiation. Gasse that make up the 1% of the atmosphere can’t have all this energy.
Let me tap the sign since Willis seems to be busy.
The post is not about arguing whether the conventional theory of greenhouse gases is right, wrong, or indifferent. This is not the place for the discussion.
The post is about suspending your disbelief, accepting the warmist premises — for the sake of argument — and showing that the numbers don’t add up to support their claims.
“Claims that the greenhouse effect isn’t real or that downwelling radiation doesn’t exist have no place in the comments on this post”. The greenhouse effect is conflicting as I have it as 100% composition 1.28kg, while Willis assumes < 5g (includes water vapor) and heated by the earth. Willis rejects anyone dismissing gases increasing in temperature when compressed by pressure and radiative active gases heated by the sun. This makes up the 314 watts of downwelling radiation.
209 watts compression heating.
105 watts solar heating.
*Sigh*
The cranks will always be with us. That should be written in scripture.
Where is the offset at sunrise?
Stephen Lindsay-Yule wrote, “The greenhouse effect is solar heated radiative active gases coupled with compression heating.“
That is incorrect, Stephen. The radiatively active gases (a/k/a “greenhouse gases”) which help warm the Earth are not “solar heated.” They are transparent to most solar radiation.
Instead, they are heated by LW IR radiation from the surface of the Earth. They prevent some of that radiation from escaping to outer space. By absorbing some of that radiation they cause it to warm the atmosphere.
You can learn about it from the first ten resources here, especially #7-10:
https://sealevel.info/learnmore.html
Sorry you are incorrect. Why at 10hpa does the temperature over Antarctic gets as high as -6C in December while in June it is -90C. Solar heating. What is absolute zero? answer -273°.How long does it take for molecules velocity at 800,000km/hour slow to 0km/hour. Current earth rotation barely slows at all. Have you heard of the atmospheric window. This is infrared radiation that is transparent to space. Infrared radiations are in wavelengths. The transparent window is 8 micrometers to 14 micrometers. This all of earth. Else earth would heat up pretty quickly if heat was blocked. None of the greenhouse gases absorb between 8 micrometers and 14 micrometers. They absorb below 8 micrometers. This is solar heating. As the highest 5cm dry hot land emitted radiation wavelength is 8.52 micrometers. So not earth.
Greenhouse gases are solar heated and non-water vapor greenhouse gases heat to -40C and near the tropics water vapor cools to -65C. I have 2 years of observing 250hpa, 70hpa and 10hpa.
Correction. Greenhouse gases are solar heated and non-water vapor greenhouse gases heat to -40C and near the tropics water droplets in clouds causes cooling the air to -75C. I have 2 years of observing 250hpa, 70hpa and 10hpa.
The greenhouse gases absorb around 14 microns near the peak of the surface IR emission, 8 microns is way beyond the tail of the solar spectrum.

solar radiance-07.svg
IR emissions is around 105 watts solar heating and a separate mechanism compression heating that makes up the peak surface temperature curve.
After 50 years of weather watching here in England am convinced that the cause of the warming during the Spring and Summer here in England, has little to do with CO2 and all to do with shifts in the weather patterning.
Because a percentage change in the cause of fine weather been the Azores high rather then a North Atlantic high during these seasons then that would account for the warming we have seen over the last 50 years. With more air coming up from the Mid Atlantic rather then the northern Atlantic.
Denying the fact that when a gas is compressed it heats up (increases in temperature) and this process happens in our atmosphere is unscientific. Carbon dioxide velocity is 400,000 metres per hour slower than air molecules at 1 bar pressure. It is a cold gas not a hot gas the media portray it as.
Stop embarrassing yourself.
To the extent that any parcel of air is compressing and heating, another parcel of air must be decompressing and cooling.
Do you imagine that the average atmospheric pressure is rising over time?
The average atmospheric pressure must be increasing over time. As we exchange an oxygen molecule for a CO2 molecule the mass of the atmosphere increases.
It may not be a lot but is going up.
Many things are true but not significant.
In order to warm the atmosphere as a whole in a significant way comparable to the warming attributed to the greenhouse effect, there would need to be a sustained, steady increase in pressure.
Damn plants keep stealing that carbon though. A little extra pressure probably helps them out.
Compressive heating appears to be real. This is why a key term in the lapse rates is gravitational acceleration, not radiation.
One can prove gravitational acceleration is still happening by throwing a ball in the air: this acceleration is constantly working.
Maybe we tend to mistake the reality of buoyancy within a pressurized medium for ‘it’s not happening.’
Don,
Compressive heating is of course real and is neither denied nor mistaken for something else.
In certain topologies, such as winds coming down into a valley, it can be very relevant. But any time some of the atmosphere is heating from being compressed, somewhere else it is expanding and cooling. The net effect is…zero.
You can’t look at only one side of the balance sheet. That’s like saying that somebody who made an average salary of $100k/yr over the past 20 years must have $2 million in the bank today.
Your talking about convection. What is the weight of air at 70hpa (around 110g) and and surface 1280 grams. What difference of weight does that have. Compression. You said any parcel of air compressing and heating. What is missing that the other parcel decompressing and already heated has that caused the parcel to rise. Surface heat. Both are coupled until equilibrium. I think your making a fool of yourself.
Surface heat via conduction adds more heat as the parcel before it reaches the ground is cooler than the parcel both heated via compression and conducting heat it touched rises up.
Surface heat via conduction adds more heat as the parcel before it reaches the ground is cooler than the parcel both heated via compression and conducting heat it touched rises up.
The temperature at 70hpa with 110g is -59C. During this slow compression pressure and temperature rise as weight and molecule collisions increase. At 9000 metres over middle east the temperature was -33C higher than -59C due to compression heating. The temperature did not change from sun rise to 4pm. As thermometer can’t measure infrared radiation. This shows no absorption of heat from the surface or the sun. Absorption of solar heat happens at higher altitude. Again debunks your argument.
No more wasting time on you. Your invincible ignorance is apparent.
Feeling is mutual You suffer cognitive dissonance. Because you think trace gases obsorbs most of the energy of the earth. When it is well known that to heat up a cold gas by more than100C is via high compression.
I do not think that trace gases absorb most of the energy of the earth. As with most of what you say, you have a mistaken understanding of reality that extends to what other people think.
Almost all the heat on earth (other than geothermal heat from radioactive decay) is from sunlight absorbed at the surface and to some depth into the oceans.
So-called “greenhouse gases” (GHGs) merely delay cooling of the surface that would otherwise occur more quickly if the GHGs did not interfere. The relatively hot surface cools by radiation to deep space that is almost 300 degrees C colder.
Some trace gases like carbon dioxide play a minor role but nearly all of it is caused by water vapor.
You correctly observe that when work is done on air to compress it, it warms. What you miss is that when air does work expanding into a lower pressure region, it cools. All compression in the atmosphere is offset by expansion somewhere else. Overall the average atmospheric pressure stays constant. There cannot therefore be any net increase in temperature caused by compression.
I don’t expect you will listen or understand but I write for those who have been confused by your errors.
Dismissing compression heating in our atmosphere but used in so many ways. Desiel engine, jet engine and now heat pumps. Even our heart requires pressure of 10hpa(1000 pascals) to produce a watt per heart beat.
Correction: the pressure required is 10hpa (10,000 pascal’s not 1000 pascal’s) to produce a watt.
“I simply don’t believe their numbers.”
Their numbers are phony. Physicists who have done the line by line calculations of CO2’s radiative flux show that it doesn’t have a strong enough forcing to cause the strong positive feedback’s assumed in climate models. That’s why they have never been observed in the real world.
False attribution underlies the whole house of cards.
Willis,
As expected from you, another excellent article! Thank you.
Just one comment: many readers may not appreciate the implications of your comment:
“Second, even if the warming were only 1°C per doubling of CO2, we still would be able to see it in the graphic. Figure 3 shows that result.”
This basically reflects on the fact that many physical processes reach what is called an “asymptotic limit” on cause-vs-effect. Many people just do not appreciate the presence of an asymptotic limit on the ability of CO2 to affect global temperatures.
As per the attached graph, and as well-argued by Happer and Wijngaarden (https://wattsupwiththat.com/2020/10/26/study-suggests-no-more-co2-warming/ ), we are currently at the asymptotic limit of increases in atmospheric CO2 concentration causing additional greenhouse gas warming.
This asymptotic limit at around 400 ppm is the obvious explanation for why Earth did not experience “runaway global warming” at paleoclimatology-data-based past atmospheric CO2 levels as high as 7000 ppm during the Cambian period.
Your post is correct but your graphic isn’t. It assumes a sensitivity per Lindzen and. How 2009. That paper was just wrong. They redid it in 2011. Still wrong, but not by as much. A more realistic curve would by Callendar’s from 1935.
Rud,
I do appreciate your clarification, but would that be known as a “distinction without a difference”?
In a sense, yes. Asymptotic limits.
In another sense (best info for others), no. Repeating an easily disprovable graphic can discredit our side. Nobody can discredit Callendar’s 1935 logarithmic concentration curve, which has withstood the test of time.
“What a marvelously complex world we inhabit!”
Heresy or misinformation? 😉
While the feedbacks you mentioned are real, they are NOT the reason for the result we are seeing in the CERES data. What we are seeing is primarily the result of atmospheric boundary layer feedback (BLF). That is, sub-second changes in conduction, radiation and evaporation as a result of thermal equilibrium processes in said boundary layer.
The equilibrium found between the boundary layer and surface is the result of these processes. Any change that warms/cools either side is corrected almost immediately. Otherwise, there would be no equilibrium. Hence, when we get a change in DWR from increased CO2, it is met with an equal and opposite energy transfer from the surface.
There are experiments that have been done (Seim/Olsen 2020) that also show no warming from increasing CO2 content. BLF would explain their results.
That equal and opposite energy transfer from the surface is from surface to space and prompted by the creation of kinetic energy within descending air as it is compressed during the descent.
Don’t think so.
This is really very simple when you think about it. The atmosphere and the surface are touching. They conduct energy back and forth. Lots of energy. It just doesn’t create a significant flux in either direction. However, if either side of that boundary warms or cools a little it is easily nullified by small changes in conduction.
Over oceans the low energy photons are absorbed right at the surface and will also enhance evaporation.
Over both the land and oceans you will also see small increases in surface radiation which is quickly absorbed back into the boundary layer.
Since over 99% the DWR that reaches the surface is produced in the boundary layer, the net effect of BLF is to return the energy back into the boundary layer. This nullifies any warming effect.
The same radiatively active gases are also radiating energy upward through the atmosphere. This is how the temperature of the atmosphere is maintained as well as the lapse rate.
There is no need for any compressional warming.
Convection.
All your emergent phenomena are just the visible manifestation of convective adjustments within an atmosphere.
Convection causes the surface temperature enhancement known as the greenhouse effect and adjustments in convection maintain it.
All potentially disruptive elements including from greenhouse gases are neutralised by convective adjustments.
Back in the 1990’s physicist and mathematicians were saying you can’t model the climate. It’s too complicated and chaotic. This post reinforces that conclusion.
AR3 said that explicitly. Because climate is a nonlinear dynamic system, therefore chaotic. But there is LOTS of money for those trying anyway.
You certainly can model nonlinear dynamic systems successfully, I wrote my thesis on doing so and comparing the results with experiment. Did so well before the 90s, they weren’t called ‘chaotic’ then.
Just because people think that they have some sort of influence on climate change does not mean that the natural climate change stops…floodings around the equator and droughts on the higher latitude.
It is the Gleissberg, not so?
https://breadonthewater.co.za/2019/09/22/revisiting-the-87-year-gleissberg-solar-cycle/
Willis says, “And what appears to be happening is that, as I’ve said for years, the changes in greenhouse gases are being counteracted by some combination of the other emergent climate variables included above.”
Yes, all the way to the TOA where we can “watch” from space. It all appears as a huge array of highly variable emitter/reflector elements. There is a NOAA visualization depicting the end result of what you are describing, in a band of infrared wavelengths from which a good portion of the static warming effect of CO2 arises.
This link is to an animation of the most recent 8 hours of high-resolution images from GOES EAST band 16 (the “CO2 band.”) For reference, on the brightness temperature color scale used for the visualization, the radiance at 30C (yellow) is 10 times the radiance at -90C (white.)
https://www.star.nesdis.noaa.gov/GOES/fulldisk_band.php?sat=G16&band=16&length=48&dim=1
The other bands in the visible spectrum, and the composite imaging, help show the variable reflector performance.
I just wanted to put this here for readers to quickly see the end result of the operation of the atmosphere as the compressible working fluid of its own heat engine motion, which is largely why the emergent phenomena are so powerful as a governing mechanism.
The highly self-regulating transport of mass and energy from the equator to the poles, and from the surface to high altitude, are plain to see.
Willis: “Their claim is that a doubling of CO2 gives an additional 3.7 W/m2 at the TOA, and it results in 3°C of surface warming. That’s about 1.2 W/m2 per degree of warming.”
and
“I’m not seeing any physical processes by which the 1.2 W/m2 could somehow be increased to 6.5 W/m2.”
WR: Neither do I. But I do see some obstacles for TOA LW radiation wanting to reach the surface to warm it: 60% cloud coverage and lots of absorbing CO2 and H2O molecules whose densities are firmly rising nearing the surface. And there is another problem: net LW radiative transport is upward, not downward.
Exactly. Net radiation flow is upward due to changing density. As CO2 molecules decrease the radiation from below has nowhere to go and eventually radiates to space. Going downward the CO2 density increases and quickly absorbs any photons that might warm the surface.
The crazy notion that adding more CO2 molecules proportionally at all altitudes will reduce this upward flow is nonsense. The same logic applies.
Not only true, but doubly true because of the lapse rate. As temperature declines with altitude, so does the major GHG water vapor. (Higher, colder, is dryer, as any weather ballon radiosonde proves.) So the only aggregate direction LWR can eventually go is up and out. Thank goodness.
I doubt that GHG concentration has much effect on the cooling of the troposphere from the surface.
If we look at weather balloon data as a balloon moves from relatively dry air to moist air (e.g.,through a cloud) there’s no increase of heating except perhaps a blip from the heat of condensation; then the cooling continues following the same moist lapse rate trajectory, as we see on skew-T diagrams of balloon soundings. No perturbation of heating/cooling is happening.
In the higher troposphere there’s less water vapor and the dry and moist lapse rates become parallel on skew-T diagrams. There’s no signature of radiative effects from CO2 higher in the troposphere.
There are no terms in the lapse rate equations for radiative effects. The lapse rates describe how the atmosphere cools.
The radiative sensitivity of CO2 at the top of the atmosphere is 3.7W/m^2, and close to the ground it is 6W/m^2.
The reason is that the effective temperature for radiation at the top of the atmosphere is 255K and close to the Ground is 288K.
Moritz, I don’t understand this. It sounds like you are saying that a downwelling flux of 3.7 W/m2 at the TOA is somehow transformed to 6 W/m2 at the ground … could you please detail the physics of that?
w.
The CO2 has the same temperature as the surrounding atmosphere, therefore it radiates according to that temperature.
The CO2 in the tropopause radiates a certain amount according to 255K temperature (use the plank equations here) , and a doubling of CO2 leads to a change of 3.7W/m^2.
It is appropiate to use 255K, because the tropopause is rather thick with almost constant temperature. Therefore, the mean distance of radiation lies within the tropopause for most of the absorption spectrum of CO2
The CO2 close to the ground has a temperature of 288K and radiates accordingly. Doubling the concentration leads to same proportional change in flux.
The temperature changes quickly with altitude but the mean length of the radiation path at low altitudes is quite short within the dense atmosphere for the absorption bands of CO2, so it is a reasonable approximation to use 288K.
I use the stefan bolzmann equation as an approximation and get a ratio of 1.6.
I also checked the plank equation, but only for a single wavelenghth: 15micrometer. The result is a rato of 1.56.
Therefore, the forcing on ground changes by roughly 6W/m^2 per doubling of CO2.
This is not about amplifying 3.7W/m^2, but just checking the inward flux components (not the net flux) at two locations within layered radiation insulation: once near the inner side and once near the outer side.
I read your explanation, but it wouldn’t it be simpler to say that to produce a change in temperature of 1K at 255K of a black body radiating according to S-B requires a delta emitted power of while to do the same thing at 288K requires
Thanks, Moritz. It seems you misunderstand the 3.7 W/m2 figure.
What that figure means is that if CO2 is instantaneously doubled, the amount of longwave radiation emitted to space will drop by 3.7 W/m2.
Note that this is NOT, as you say, just a change in the upper atmosphere or a change at 255K. It is the total change due to all CO2 at every elevation and at every temperature.
As a result, you can’t say that what it is at 255K and at 288 K are different. The 3.7 W/m2 is the total absorption of longwave, not the absorption at either 255K or 288K.
w.
“the warmer an object is, the more energy needs to be added to the object to raise the object’s temperature by each additional degree.”
False. The energy needed to raise the temperature by one degree is called a thermal capacity. Nothing to do with the Stefan-Boltzmann law.
Specific heat is for objects insulated from their surroundings, so they’re not losing heat.
w.
No, not so much, You should go back to engineering school. What an absurd statement….
Willis is talking about energy flux in stationary sytems. You are talking about energy in a non stationary system. Hence the confusion.
Thanks, Moritz. You are correct. I am indeed talking about energy flux at what is basically a steady-state energy flow system.
w.
Earth is not a steady-state energy flow system
Greg Bacon September 4, 2022 12:36 pm
Actually on average it is very close to being one. Otherwise the temperature would constantly be either rising or falling a significant amount.
w.
What an arrogant comment, Moon.
Just a moment of reflecting on it with an open mind and you’d be embarrassed.
420J/kg-degC is the heat capacity of steel. At a rate of 420J/hr how long will it take to raise the temperature of a 1 kg block of steel initially at 20C up to 100C if it is placed on top of a glacier in Antarctica during August with ambient air temperature of -75C?
The irony is that you probably did go the engineering school and Willis did not. Which only shows that education can improve a dullard to the point where they can repeat a pattern by rote but formal education is not necessary for a genius.
For you trolls, the answer is infinite hours. The steel will never heat to 100C. It will cool to something a bit above -75C and stay there at steady state.
The Stefan-Boltzmann law must be satisfied at all times. If the steel is able to radiate heat away to colder surroundings, then the amount of heat needed to raise a kg of steel one degree is 420 joules plus the amount of heat that will be lost to the surroundings. (Not only radiative heat loss, but also heat lost to conduction into the thin film of air at the surface, which leads to convection).
That is what Willis is talking about. While the heat capacity is relatively constant, the amount of radiative heat loss will increase in proportion to the fourth power of absolute temperature. The heat necessary to raise the temperature of a surface depends fundamentally on balancing the heat lost and then adding to that. The warmer the surface, that heat loss rises exponentially even as the heat capacity stays roughly constant.
It’s not rocket science. But those who don’t want to understand won’t.
Curious George,
Dimwits just make silly statements because they believe their fantasies.
Even the delightful Wikipedia states –
“The large calorie, food calorie, or kilogram calorie was originally defined as the amount of heat needed to raise the temperature of one kilogram of water by one degree Celsius (or one kelvin).”
No mention of changing with increasing temperature. For those who complain, there are measurements which show that in fact, that the amount of energy for a 20 C calorie is slightly less than for a 4 C calorie, so that whoever wrote the quote you refer to could not even be bothered looking up Wikipedia!
Obviously, many people prefer fantasy to fact – GHE believers, and idiots who claim that the average of weather (climate) dictates future weather outcomes!
What a pack of fools, eh?
The IPCC do not use physics to estimate climate sensitivity to CO2, they use their models.
“The mean and standard deviation of climate sensitivity estimates derived from current GCMs are larger (3.2°C ± 0.7°C) essentially because the GCMs all predict a positive cloud feedback (Figure 8.14) but strongly disagree on its magnitude.” https://archive.ipcc.ch/publications_and_data/ar4/wg1/en/ch8s8-6-2-3.html
The IPCC’s climate sensitivity is simply a model prediction.
And a thin and emaciated model at that. Kate Moss comes to mind.
It’s a whole lot uglier than Kate.
“And what appears to be happening is that, as I’ve said for years, the changes in greenhouse gases are being counteracted by some combination of the other emergent climate variables included above.”
THERE ARE too many climate change variables to know exactly what any one of them is doing. Greenhouse gases are one of many variables. There are also unknown feedbacks and unknown interactions among variables. The effect of more CO2 can be offset by other variables. Such as in the 1940 to 1075 period with global warming. And in the past seven years with a flat UAH trend.
The problem is the IPCC calls all natural causes of climate change “noise” since 1995. So all climate change becomes “manmade”. Juk science. And to make AGW scare people, the estimated effect of CO2, already high, is tripled by the imagined water vapor positive feedback, which so far appears to be small. The bottom line is there is no science to support CAGW, there never has been CAGW, but the predictions of CAGW never stop.
This article effectively points out that CO2 is one of many variables, although I don’t agree that CO2 has had no effect in the past 20 years, it certainly has greened the planet, and harmed no one. And that is no climate emergency. The world needs far fewer climate Ph.D. and far more Willie E.’s questioning the obviously wrong CAGW consensus.
Due Diligence:
I favor more CO2 in the atmosphere and love global warming.
There can’t be an accurate climate model until every variable’s effect is known. We are a long way from that knowledge:
The following variables are likely to influence Earth’s climate:
1) Earth’s orbital and
orientation variations
2) Changes in ocean circulation
Including ENSO and others
3) Solar activity and irradiance,
including clouds, volcanic and manmade aerosols, plus possible effects of cosmic rays and extraterrestrial dust
4) Greenhouse gas emissions
5) Land use changes
(cities growing, logging, crop irrigation, etc.)
6) Unknown causes of variations of a
complex, non-linear system
7) Unpredictable natural and
manmade catastrophes
8) Climate measurement errors
(unintentional or deliberate)
9) Interactions and feedbacks,
involving two or more variables.
I thought Judith Curry’s blog post on this was very good.
https://judithcurry.com/2010/12/11/co2-no-feedback-sensitivity/
Thank you for resurrecting her post on no feedback uncertainties. She had previously posted a guest contribution using SB to guesstimating about 1.1C no feedbacks. If one uses the AR4 data, one also gets 1.1. Lindzen in 2011 used 1.2. Monckton’s equation with his inputs gives 1.16. So we know the no feedbacks ECS zone pretty well.
I use 1.2, because it might be high so all else derived from it might also be ‘high’.
I have long been puzzled by these calculation because not even the stratosphere, much less the TOA, has enough molecules to be a significant energy source. So the 3 or so watts per SqM seems to come out of thin air, as it were. What am I missing?
Exactly right. It’s not the TOA where DWIR is sourced. It all comes from very near the surface. My own guess is over 99% of that energy comes from the boundary layer (lowest 1 km). I keep trying to point this out to almost no avail. Any downwelling photons from higher in the atmosphere are easily absorbed by the higher density atmosphere below it.
It is precisely this change in density as altitude increases that creates the outward flux of LWIR. It’s a cooling mechanism.
You are absolutely correct about the origin of the LWIR that arrives back at the surface. I live at 2200m above sea level. When the sun goes down, even on a day with air temperature near 90F, the place cools down dramatically and immediately. The issue is entirely about the absolute humidity of the air.
It’s just a terminology problem. “At TOA” should be translated “from above.”
I.e.,
“forcing of +x.y W/m² at TOA”
means:
“a forcing equivalent in effect to a change in average solar insolation (TSI/4) of +x.y W/m²“
(where the ” ➗ 4″ is because the surface area of a sphere is 4× the surface area of a circle of same radius)
Climatology is full terminology problems. This one isn’t as bad as many others:
● “BP” standing for “Before Present” but actually meaning “Before 1950.” That’s just stupid.
● “1.5° of warming” actually meaning 0.3°C or 0.4°C warmer than present, because they reference it to the late Little Ice Age, to make it sound less laughably insignificant. That’s just dishonest.
Terminology problems may sound trivial, but are the source of endless confusion and argument.
You are missing the wonders of climate phiisics. Climate scientists have written these new laws of phiisics and incorporated them into climate models to make predictions for political purposes. The better question you should ask is how did climate scientist hijack physics.
Climate phiisics has radiant energy bouncing around in all directions in thorough oblivion to field theory and Maxwell’s equations that define the electro-magnetic transport of energy through space and time. They misapply S-B equation in situations where there is zero radiant heat transport and come up with this utter nonsense of :back-radiation”.
I tried to ask what Willis meant by forcing at TOA, but my questions seem to go into the void of space and cannot be heard. What is being meant I suppose is that the accumulation of downward welling LWIR starting from the TOA and terminating at the surface amounts to . It can’t mean anything else.
The real shame here is that the stefan-boltzman law is being used by any number of folks inappropriately as a radiation transfer equation. Putting it to this use is only possible in very limited circumstances, and radiation through a grey atmosphere is not one of those circumstances.
For downwelling radiation, “TOA” is generally defined by the IPCC as being at the tropopause. You’re welcome.
w.
Thank you for your reply, but maybe you should have skipped the “you’re welcome.
Kevin kilty September 5, 2022 9:39 am
I was pissed off that you claimed your question “went into the void of space and cannot be heard”, with the clear implication that I was ignoring you.
So sue me.
w.
Somehow, somewhere, the solar component to Earth’s climate and modern climate change has very much lowballed the solar component and grossly exaggerated the role of GHG levels in the atmosphere. The connection to solar activity or total solar insolation at higher latitudes is clear. Looking at ice core data, to the best of our ability we can deduce that the temperature changes precede changes in CO2 (and probably everything else). We’ve seen the strong correlation between more recent temperature swings and solar activity (why was the Maunder Minimum so cold, take a guess). If the GHG feedback were even remotely strong/positive, Earth’s climate would be total chaos. Every little temperature change would cause CO2 and water vapor especially to fly off into the nether reaches, and take temperature along with it…
That is what happens where climate phiisics is involved. It is junk science.
You can believe there is such a thing as “greenhouse effect” but bringing it up in any topic related to Earth’s energy balance is a diversion.
This whole post, despite its lack of connection to observable physics makes the point that the “greenhouse effect” has done nothing over 20 years.
Any location on Earth that has cooled steadily over the past 40 years is all the proof needed to know CO2 does nothing to the energy balance. The Southern Ocean is that proof. Likewise the Nino34 region being stuck around 27C for the whole satellite era is further proof.
Orbital changes, dominated by the precession cycle, are constantly altering the solar intensity across the globe. The changes vary over months and latitude.
The changes in the Northern hemisphere mid latitudes is dominated by increasing spring solar EMR that increase summer temperature due to thermal lag while autumn solar EMR is reducing causing cooler winters.
You can get an appreciation of the monthly changes in solar intensity over the years using the IMCCE web model:
http://vo.imcce.fr/insola/earth/online/earth/online/index.php
This is the change at 40N for April from 1,000 years before J2,000 to 1,000 years after J2000. So present time close to 377.4W/m^2. Anyone living in the Northern Hemisphere should expect to observe summers getting warmer. That means higher maximum temperature. And reducing CO2 is not going to alter that because it is not going to alter Earth’s orbit.
-1.000 373.489453
-0.900 373.872773
-0.800 374.258234
-0.700 374.645437
-0.600 375.034002
-0.500 375.423566
-0.400 375.813785
-0.300 376.204330
-0.200 376.594883
-0.100 376.985132
0.000 377.374769
0.100 377.765110
0.200 378.154160
0.300 378.541432
0.400 378.926421
0.500 379.308615
0.600 379.687501
0.700 380.062572
0.800 380.433341
0.900 380.799342
1.000 381.160145
There is no GHE, you idiots.
That is akin to stating there is no GOD.
Like GOD, GHE is a belief system. Your statement is an expression of religious intolerance. If people want to believe in the GHE then they should be free to do so.
I took a similar view to you when I first saw it being taken seriously on skeptic forums. Then I realised that I should not be intolerant of religious beliefs.
I do draw the line when is see the GHE effect being connected to the energy balance on Earth.
What I like about the last two posts from WE is that he has verified what I have been stating for a few years – GHE is not altering Earth’s energy balance. In the convoluted world of climate phiisics he has arrived at what real physics already informed those who grasp the topic.
That is akin to stating there is no GOD.
Or in this case MOD.
That’s what Anthony Watts is doing to me right now because I accused Willis of being a sophist. In short I am being moderated.
griff is ok though because griff is harmless.
Obviously, the science is settled.
Nope. You are being moderated for attempted threadjacking despite polite requests to stop doing it. But sure, keep whining … it makes you look so strong.
w.
So it is Willis’ ball and I can’t play.
Boohoo.
WE, you say “But we know that it takes 6.5 W/m2 to raise the earth’s temperature by one degree …”.
Q1. From what source?
Q2. Do you mean earth surface or near-earth air temperature.
No way. A 6.5W/m2 full spectrum solar radiation is not the same as single spectrum 15um photons.
Frequency matters and in the context of re-radiation, the quantity is not additive in order to create a (im)balance.
Willis, I humbly want to ask a simple (and probably stupid) question. In your “Greenhouse Efficiency” post yesterday (9/2/22), the first graph of your CERES data show a minimum of 240-241 w/m^2 incoming and a significantly larger 397-398 w/m^2 outgoing solar radiation. I would have expected the energy balance to be approximately the same. What did I miss (or am missing)?
On my planet, the only stupid question is the one I don’t ask, ’cause then I’ll never learn.
The ~ 400 W/m2 is upwelling from the surface, not emitted to space.
w.
Dear Willis:
Taking your advice to heart, before reading further I went to your earlier post Greenhouse Equilibrium, where I immediately found this phrase: “A Prologue: The earth is much warmer than the moon, which receives the same amount of solar energy.”
That’s my first misunderstanding-or-disagreement, which I hope you will clarify.
I think both moon and earth receive the same solar energy per unit subtended area (for practical purposes, ignoring details of minor time-varying distances from the sun), but as the cross-sectional area of the moon (as seen from the sun) is much less than the earth’s, it seems to me that the moon must receive less solar energy than the earth.
I am loathe to read further in your earlier post when I have such a large disagreement-or-misunderstanding about your initial premiss. What am I missing?
I should have said “the same amount of solar energy per unit area”. I’ve fixed the head post there. Read on.
w.
Willis is misusing the Stefan-Boltzmann equation and is again confusing energy flux and energy. He writes:
“So how much extra energy does it take to raise the temperature of the earth (which is at about 15°C) by one degree C?
Per the S-B equation, it requires an additional ~ 5.2 W/m2 to raise the temperature of the earth by one degree C”
Now what is true is that if your raise the temperature of a black body from 15C to 16C then it will radiate an extra 5.2 W/m^2 — or at least that is what I am assuming that Willis meant by his statement above. But that is very different from how much energy you need to raise the temperature by one degree. Plus there is no mention of the time taken to raise the temperature — a small change in energy flow will produce a large temperature change if you wait long enough.
Furthermore due to the greenhouse effect the surface temperature of the earth can change dramatically without the amount of energy radiated by the earth changing at all. The amount of energy radiated by the earth is set by the amount received from the sun which is approximately constant while the surface temperature depends strongly on how the amount of greenhouse gases in the atmosphere.
The greenhouse effect gets saturated very quickly. Partly due direct effects and partly due to overlap with other energy absorption. After saturation is achieved no more warming occurs. The CO2 warming effect saturates well below 200 ppm. Adding more CO2 after than point likely spreads energy latitudinally better, but no additional warming.
If you believe in the GHE then you should be extremely alarmed about runaway global warming because atmospheric water is steadily increasing this century and I am informed by NASA that water vapour is the MOST POWERFUL GHG.
Charts below from this link:
https://www.researchgate.net/publication/353672425_A_Total_Precipitable_Water_Product_and_Its_Trend_Analysis_in_Recent_Years_Based_on_Passive_Microwave_Radiometers
Not sure if you missed the word “saturated” or don’t understand its use in this context.
Energy absorption by specific gases has essentially been proven by satellite measurements. That is the basic GHE. I also believe the Earth is not flat.
Once all the surface energy is absorbed at the frequencies where absorption occurs, then no more warming is possible. Doesn’t matter how much of the gas is present.
As the following graph shows, most of the relevant GHGs are already saturated.
https://qph.cf2.quoracdn.net/main-qimg-eb091259a205b597f832adfd61707ca1-pjlq
The link only demonstrates the overlap of water and CO2. The transmission through water vapour is not saturated. That depends entirely on the distribution of water through the atmosphere and it is has been found to be rising this century.
So what. It has no influence on the thermostatic processes that regulate the energy balance.
How does absorption of IR in the atmosphere alters the -1.8C that sea ice forms?
How does IR absorption alter the 30C ocean surface limit regulated by atmospheric ice formation through deep convection?
These are the processes that regulate Earth’s energy uptake and loss.
You’re now making a different claim. First you claimed there was no GHE and now you claim it has “no influence”.
You then appear to ignore the part of my link that shows 100% absorption over most of the frequency bands where water vapor absorbs surface energy.
You may have some points about the effects of water in determining the climate on Earth. Denying facts won’t help your case.
[SNIPPED: AS I SAID, please don’t try to threadjack the thread with claims that the greenhouse effect doesn’t exist.]
Why is this so hard for some folks to understand?
w.
Isaac Walton –
I have no idea how your comment, which states a fact, can generate two down votes. Every time we get involved in topics regarding EM radiation on this site there is so much confusion and occasional down right nonsense that it becomes an injury to the site’s reputation.
Because WUWT is a lukewarmist website.
You’ve been downvoted too, currently -1, but I will make that 0.
Thank you, sir. I’ll return the favor though I can only take you up from -2.
“And what appears to be happening is that, as I’ve said for years, the changes in greenhouse gases are being counteracted by some combination of the other emergent climate variables included above.”
Another brilliant contribution, Willis.
But sad that Great Scientists like Brandon, Boris, Macron, Trudeau, haven’t noticed and make sure that that the Genius Experts they choose to annoint as “The Settled Science” have a BIG blind spot, right there.
Willis…have to question with your interpretation of S-B, which you interpreted as follows…”What this means is that the warmer an object is, the more energy needs to be added to the object to raise the object’s temperature by each additional degree”.
Maybe you meant something else, and I misinterpreted your meaning.
I questioning your interpretation based on the evolution of the S-B equation by Stefan. He based his work on an experiment by Tyndall in which Tyndall heated a platinum filament wire electrically till it glowed red. Then he increased the current, which caused the wire to emit higher frequency EM as its temperature rose. Someone else interpreted the colour spectrum emitted and related the colours to the the EM frequency/wavelength that should emit those colours.
The temperature of the filament varied linearly between about 700C and 1400C and the output EM radiation remained at T^4 wrt the temperature. The constant of proportionality used is only good in that temperature range and is not an absolute constant. It’s a mistake to apply the S-B equation arbitrarily at other temperature ranges, especially terrestrial temperatures.
I don’t think it’s fair to claim the equation suggests what you claim above. Obviously, more heat has to be added to raise the temperature per degree but that is not reflected in the S-B equation. The equation simply suggests that the EM emitted varies with the heat added since temperature is a measure of heat.
Some people have tried to reverse S-B to suggest a transfer of heat from cold to hot. It’s clear from Tyndall’s experiment that is not the case. Stefan’s equation was developed from a clear case of heat transfer from a much hotter object to the cooler ambient temperature of the room. It would be ingenuous to claim that heat could be transferred from the cooler room air to the hotter filament in order to raise its temperature. Yet that is a basis of the AGW theory.
This is what climate phiisics is based on. You are challenging a deeply rooted belief system.
Possibly my saddest day in the last year was to learn of the passing of Michael Mishchenko.
https://www.giss.nasa.gov/research/news/20200727/
Mishchenko provided clarity in the field of transmission of EMR within Earth’s atmosphere. He derived exact solutions for Maxwell’s electro-magnetic field equations to the scattering of EMR due to atmospheric particles.
He provided proof that radiant energy transmission via the electro-magnetic field is mono-directional at and point in time and space. The means back-radiation is contrived nonsense.
Given more time, I expect he would have played a more dominant role in correcting all that is wrong with climate phiisics.
Gordon,
If you integrate the black body spectrum over all frequencies you find the total energy
radiated by a black body and this is the modern derivation of the Stefan-Boltzman equation
and since the black body spectrum is correct for all temperatures then so is the Stefan-Boltzman equation with the constant being a universal one. See
https://en.wikipedia.org/wiki/Stefan–Boltzmann_law#Derivation_from_Planck's_law
for example.
Izaak…the problem is, Stefan developed the T^4 relationship well before Planck created his equation. Boltzmann’s contribution was to take it into the realm of statistical theory. He tried to confirm the 2nd law using statistical analysis and failed.
I understand that Planck’s work was important but it involved generalities and probabilities. Prior to Planck, electromagnetic energy was related frequency in such a manner that as frequency increased, the EM intensity would run away to infinity. Planck created the curve to which you refer by presuming that higher frequency EM would not have as great a probability of existing as the medium and lower frequencies. His curve is actually based n probability and you can see that in the exponential expression.
I think a more important application of Planck’s theory was used by Bohr to related electrons in atoms to EM radiation. Planck’s quantum factor, ‘h’, proved a basis of quantum theory and Bohr noticed that a quantum step had to be a factor in electron transitions to produce the discrete spectral lines in hydrogen.
I prefer Stefan’s work because it is based on actual physical reality and corroborates the 2nd law. It’s interesting that S-B can be derived from Planck’s equation but Planck based his work on Boltzmann’s statistical analysis and it stands to reason he created the equation to reflect the work of Stefan, for whom Boltzmann was a student.
Furthermore, Planck’s equation applies to one temperature at a time, as I understand it. Stefan developed the basic S-B equation from real data that covered a 1000 degree C range of temperatures.
“Furthermore, Planck’s equation applies to one temperature at a time”
As I understand it both Planck and S-B require the radiating object to be in thermal equilibrium – i.e. one temperature at a time. If the object is not in thermal equilibrium then conduction/convection, even within the object itself, will cause the radiation from the body to be different.
Gordon,
why is it a problem when Stefan developed his theory? Newton developed his theory of gravity centuries before Einstein but we can still derive Newton’s theory from Einstein’s. Similarly the Stefan-Boltzman law can be derived trivially from Planck’s Blackbody spectrum just by integrating over all frequencies and solid angles. And the blackbody spectrum can be derived using Einstein’s 1917 work on stimulated and spontaneous emission.
Planck’s blackbody spectrum is also based on actual physical reality and furthermore has been shown to have a universal validity — look at the cosmic microwave background for example. The microwave background is at roughly 2K and if you integrated it over all frequencies you would find that the answer was given by the Stefan-Boltzmann equation extending its validity far beyond what they originally applied it to.
For black bodies in space. That means it is misapplied to anything on Earth’s surface.
But my infrared lamp works here on the Earth. Funny, that.
For radiative heat transport you have both: transfer of heat from hot to cold and, at the same time, transfer from cold to hot. The important thing is that the difference, the net heat transfer, of these two opposite streams is alwas positive from hot to cold.
What willis has been doing is looking at these streams separately, and not at the net stream.
When you look at the net stream you have heat transfer from the sun to the earth, and from the earth into space. This means from hot to warm to cold. Now depending on the details of the system, the “warm” temperature of earth could be anywhere between the temperature of the sun and the tempetature of space, without violationg the laws of physics.
It is therefore feasible that the changes of the properties of the atmosphere move the temperature slightly closer to the temperature of the sun.
This should not be misunderstood as the cold atmosphere warming the warmer surface of the earth. It is still the sun that is doing the warming of the surface. But the atmosphere can inhibit the cooling into space
Nope, the radiant energy transport is mono-directional. Proven by the great NASA/GISS physicist Michael Mishchenko and restated in this paper:
https://opg.optica.org/DirectPDFAccess/33B19AC8-EC5C-4DE3-BAD4A42301A02518_205485/oe-18-19-19770.pdf?da=1&id=205485&seq=0&mobile=no
Mishchenko is no longer with us but he has made significant contributions to measuring EMR energy transport in Earth’s atmosphere.
He cringed at Trenbarths/IPCC energy diagram showing back-radiation.
You are still confusing net heat transport, and radiation components.
Net heat transport is always monodirectional, the detailed components can have multiple directions.
I am going to try to explain this to you, as you are embarrassing yourself. Heat flows from warm things to cooler things. Yes the atmosphere has a temperature, and the surface has a temperature.
Climate so-called Scientists Claim that the Atmosphere can heat the surface. But the Atmosphere cannot generate any energy. Where does this energy come from?
Do not believe everything you read. The Atmosphere cannot warm the surface, as it is cooler that the surface. Pyrgeometers are the same thing as infrared thermometers. Buy one, point it it the sky, find out for yourself.
That is all you get from me, what a foolish issue…
Moon
The last two posts from WE has “proven”, using climate phiisics, that the GHE does not alter the energy balance.
So, in a convoluted way, using their own form of phiisics, he has verified the GHE does nothing. That is what I have been trying to get into his head for a few years now.
Small steps. Maybe he will ask himself – If it does nothing to the energy balance; does it matter?
I will not be paying to read this paper but I have read a number of Mishchenko papers.
https://opg.optica.org/josaa/viewmedia.cfm?uri=josaa-33-6-1126&seq=0&html=true
The abstract is sufficient to make the point on what is needed to apply fundamental physics to determining Earth’s energy budget:
My bold on a key point to this post.
You can’t use the average temperature. Imagine half the world at 0K, the other half at 500K.
The average is lower but the radiation far higher.
Also surface temperature doesn’t equal air temperature and so I imagine you can’t use that either
Hello Willis,
I have some difficulty understanding, how the values for the yellow “CO2 forcing increase” curves were determined. Why is the starting point exactly the same as for the trend line of the real measurements?
Should one not determine the CO2 portion of the multiplier and scale this portion according to the claimed sensitivity?
How would this look like for a sensitivity of 0.36°C per douling of CO2? This was the result from my analysis:
https://osf.io/huxge/
Regarding the slight negative trend of the measured values:
Is it possible that it is caused by the slight shift towards higher frequencies of the heat radiation spectrum? The flux increase within the absorption bands of Water and C02 is less than the total change in flux due to this shift.
However the scatter of the multiplier is so tiny, that if dispayed without the extreme “zoom” it would look like a straight horizontal line.
Dear all,
This question may not be placed well here, but do you know if somebody has looked at the positive long term feedback from CO2 increasing plant growth and thereby increasing albedo?
https://www.nasa.gov/feature/goddard/2016/carbon-dioxide-fertilization-greening-earth
Willis work suggests that the climate change of the last 20 years is mostly due to a change in albedo, so this question may be relevant.
More recent versions of climate models incorporate the biosphere in some way. Despite the science being settled decades ago, the climate models still continue to be massaged by incompetent dills to make ever more complex and outrageous predictions in order to produce whatever the politics demand.
There is some prospect of the whole NutZero thingy collapsing before 2030 and the politicians will then require the models to show CO2 has no direct influence. Which I have often stated.
There are significant aspects of trees related to moisture content over land. Remove the trees and the land inevitably becomes a low altitude divergence zone meaning they get less rain. So trees beget trees through local moisture retention in the atmosphere. The Amazon rain forest is the perfect example of what trees can do to attract water. But the models do not have the ability to resolve convection so this contribution to stabilising climate is not identified. When the fundamental concept is flawed, there is no prospect of climate models replication Earth’s climate no matter how complex they get.
Forests can help store water, but do they also increase convective heat transport between the ground and the upper end of the troposphere?
If yes, how large is the change in convective heat transport compared to the change in energy absorption due to change in albedo?
Convective towers resulting from atmospheric instability are the primary engine that power the entire atmospheric motion and most of the ocean circulations.
Over tropical ocean warm pools regulating at 30C they advect 190W/m^2 to adjacent cooler columns. They pump up the troposphere to 14,000m.
In tropical rain forests, the convective towers are even more powerful because the land can warm up in a day and cycle faster than the towers over water so land dominates over adjacent ocean. The trees in the Amazon dominate over the tropical Atlantic causing mid level convergence that draws considerable water from the ocean to land about a month ahead of what would occur if it was water rather than trees on land.
There are more details here:
https://climate.nasa.gov/news/2608/new-study-shows-the-amazon-makes-its-own-rainy-season/
Cutting down trees to instal wind turbines is the best way to turn habitable land into desert. Once the desert forms, it takes at least decades to recover.
Thank you, but I do understand that tropical convection patterns are the main reason for the tropics being cooler than the subtropics. Similar in other regions.
My question was about studies of the effect of more plant growth on the albedo.
I went through Willis last two posts again, and came to one important conlusion: heat flux from convection is eliminated from the caculation of the multiplier in his graphs! Therefore only the albedo effect of forests and other growing plantlife could be visible in the graphs and not the convection effect.
An increase in albedo would reduce the slope of the multiplier curve over time, or create a negative slope.
An increase in radiative forcing would increase the slope of the multiplier curve.
Since the slope is almost exactly zero, the warming effects from change in albedo from CO2 is the same as the change of radiative heat transport. Both values may be small, but both values may be large.
Anything can happen in the world of climate phiisics. The graphs that WE has produced are based on climate phiisics. They are physical nonsense.
Deep convection is the prime mover in Earth’s climate. It drives the whole climate system, converting as much solar EMR as is needed to keep the system stable. If there was no ability for the atmosphere to form a level of free convection then Earth would be a snowball.
Sea ice is also a significant factor by retaining energy in the system.
Earth’s climate system is temperature controlled between ocean surface limits of 30C and -1.8C. Water held on land by the biomass can influence the convection that sets the 30C limit. Far more important than any albedo changes due to trees.
https://wattsupwiththat.com/2022/07/23/ocean-atmosphere-response-to-solar-emr-at-top-of-the-atmosphere/
Trees and other vegetation make the land respond more like the ocean surface because they retain moisture that is available to the atmosphere to drive the convective towers. Once trees are eliminated, the surface can get much hotter and they become perpetual low altitude divergence zones that do not attract water. The Sahara is an example of that.
THe only significant body of water that does not regulate at 30C is the Persian Gulf. It has reasonably high ground level humidity but the dry air from the north prevent the formation of an LFC. The surface temperature of the PG can reach 35C. And it is not due to being shallow because the deep water is much colder and constantly replenished from the Arabian Sea.
Hello Willis
You have been asking about a mechanism that could “amplify” the 3.7W/m^2 at the top of the atmosphere towards the ground.
Note that the IPCC assumes an effective temperature at the top of the atmosphere of 255K. But we got 288K at the ground. This means assuming the same CO2 concentration that there is a change of 288^4/255^4 = 1.6
This results in a radiative sensitivity at the ground of 6W/m^2 per doubling of CO2
Obviusly this does not explain the claimed temperature sensitivity of 3K at the ground, but at least a third of this.
One correction:
Since we are talking about radiation of a gas the stefan Bolzmann equation is not exact (but a good approximation). Instead one should use the absorption spectrum of the gas and the plank equations for more accurate results.
“This shows that the greenhouse has increased the incoming solar radiation by about two-thirds, as measured at the surface.”
–
not happy with this wording.
GHG effect cannot increase the incoming solar radiation , it is a fixed amount that can be focused but not increased.
The surface receives 161 W incoming plus
All the back radiated IR from the layer closest to the surface that can reach the surface without being absorbed.
strangely this is the same amount of IR going out from the top layer to space that cannot be reabsorbed.
while the energy from the lower layer originally came from the sun it is now coming from the GHG and it is incorrect to refer to it as incoming energy from the sun.
thanks
“and it’s nothing like what we’d see if increasing GHGs actually were increasing the surface temperature.”
The GHE of GHGs increased, but the GHE of clouds decreased. The GHG forcing is ‘converted’ to solar forcing through cloud change.
Willis said: “the changes in greenhouse gases are being counteracted”
=============
Or the radiative greenhouse theory is wrong.
Willis, the declining greenhouse efficiency in the face of increasing CO2 is strong evidence that the radiative greenhouse theory is wrong.
We learned in school that real greenhouses were warmed by glass blocking outgoing IR. This was eventually shown to be wrong. That real greenhouses warm by controlling convection.
Now you have shown that increasing CO2 is not causing increase warming, but you cling to the radiative theory without considering that the same process that warms a real greenhouse is behind the earth’s greenhouse effect.
Which “radiative greenhouse theory”? Turns out there are 2 of them which the media never mentions. The first is blocking surface radiation from reaching space and warming the air (a little like a greenhouse). The second is reducing the flow of energy from the atmosphere to space (more like insulation).
The first one is essentially saturated except from small increases from pressure broadening. It’s not surprising there would be little change to it. The second one is where the science goes astray. Willis has shown it doesn’t create any warming.
My own view is the first (slight warming) and second (slight cooling) mechanisms basically cancel each other out.
Unless you can change the lapse rate you cannot change the surface temperature.
Still haven’t seen CO2 anywhere in the formula for lapse rate.
A lot of hand waving that CO2 will change the effective radiation height, but it continues to stubbornly sit at 500mb altitude. Half mass between the surface and TOA. No coincidence.
Which is why increasing CO2 has not changed greenhouse efficiency. It has not changed the lapse rate.
Is this because the atmospheric temperature is determined by 1) the mass? Or, 2) the amount of radiating gases?
The sun determines average atmospheric temperarure.
I happen to completely agree that the effective radiation height is fixed. This sets the basis for the lapse rate. Water adds the final variable and the surface temperature is the result.
The variability in the surface temperature is due almost completely to changes in albedo. Thus your answer is probably more accurately stated using solar energy rather than “The sun”.
Less solar energy will allow the atmosphere to shrink somewhat which in turn lowers the 500 mb altitude and the surface temperature.
I was asking to see what you thought was the basis for the effective radiation height.
The lapse rate is – g / Cp.
G is gravity and Cp is specific heat of dry air. That is the basic one.
Specific heat air is changing as we add CO2. Adding CO2 will decrease the specific heat.
“What this means is that the warmer an object is, the more energy needs to be added to the object to raise the object’s temperature by each additional degree.”
.
.
This is absolutely FALSE. A calorie is 4.1868 joules, and a calorie at 2 degrees C is the same as a calorie at 40 degrees C.
Eschenbach needs a refresher course in Physics 101
3.7 joules will warm a square meter at 2°C by more than it will warm a square meter at 40°C.
Nope, I suggest you join Eschenbach in Physics 101
..
https://en.wikipedia.org/wiki/Specific_heat_capacity
What I stated is true, but the actual degree of warming in each example would of course vary with different heat capacities. You are conflating two different issues.
Greg:
Willis phrased it sloppily, but his point is well taken. He should have phrased it something like:
“The warmer an object is, the greater the additional power flux density is required to raise the object’s temperature by each additional degree, due to the need to compensate for the greater increase in the object’s emitted thermal radiation.”
What does this mean? Let’s take the derivative of the SB equation for a blackbody or graybody:
dQ/dT = 4 * epsilon * sigma * T^3
For an object at 0C (273K) with emissivity 0.95, this is:
dQ/dT = 4 * 0.95 * 5.67E-8 * 273^3 = 4.38 W/m2/K
For the same object at 30C (303K), this is:
dQ/dT = 4 * 0.95 * 5.67E-8 * 303^3 = 5.99 W/m2/K
which is 37% greater.
Thanks, Ed. I assumed that people here were switched on enough that I didn’t have to spell out every step in the statement as you have done. Clearly I was wrong, so thanks for clarifying it for those too dull to do it for themselves.
w.
Hi Willis:
Glad to help. I have noticed over the years that much of the audience here has never done the most basic energy balance calculations of the type needed for the first few weeks of an introductory thermodynamics class.
Neither have they ever worked with actual thermal systems. Otherwise they would not be mystified by the concept of a powered object getting hotter when its heat loss to a cold ambient is somehow impeded.
So I have been careful in my comments over the years to break my argument into the smallest possible steps, and to be very careful in my terminology, to minimize the possible confusion for these people. I think it has helped somewhat.
Pardon me Ed, but it doesn’t work on cranks.
[That reminds me of the old joke ending in “Pardon me Roy, is that the cat that ate your new shoes?]
Ed,
that is not what the statement means. At best it means that if you want to maintain a body at a fixed temperature that is constantly losing energy due to thermal radiation into space then the power needed increases as the fourth power of the temperature.
If you just want to raise the temperature of a body and then are not concerned with it losing heat then the Stefan-Boltzmann equation does not apply. Alternately if the body loses heat by conduction or convection both of which are much more efficient than radiation then you need to supply more power than the Stefan-Boltzmann equation would suggest.
Hi Izaak,
Willis confirmed that I surmised his intended statement correctly. Of course, when other heat transfer modes are in play, they should be included in the calculations.
But the non-linearity of the Planck feedback is the important point here, and was to me obvious from the context of his argument.
“What this means is that the warmer an object is, the more energy needs to be added to the object to raise the object’s temperature by each additional degree.”
========!
This is not correct. The SB equation says it should be true but it is not.
.
cal·o·rie
/ˈkal(ə)rē/
noun
1.
the energy needed to raise the temperature of 1 gram of water through 1 °C (now usually defined as 4.1868 joules).
2.
the energy needed to raise the temperature of 1 kilogram of water through 1 °C, equal to one thousand small calories and often used to measure the energy value of foods.
For a surface to be warmed a net 1.2°C by 3.7W/m^2, it would have to be at minus 34°C. (with emissivity = 1)
You are incorrect. The Stefan Boltzmann equation applies to EMISSION, and has no application to absorption.
3.7W/m^2 on a surface at zero K would warm it by 90K.
Greg Bacon September 4, 2022 9:59 am
It does at a steady-state condition. For example. Per S-B, an object at ~16°C emits ~ 400 W/m2. If it is at steady-state (neither cooling nor warming) it MUST also be absorbing ~ 400 W/m2 of energy from somewhere.
w.
Nice goal post move, adding “steady state condition.” Again, SB says nothing about absorption, you are adding in that factor when you move the goal posts.
Again you are confusing energy flux with energy. The statement that “ absorbing ~ 400 W/m2 of energy”
confuses two different things, power flux per square metre and energy. A light bulb for instance might radiate away 400 W/m^2 but it gets the required energy from the current and does not absorb 400 W/m^2 since the cross-section of the wire is much smaller than the emitting surface.
The Stefan Boltzmann equation applies to EMISSION, and has no application to absorption.
========
Then why is SB being used to predict how much warming will result from an increase in back radiation?
I believe you are correct, which explains why Willis incorrectly predicted it would take more energy to warm a warm object, but for the sake of Devil’s Advocate I’m asking the obvious question which is at the heart of radiative greenhouse theory.
https://www.researchgate.net/figure/Graph-of-a-function-of-total-emitted-energy-of-a-blackbody-proportional-to-the-fourth_fig2_334029343
Exactly, but will Roger get it?
Willis wrote “What this means is that the warmer an object is, the more energy needs to be added to the object to raise the object’s temperature by each additional degree.”.
Ferd replies:
This is clearly contradicted by the specific heat of liquid water. It calls into question the radiative greenhouse theory which relies heavily on S-B to predict temperatures.
Until this contradiction is resolved futher discussuon about radiative forcing is pointless.
Ferd, we’re measuring different things.
I’m talking about objects that a steady-state condition, objects that are receiving heat in some fashion and are free to radiate away the heat.
Specific heat is not measuring that at all. It assumes that the object is NOT losing heat.
Contradiction resolved. Further discussion is now pointfull.
w.
Looks like a perpetual motion machine to me.
Looks more like Eschenbach moving the goal posts to cover his error.
Willis wrote “What this means is that the warmer an object is, the more energy needs to be added to the object to raise the object’s temperature by each additional degree.”… “I’m talking about objects that a steady-state condition,”
Ferd wrote:
Willis, SB is a measure of power not energy. What SB tells you is that it takes more power to raise the temperature of a warm object vs cold. But what you said is that it took more energy. Specific heat says the energy remains the same.
Nothing to do with solid state.
It is about a steady state, not a solid state.
Greg Bacon September 4, 2022 12:44 pm
Greg, seems you must be either looking in the mirror or talking about your friends. I don’t move the goal posts. I was simply describing the difference between what Ferd and I were talking about. So you can stuff your ugly insinuations up your fundamental orifice.
w.
You are correct. Willis is wrong.
The engineering toolbox gives the isobaric specific heat of water at different temperatures as follows:
1C = 4.22 kj
10C = 4.2 kj
20C = 4.18 kj
30C = 4.18 kj
As can be seen, as water warms it actually takes less energy to warm it further. This is opposite to what S-B predicts. Another nail in the coffin.
The Wijngaarden and Happer 2020 paper* calculates a sensitivity of +1.4C for doubling of CO2 at fixed absolute humidity and +2.3C for fixed relative humidity. The latter number includes a feedback process that raises the amount of H2O in the atmosphere with temperature, which amplifies the effect of raising the CO2 level. So the extra warming is down to H2O. I note that these numbers are somewhat less than the figures quoted in Willis’ 2nd paragraph above.
These figures are for clear sky only – the real world has something like 2/3rds of its surface covered by clouds of various kinds. I don’t believe that there is any straightforward calculation available that deals with the cloud covered portions of the world. So, what the real world sensitivity looks like is really an unknown – an unknown caused by our limited understanding of clouds.
It is also not clear that fixed relative humidity applies in the real world, at least not everywhere. Dr Roy Spencer has a graph showing that for the tropics, the atmosphere does not follow fixed relative humidity as the temperature of the surface rises, so that the implied extra warming from feedback does not apply there.
* ”Dependence of Earth’s Thermal Radiation on Five Most Abundant Greenhouse Gases”
https://arxiv.org/abs/2006.03098v1
If W/H 2020 was correct we should have seen some change in the GHE over the 20 years of CERES data. Water vapor should have enhanced it. I think their physics is solid. However, they are only considering radiation. I suspect this is where their divergence from observations begins. Accepting the observations are correct, then clearly there are feedbacks not yet considered in determining Earth’s atmospheric energy flows. A radiation model alone is insufficient.
Agreed that a radiation-only model is insufficent. Dealing with clouds is in reality dealing with a complex system of convection and heat & moisture transport. However, I think that the figures quoted by Willis and the W&H paper are all based on “clear sky” calculations. Any other calculations are extremely hard and would depend on all kinds of variables many of which are not well understood.
Nope. Unless specified, all of my graphs and charts are for all-sky conditions.
w.
Takes an object at temp T radiating 1 watt. Double the temp to 2T. By S-B it will now radiate 2^4 = 16 watts.
So the question is, did it take 16 – 1 = 15 watts to double the temperature of the object.
The problem is that watts are power, not energy. So you need to know how long it takes to warm the object.
And what specific heat tells us is that since the energy remains the same, the time to change the temperature must decrease as radiation power increases.
Thus the contradiction. The radiative greenhouse theory bases temperature on power while specific heat bases temperature on energy.
Climate science ignores mass, time, energy, and specific heat so no contradiction exists because these properties don’t exist.
But now there is a new contradiction, because mass, time, energy, and specific heat do exist.
This explain why Willis has found yet another example of a climate science prediction that has proven false.
Doesn’t it take just 1 failed prediction to prove a theory false? Why does WUWT cling so strongly to the underlying assumptions? It is a marvel to me.
To simplify – a watt is a joule/sec. It takes “x” amount of joules to raise the temperature of an object a certain amount. So if you know the power flow (in joules/sec) and how many joules you need then you can calculate how long it will take. (nbr of joules)/(joules/sec) = sec.
The number of joules you need *is* dependent on mass and specific heat.
The dimension of specific heat is Joules/ (kilogram * K). So to get the number of joules required you multiply the specific heat by the mass and the temperature change.
(mass * ΔK) * joules/(mass*K) = joules.
Willis wrote:
I’m talking about objects that a steady-state condition, objects that are receiving heat in some fashion and are free to radiate away the heat.
Ferd replies
The Radiative Greenhouse Theory rests on the notion that since N2 and O2 are not greenhouse gases they are not free to radiate heat away.
While ignoring that N2 and O2 both delay cooling by transporting energy from hot places to cold, thus decreasing the effective temperature of radiation.
And it is this delay and decrease in the temperature of radiation that in fact is the principle behind the greenhouse effect.
And in a similar fashion the ocean currents also delay cooling and decrease the effective temperature of radiation.
Ferd,
Unfortunately for GHE believers, N2 and O2, like all other matter, do radiate energy – continuously – if above absolute zero.
The atmosphere acts to decrease maximum surface temperatures, and increase minimum surface temperatures. The Moon, when at the same distance from the Sun, provides examples of far greater maxima, and far lower minima, compared with the Earth.
Even on Earth, the greatest diurnal variations (and the highest temperatures) occur in arid deserts with the least amount of GHGs (H2O) in the atmosphere above.
Wot, an inverse GHE? Very strange, this “climate” physics!
Today’s commonly used temperature measurement units are Celcius and Fahrenheit, named after two gentlemen who lived in temperate climates where water (or brine) freezes seasonally.
In the 18th century tropics 99.99% of inhabitants never saw frozen water; they also couldn’t understand what ‘snow’ is. They might have made a unit C named after Coconut oil, which has its melting point at 25 Celcius / 78 Fahrenheit 😀
Perfectly argued. Using their own figures compared with observations proves CO2 is not the control knob they want it to be.