Here’s an article from PHYS.ORG
by Bob Yirka , Phys.org
Researchers affiliated with several institutions in the United States has determined that the increase in the number of hurricanes forming in the Atlantic over the past several years is not related to global warming. They suggest instead, in their paper published in the journal Nature Communications, that it is simply reflective of natural variable weather patterns.
Over the past several decades, scientists studying satellite data have found that the number of hurricanes forming in the Atlantic Ocean has been increasing. Many in the field have suggested that this is due to the impact of global warming. A warming ocean, they note would naturally lead to more active atmospheric activity. The problem with such thinking, the researchers from this new effort note, is that satellite data only goes back to 1972. Prior to that date, data on hurricane frequency tended to come from eyewitness accounts, which left out many hurricanes that never touched land. In this new study, the researchers went back to the old record books to learn more about the frequency of hurricanes prior to satellites.
The old-time data stretched as far back as 1851 and came courtesy of records kept by workers at the National Oceanic and Atmospheric Administration. The workers had collected the data from eyewitnesses across the eastern seaboard, along the Gulf of Mexico, islands in the Atlantic and fishermen venturing out to sea. The researchers then calculated the ratios of hurricanes that never came ashore in modern times to those that did, and worked backwards using modern data along with math techniques to estimate the number of hurricanes going back to 1860 that were never recorded. They then plotted those numbers on a timeline.
Here is the paper in nature communications
Nature Communications volume 12, Article number: 4054 (2021) Cite this article
Abstract
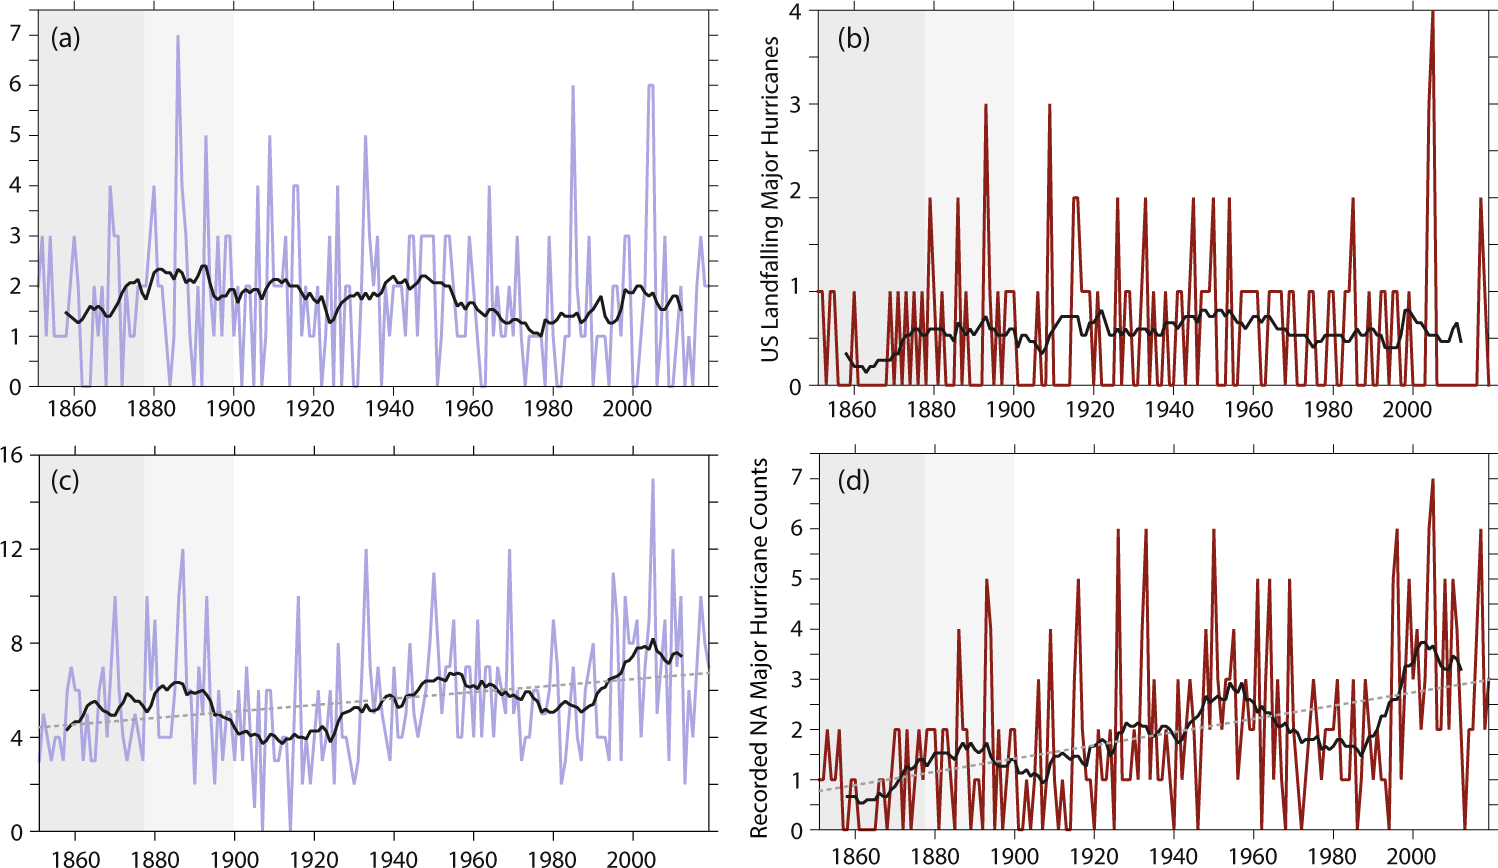
Atlantic hurricanes are a major hazard to life and property, and a topic of intense scientific interest. Historical changes in observing practices limit the utility of century-scale records of Atlantic major hurricane frequency. To evaluate past changes in frequency, we have here developed a homogenization method for Atlantic hurricane and major hurricane frequency over 1851–2019. We find that recorded century-scale increases in Atlantic hurricane and major hurricane frequency, and associated decrease in USA hurricanes strike fraction, are consistent with changes in observing practices and not likely a true climate trend. After homogenization, increases in basin-wide hurricane and major hurricane activity since the 1970s are not part of a century-scale increase, but a recovery from a deep minimum in the 1960s–1980s. We suggest internal (e.g., Atlantic multidecadal) climate variability and aerosol-induced mid-to-late-20th century major hurricane frequency reductions have probably masked century-scale greenhouse-gas warming contributions to North Atlantic major hurricane frequency.
Introduction
Tropical cyclones (TCs) are of intense scientific interest and are a major threat to human life and property across the globe1,2,3. Of particular interest are multi-decadal changes in TC frequency arising from some combination of intrinsic variability in the weather and climate system, and the response to natural and anthropogenic climate forcing4,5,6,14,15,16,17,18,19,20,21,22,23,24,25. Even though the North Atlantic (NA) basin is a minor contributor to global TC frequency, Atlantic hurricanes (HUs) have been the topic of considerable research both because of the long-term records of their track and frequency that exist for this basin, and because of their impacts at landfall. It is convenient and common to consider Saffir-Simpson Categories 3–5 (peak sustained winds exceeding 50 ms−1) HUs separately from the overall frequency, and label them major hurricanes, or MHs. Historically, MHs have accounted for ~80% of hurricane-related damage in the United States of America (USA) despite only representing 34% of USA TC occurrences1.
Globally, models and theoretical arguments indicate that in a warming world the HU peak intensity and intensification rate should increase, so that there is a tendency for the fraction of HU reaching high Saffir-Simpson Categories (3, 4, or 5) to increase in models in response to CO2 increases, yet model projections are more mixed regarding changes in the frequency of MHs in individual basins (e.g., NA)6,20,21,22,25,26,27,28,29,30. Homogenized satellite-based TC intensity observations since the early 1980s show an increase in the fraction of MH to overall TCs both in the NA and globally14, and there has also been a documented increase since the 1980s in the fraction of global and NA HU that undergo rapid intensification15. Theoretical arguments, modeling studies, and observational analyses indicate that the overall frequency of TCs and their intensity across the tropics, and for Atlantic HUs in particular, may vary differently and exhibit distinct connections to climate drivers14,15,25,26,27,28,29,30,31,32. There is substantial spread in model projections of the 21st century response of both overall NA HU frequency and of the response of the frequency of the most intense NA HUs6,20,21,22,25,26,27,28,29,30. However, the connection between recent recorded multi-decadal changes in NA HU activity and 21st century HU projections is complicated by the fact that recent changes (e.g., since the 1970s) in NA HU and MH activity likely contain a substantial contribution from internal climate variation or non-greenhouse gas forcing16,17,18,19,20,21,22,23.
Has there been a century-scale change in the number of the most intense hurricanes in the North Atlantic? Analyses of longer records (i.e., going back into the 19th century) of NA HU and MH frequency provide an additional lens with which to interpret both recent HU activity changes and projections of future hurricane activity. The North Atlantic Hurricane Database version 2 (HURDAT2; ref. 33) provides records of NA HU activity going back to 1851—a nearly 170-year record of HU activity. Using HURDAT2, one can explore secular changes in aggregate statistics of NA HU activity, such as the annual number of HU and MH strikes in the USA and the annual number of HUs and MHs in the Atlantic (or basin-wide HU and MH frequency). The USA HU strike record we use includes storms for which either hurricane strength, or vmax ≥ 33 ms−1, or major hurricane strength, or vmax ≥ 50 ms−1, winds impacted the continental USA from the Atlantic or Gulf of Mexico, so this record includes storms for which the center did not cross onto land.
Due to changes in observing practices, severe inhomogeneities exist in this database, complicating the assessment of long-term changes7,8,9,10,11,12,13. In particular, there has been a substantial increase in monitoring capacity over the past 170 years, so that the probability that a HU is observed is substantially higher in the present than early in the record10; the recorded increase in both Atlantic TC and HU frequency in HURDAT2 since the late-19th century is consistent with the impact of known changes in observing practices7,8,9,10,11,12. Major hurricane frequency estimates can also be impacted by changing observing systems13.
We here show that recorded increases in NA HU and MH frequency, and in the ratio of MH to HU, can be understood as resulting from past changes in sampling of the NA. We build on the methodology and extend the results of ref. 10 to develop a homogenized record of basin-wide NA HU and MH frequency from 1851–2019 (see Methods Section), this homogenized record indicates that the increase in NA HU and MH frequency since the 1970s is not a continuation of century-scale change, but a rebound from a deep minimum in the late 20th century.
This blog post we covered last month seems to foreshadow this paper.
Satellite observations of hurricanes should produce the same sort of artifact as Doppler radar does for tornadoes, of an increase in recorded storms that do no damage and do not really impact people.
It is good to see someone try to quantify this effect.
Satellites are looking down at the storms, you would not be able to get a doppler reading.
Satellite speed measurements are done by locating a unique feature in the clouds, and measuring how far that feature moves between photos.
Tom was not suggesting that Doppler measured hurricanes, it is rather a similar example of new technology increasing the detection of these weather events.
Same as how more testing for a disease or disorder makes it appear as though it’s becoming more common when it really is not, it’s that more cases of it are being found.
???
You seem to be targeted by the negative bots lately, MarkW. You must be over the target!
It’s not so much that hurricanes that never come ashore don’t matter and therefore should not be counted. It is that one cannot do a direct comparison of historical records to modern records without adjusting for tropical systems that never landfall.
Obviously for hundreds, thousands, and millions of years, tropical storms occurred that were never recorded. Ditto for any other natural phenomenon, such as earthquakes, volcanic eruptions, asteroid strikes, etc.
The difference is that those geological and astrophysical events left geologic records that can rather easily be read today by geologists.
Hurricanes and other tropical cyclones generally leave no geological record behind, so it is next to impossible to ascertain their strength and frequencies before modern records were maintained. All we really have prior to the late 19th century are records left behind of really major events, and again that only applies to when written records even existed, which leaves out nearly all of geologic history, and indeed even leaves out nearly all of archaeological history.
The extremely short record of satellite observations can only be used to describe very short term trends and cycles, far shorter than typical climatic trends and cycles.
During the time of Columbus, many Caribbean islands had very small populations. Some, which would otherwise seem to support human life, were even barren. Studies of trees showed something unusual – all the trees were the exact same age. The theory is some islands were literally scoured of most plant life and humans by hurricanes.
That may be, but most cyclones have relatively small diameters of the winds and resultant storm surges that would create long load term effects on trees or other lifeforms. If a particular eyewall happens to miss an island or section of mainland coast, that doesn’t mean it did not exist.
When Andrew cut thru south Florida in 1992, it was like a buzzsaw leaving a visible path of destruction across the peninsula, but it was only about 10-15 mi wide. If it had passed 50 miles to the south there would not have been a visible path at all, as it would have passed thru the Florida Strait and left no marks at all on any landscape or vegetation.
No geological record: this does not stop them. I was looking over Atlantic hurricane ACE data a month ago. I had looked at it in the past. I simply go to ACE page in Wikipedia that lists ACE, and TS count and hurricane count, year by year.
A few years ago, they merely had data back to 1951. Now, recently, they have “data” going back farther – to 1851.
I was reading to find out where these “data” are coming from. They are guesstimating from things such as sediment patterns in coastal areas.
As I see it, this attempt to model past TS activity puts a low-pass filter on ACE or TS level per year for these distant years. How would we know, from destroyed forest or piled-up sediment, whether a hurricane was Cat4 or Cat5? How would we know whether a hurricane lived for a week at Cat1, or for a couple hours at Cat1?
So, maybe you can know that there was a TS event, but the peak magnitude of each detected is likely to not be noted from the geological or other type of data we are using.
Here is an analogy. Sure, a loud noise can break a window. If a window breaks at 100 db, it will be broken with a sound level of 110 db, and 120 db. How do you know which? What would make a 120 db soud level get noted if the measure is: window broken? You have a ceiling effect on the measurement, which provides a low-pass filter effect or bias in the data: peaks are cut off.
The wind at the edge is slower than the worst near the centre. So in some cases they can look at the effects at different distances to see the area/distance of observations. If a window breaks at 100 something then a stronger storm will see this damage further away from the centre and thus damage a larger area. Working backwards (assuming a gradient) the worst near the centre is higher and can be estimated based on the other data points.
I doubt the proxies that they are using have sufficient resolution to pick out a single storm 100 years ago. More likely they are looking at average impact over a season at a particular spot.
It should also be pointed out that the resolution of all tropical systems is now extremely fine. That is to say that the peak strength of all storms for the duration of those storms is known.
So we now get the peak wind speeds. The lowest low pressure reading, etc…
In the past we never achieved that or anything close. For decades peak wind speeds depended on ground recordings.
( compare all recent hurricane peak wind ratings to peak ground records for the same storm. You will find that the ground records are ALWAYS considerably below the peak winds assigned to modern storms )
And then, for sometime, we depended on plane flights, which over time increased in frequency. So, as stated, now we have continues recording, picking up the actual peak at the most optimal time.
Also it should be noted that recent storms consistently fail to manifest expected ground damage equal to their ratings and fail to manifest storm surges equal to the predicted levels. The ground damage observation and storm surges are usually 1 plus categories below the assigned category.
One would think apples to apples they should be “rating” hurricanes by ground station measurements, not satellite measurements.
But that doesn’t feed the “weather is getting worse” propaganda, so…
It is a pity that extreme weather events like heatwaves, exceptional summer flash floods, year of rain in a day, record arctic circle temperatures, severe monsoon rains aren’t, these days.
Yes it is called weather. Happens every day.
Extreme weather events began in 1988?
You’ve been schooled on this many times before, griffter.. Apparently it takes a few working brain cells to understand that weather is normally highly variable and always has been, a few working brain cells which you don’t appear to possess. A statistical analysis is required to determine if there has been any change in anything that’s normally highly variable, like weather, not your pathetic efforts to sway opinion with recent anecdotes.
It’s a pity that you don’t have a brain.
I heard Michael Mann’s is going spare!!!
Alexandra Ocasio Cortez has one going begging that has never been used.
Absolute snip.
Bruce:
I have said this before, and I will repeat it here.
The Left (and certainly including Griff) operate more on an emotional level than on an intellectual one with issues like climate change and energy. They readily accept the climate alarmist narrative out of hatred for fossil fuels and fossil fuel companies.
Their emotions demand confirmation of the climate scare narrative and their other eco-belief systems regardless of the narrative’s scientific soundness (or lack thereof). Thus we see his comment above.
Those (including me) who do not accept the climate scare so readily operate more on a intellectual level with issues like climate change and energy (among others). The intellect is more dominant, and emotions (such as with issues regarding fossil fuels and FF companies) are not a strong driver or factor. OBJECTIVE and sound science does not play second fiddle to our emotions.
This is just my theory on the reason for the divisions between Left and Right on these and other issues. As the old adage says: Republicans think but don’t feel, and Democrats feel but don’t think.
I believe that all of us should do equal amounts of feeling and thinking as much as possible, although I readily acknowledge that the intellect should dominate in fields like science and engineering. Griff apparently does not understand the latter.
Spot on
>>out of hatred for fossil fuels and fossil fuel companies<<
out of hatred for themselves
Leftists have been assured since the womb that they are special people. Participation trophies for everyone.
When they hit the real world, they find out that the real world doesn’t give a damn about them. This results in a conviction that the real world is broken and that only by giving total power to them, can the real world be fixed.
Funny how everything warm, is now proof of global warming.
I seem to remember the griffster getting quite upset this last winter whenever someone claimed that record breaking cold was proof that there was no global warming.
griffter, you were listening to the BBC instead of reading the Guardian…hows about those insects? 75% of all insects gone in the last 50 years? Your attention is needed griffer.
What?!? I missed that.
I’m gonna have a lot of pI$$ed off insects in my back yard when I give them the bad news.
And it’s too bad the 17-year red-eyed cicadas didn’t get the news. It was the heaviest hatch I’ve ever experienced, and I’ve seen some good hatches over 60-odd years.
Griff and tsunamis right?
How rare does a weather event have to be to be considered extreme? How many people, or square miles, does it have to effect to be significant? Provide quantified definitions of each. Now do the math and let us know how many could be expected in an average year. This year is probably about average. If not, try to explain why five times that amount wouldn’t happen some years due to normal variation.
Oh no!!!! It’s raining, must be Climate Change!!!………….Oh no, it’s very sunny, must be Climate Change!!!………..Oh no, it’s very cold today with unusually early frosts, must be Climate Change!!!……… Oh no, it’s really hot today, must be Climate Change!!!
We’re living in the neo-world of Cry Witch, I truly feel very worried about women today, any of them pronounce anything off message, will be accused of witchcraft, they’ll then be bound about the arms & legs, placed on a newly constructed Ducking Stool & apparatus (See-saw), (built by an enthusiastic carpenter/joiner belonging to Red-War (Greenpeace), &/or Enemies of the Earth (Friends of Gaia), WWF, (too polite to embarrass my UK/Antipodian friends by defining the second W & the F!!!), then if she refuses to confess her sins & get drowned from the Ducking Stool, gets dried out by using all the left-over timber on a nice roaring fire tied to a steak (part of the left-overs) & burnt alive (only for a short term, she’d be dead in minutes)!!! We truly are entering a neo Dark Ages existence, where real science is witchcraft, & the neo science is fact, the UN has truly become the neo Catholic Church/Church of England of the modern world!!! Socialism, what a gift to the Human Race….NOT!!! Lenin, Stalin, Hitler, Mao, Pol-Pot, oh how many millions did they slaughter in the name of Socialism!!! I hope they’re ever so proud of their murderous faith!!! Sorry it’s been a very long day!!! AtB.
Where was the UKs record heat?
Nowhere
Griff
Do you have any hair left?
Griff is always trying to pull a rabbit out of the hat, unfortunately there is no hare in there. (-;
“…severe monsoon rains aren’t, these days.” WHAT, Griff? Aren’t WHAT? They ARE recorded, and future doomsdayer’s will be able to quote them. But, today, they are just a part of the everyday weather and events that we ALL experience! I was experiencing them in the early 1950’s, as a boy, when it was REALLY hot in West Texas! BOY, was it hot! And yes. we had terrible storms in the Winter and we had AWFUL sand storms, too! SURPRISE! The climate has ALWAYS ‘changed’ and I suspect that it always will change! We compensate, we adapt and we survive as best we can. After all, it isn’t the end of the world, you know.
I know, some people just aren’t happy unless they can make themselves miserable, right, Griff?
Griff, on another note, the average annual temperature of New York City is 55.0 F (12.8 C). The average annual temperature of Miami, FL is 76.2 F (24.6), a difference of 21.2 F or 11.8 C. The difference is >3 times the worst case projections of 21st century GHG warming using implausible scenarios and unreliable models. So please explain to all of us why so many New Yorkers and New Englanders move or retire to Florida. Why do they seek far more warming than could ever happen due to greenhouse gases? Worst case modeled warming by 2100, if it were even plausible, would be the equivalent of moving from Northern Iowa to Southern Iowa, a distance of less than 200 miles. Woo. Be scared, be really scared.
Extreme…skateboarders terminology
Yes it a pity the record for the most rain in the shortest amount time is held by my home town in Minnesota 12 inches in four hours. It was 1910 or 1912. That same town will never set that record again since it has no weather station now. The area I grew up in is very wet even for Minnesota, where they are now measuring the weather is it out of that area.
The weather has never followed climate averages. There has never been a year you could call “average”. If you studied meteorology, physics, geology and paleontology and the rest of the records, you would see the extremes. The long term temp/climate proxies are effected by multiple confounding factors. If (a+b)*c=proxy and a, b & c are unknown these proxies are calculating a based on the proxy while guessing the rest. Often the proxies are based on or produce a muliyear, multidecade or longer averages the further you go back. This smooths the peaks & troughs so hides the extremes. You have to know & understand the methods, error range & limitations of the data sources you are comparing with. Don’t just trust the pretty graphs, dier warnings & sensational headlines when researchers & media are only paid when a problem needs fixing and for bad news. Humans measuring with current technologies is a mere blink in an extremely long time.
Another problem is the misuse of language when describing the weather. They keep talking about “NORMAL,” (“above normal” or “below normal” or “x times the normal amount” etc.) when what they are referencing is nothing of the kind. They are, instead, talking about the “long term average,” which is from a “floating” 30-year period (which has no real significance aside from being recent). And an “average” is nothing more than a midpoint of extremes.
A “departure” from what they mislabel as “normal” is NOT “abnormal” or “anomalous” in any way, shape, or form.
But it makes great headlines for the propaganda pushing media…
Climate change has become “heads I win, tails you loose” where everything is blamed on climate change. So climate change beliefs have become unable to falsify using observations. Unfalsifiable beliefs are unscientific. So while AGW could be tested, Climate Change beliefs are unscientific. 50% chance of increase means 50% chance of decrease and includes a range covering all possible outcomes so those predictions are worthless. When Climate models with multiple runs are giving results for clouds, rain, wind & extremes in broard ranges that cover increase & decrease, the predictions are worthless. Look at the detail not the headlines using the worst case scenarios.
Griff says, …severe monsoon rains aren’t, these days”.
I may agree if you completed your thought.
“aren’t” what?
“aren’t any different in the past then these days. ( see we may agree)
We used to call them Tropical Revolving Storms (TRS) when I was studying Meteorology for my tickets.
Oldseadog
That’s exactly what they are. In the post they describe them as weather events, that is not an accurate description. TRS are borne of necessity, to transport convective heat vertically, that is the only reason they exist. They accelerate rapidly for exactly the same reason they start in the first place.
Regards
Here’s a Google Search on “ryan maue tropical cyclone chart” You can take your pick.
Aerosol induced hurricanes?
Well, my aerosol does produce an awful lot of wind, it’s true…
Even if you take the warmunists at their word, they are claiming that the oceans have increased in temperature by 0.01 to 0.02C.
I strongly doubt that we would be able to measure the increase in wind speed that would be caused by such a miniscule amount of ocean warming.
Excuse me, but isn’t that 0.01 C increase equal to about a bazillion bazillion Hiroshima’s? <G>
More like a gazillion gazillion!!! 😉
I’m holding out for Kazillion KAZILLION.
A Kazillion KAZILLION?
It’s worse than we thought!
And I strongly doubt that we can actually measure a temperature change of 0.01C, so it’s a perfect match.
If you take all the .00001s, .00003s. .00004s, etc. and add them all up, yeah, you can come up with a .01C.
–
Do note: You need some seriously squinty eyeballs to discern those .0001s.
Wait… so I can conclude that Climate Scientists® have seriously squinty eyeballs?
You’re getting full marks for witty comebacks today 🙂 (provided that isn’t an attempt at a racial slur … otherwise … cancelled)
“…they are claiming that the oceans have increased in temperature by 0.01 to 0.02C.
I strongly doubt that we would be able to measure the increase in wind speed that would be caused by such a miniscule amount of ocean warming.”
Misleading. Your numbers includes the entire ocean abyss. As far as the weather events like tropical storms go, deeper than a few hundred metres is irrelevant.
How is the average surface temperature going?
https://wattsupwiththat.com/ocean-page/
So basically, in what passes for your mind, it doesn’t matter that they are making up data, because they aren’t talking about the data that interests you today.
Yabut, 97% of Climate Caterwaulers claim that we are now heating the oceans at a rate equivalent to six Hiroshimas per second, and over the past 25 years, we have heated the oceans to the tune of 3.6 billion Hiroshimas. They know this because robust computer models tell them so. So there you have it. Unless we crater our economies, we’re doomed.
“Climate Caterwaulers”
–
Like, like like, like………… like, like like……. like, like, like…. and so on…. and so on…. like. like…. and so on…
P.S. Somebody stop me when I get to a million ‘Likes’.
Thanks in advance.
Bruce comes up with some good ones sometimes. 🙂
Figure 1 shows it all pretty clearly. The increase in hurricanes during the 80’s and 90’s was a return to a previously seen normal level of activity. The limited data hints at a sixty year cycle, with the satellite recorded activity for the North Atlantic rising and falling with the landfalls. If it is cyclical, the an overall decrease in hurricane activity will continue for the next twenty years.
Well, blow me.
I don’t know you well enough.
“They suggest instead, in their paper published in the journal Nature Communications, that it is simply reflective of natural variable weather patterns.”
I didn’t have time to read the whole thing but it seems to me, the gist of the study is not that the increase in frequency is due to natural variation, but that it is due to the increase in observational capabilities. In other words, it not so much an increase in frequency as it is ‘an increase in’ better technology, (not to mention a change what constitutes a countable TS/HU.)
Ok, I’ll bite. When did the plural form of irregular verbs vanish from the English language?
Or is it like ‘taking the knee’ – paying homage to Pidgin?
Sadly, not many people these days would have caught that. I believe there’s a tendency to pay homage to low brow, anti education culture.
It’s Global Warming wot dun it!
Correct English is racist.
simple common sense = we can detect ALL storms now and 100 years ago we could NOT come anywhere near detecting all storms.
We can even detect storms that wouldn’t have qualified as storms in years past.
a significant number of “hurricanes” are actually ” fish storms ” which stay offshore and as in 2020 many are only marginal tropical storms which only last a day or two , sometimes less .
If you go to the NOAA website, it has several pages discussing this issue. really the whole global warming causes hurricanes thing was disproven, resoundingly, in 2010.
After reading that headline I figured that was the reason we’re relying more and more on models to ‘show’ us how bad things are getting.
We suggest internal (e.g., Atlantic multidecadal) climate variability and aerosol-induced mid-to-late-20th century major hurricane frequency reductions have probably masked century-scale greenhouse-gas warming contributions to North Atlantic major hurricane frequency.
…so there is no increase in the number of storms but we have to say that there is or we’ll be cancelled.
Checking the recorded storms in the Atlantic over the years. https://en.wikipedia.org/wiki/Pre-1600_Atlantic_hurricane_seasons https://en.wikipedia.org/wiki/List_of_Atlantic_hurricanes_in_the_17th_century https://en.wikipedia.org/wiki/List_of_Atlantic_hurricanes_in_the_18th_century http://www.stormfax.com/huryear.htm Hurricanes been around longer than we have been in NA. More than just a Doomsday event for the MSM. It’ Natural Weather.
Klotzbach and Gray showed the correlation between Atlantic Hurricanes and global cooling back in 2008:

Full article: https://www.researchgate.net/publication/237341657_FORECAST_OF_ATLANTIC_SEASONAL_HURRICANE_ACTIVITY_AUGUST_MONTHLY_ACTIVITY_AND_US_LANDFALL_STRIKE_PROBABILITY_FOR_2008:
“…since the 1970s are not part of a century-scale increase, but a recovery from a deep minimum in the 1960s–1980s.”
So, there must have been a very deep cooling in that period… hmmm … where did it go? It was “The Ice Age Cometh”, when temps dropped ~1°C from the late 1930s-early 40s peak record temps for the 20th century …hmm…and where did that go?
Well, both the deep cooling period and the earlier century high were disappeared, first, by GISS in 2007 – Hansen’s gift to the “Team” on the eve of his retirement (look for major fudging on the eve of influential climateer retirements). And followed gradually, by others.
Didn’t Dr. Neil Frank make exactly this point in the early 2000’s? He reviewed then “record” activity using only the observational capabilities available in earlier decades and concluded that the era of greatest hurricane activity was the 1930’s.
So someone has finally got around to sort of what I’ve been suggesting since 2005’s record number of named Atlantic storms. My suggestion has been to remove storms from the later record that *could not* have been known existed using the techniques and technologies of the mid 1970’s and earlier. If a storm from the mid 70’s to the present never made landfall on inhabited land, never ran over a ship in established shipping lanes, was never directly observed by human eyes – in the ‘old times’ it may as well never have existed because nobody knew it was there.
The advents of “hurricane hunter” aircraft, more instruments on uninhabited land and floating at sea, and especially weather satellites, has “increased” the total numbers of storms simply by making it impossible for any storm to brew up and blow out without anyone seeing it.
But rather than remove later storms that would have been unobserved with old techniques, these people are extrapolating how many storms there *might have been* observed had today’s techniques and technologies existed 50+ years ago.
That’s going about it backwards! That leaves the effort open to “But there’s no way to know for certain…” when ‘weeding’ the modern record of known storms for ones that could not have been known 50+ years ago would be exact because we *know* what and where all of them were, and thus we know which ones would’ve been literally in-visible using the old techniques and technology.
No surprise. Just hurricanes in Looney lefty heads are more frequent, that’s all.
Back in 2008, Klotzbach and Gray showed Atlantic Hurricane activity increased with global cooling, not global warming. It makes sense, as temperature differences increase.