


Bitcoin (BTC) Talking Points:
- Bitcoin looks to put a rough month in the rearview mirror, with nearly half its value being wiped out
- BTC consolidating in a narrow range, significant breakout in either direction may be imminent
- A break above $40,000 brings $42,000 into play, while $37,000 remains looming on the downside
Bitcoin continues to face downward pressure despite fears of a continued rout seeming to dissipate. Forced liquidations ran as high as $4 billion on May 19th during the rout according to Bloomberg Intelligence, leaving investors with plenty of scar tissue following the recent pullback. Despite the shakeout, Bitcoin appears to have found a footing, as the currency briefly traded back up to $40,000.
Despite the recent bounce, investors should remain wary given the volatility associated with digital assets. Bitcoin has appeared to struggle to materially break above the $40,700 level following the recent pullback, which constitutes the January 2021 swing high. Failure to break above this key level may bring additional downward pressure to the vulnerable asset, and may see Bitcoin test key levels below at $37,000 and $32,000 respectively.
BTC/USD Daily Chart
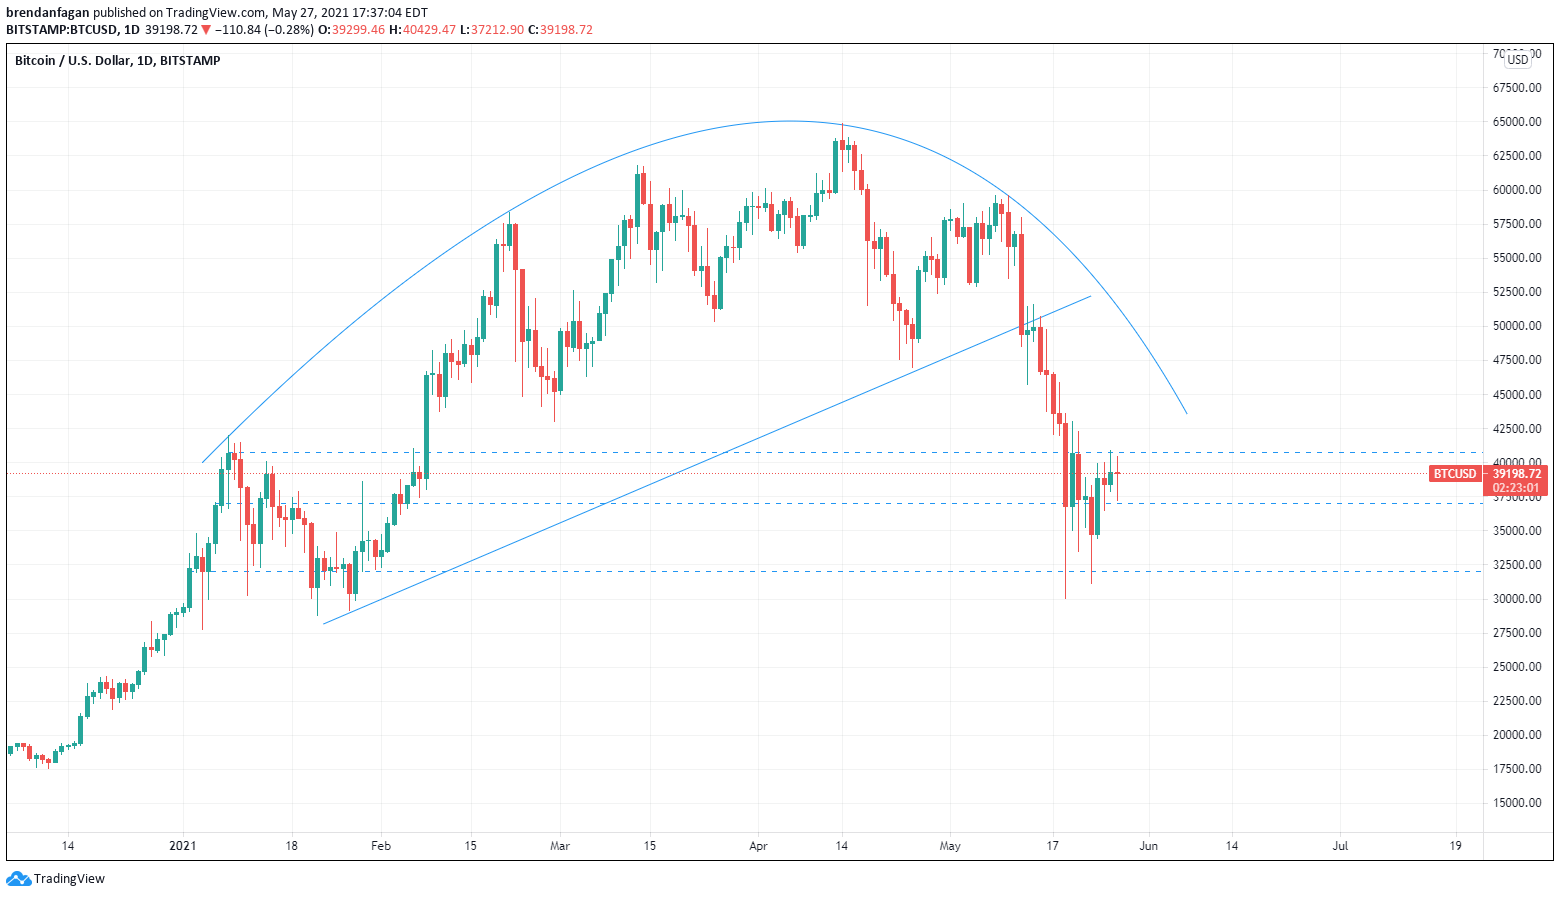
Chart created with TradingView

Using a Fibonacci retracement from the May 10 high to the May 19 low, we can observe that Bitcoin is stuck consolidating in a tight range. BTC remains between the 0.236 level at $37,000 and the 0.382 Fib level at $41,265. Prior to testing the 0.382 Fib level, Bitcoin will need to break above the psychological barrier at $40,000, an area where it has failed multiple times over the last few days. Continued failure at $40,000 may bring $37,000 and below into play in the coming days. Any further significant move to the downside may yet again see a large number of forced liquidations, which helped speed the decline seen in recent sessions.
BTC/USD 2 Hour Chart
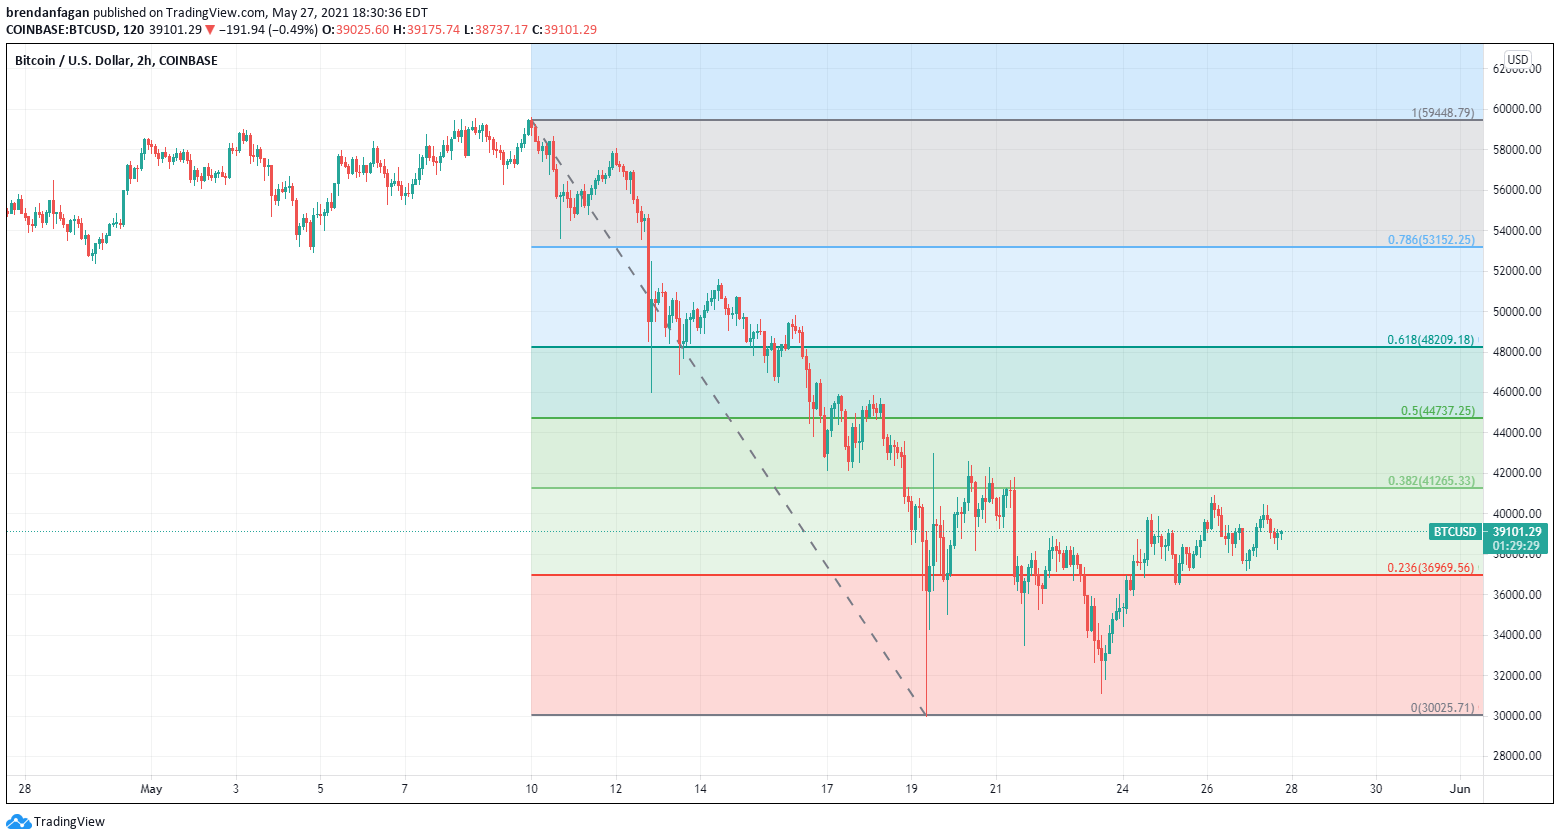
Chart created with TradingView
Investors will also have to keep an eye on any additional scrutiny emanating out of Beijing towards mining practices across mainland China. Officials have clamped down on mining efforts recently with harsh penalties for those involved in the mining of digital currencies. Additional crackdowns in China will pose a threat to any positive momentum in Bitcoin, as the country accounts for nearly 65% of global mining. Beijing’s distaste for digital currencies is not new, as China banned local crypto exchanges back in 2017. Any developments of further crackdowns on mining practices represent significant downside risk(s) to the crypto space, and is certainly something to follow in the near-term.
--- Written by Brendan Fagan, Intern for DailyFX
To contact Brendan, use the comments section below or @BrendanFaganFX on Twitter


