The media and activists, among them a number of “Climate scientists”, have been declaring that Greenland ice melt has been accelerating.
Today the German Klimaschau climate news video reports, however, that this has not been the case over the recent years. All the recent talk about accelerating Greenland ice loss over the past years is false.
SMB on the rise
First a plot of Greenland’s surface mass balance SMB (blue curve below) shows that snow accumulation has occurred faster than snow and ice have melted over the past 35 years:
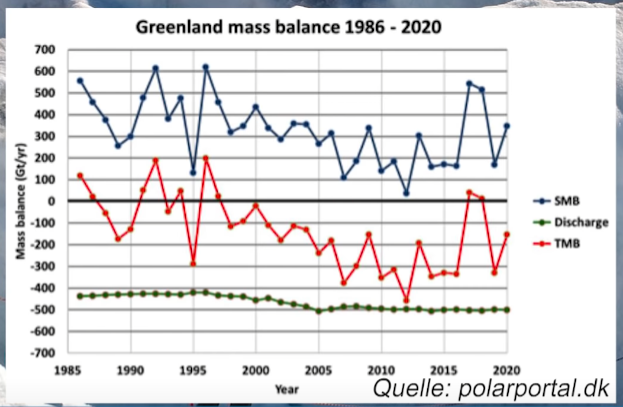
Chart: cropped from Klimaschau here.
Though the annual SMB values declined from 1985 to 2012, the trend has rebounded since.
Loss through coastal discharge steady over the past 15 years
Another factor that plays a role in Greenland’s total ice mass is the amount of ice at the coast that breaks off into the ocean (green curve = Discharge). This factor ultimately decides whether Greenland’s total ice mass is growing or shrinking. Currently at the coasts Greenland is losing close to 500 gigatons annually.
But the coastal ice discharge over the past 15 years has been stable.
Strong deceleration in total mass balance (TMB)
Next we consider both the SMB and the Discharge together. Here we see that Greenland’s total mass balance TMB (red curve) is negative, meaning a net ice loss in total, but has been decelerating since 2012.
In 2017, total ice mass in fact gained a bit.
If we use a 10-year smoothing, we get the following:
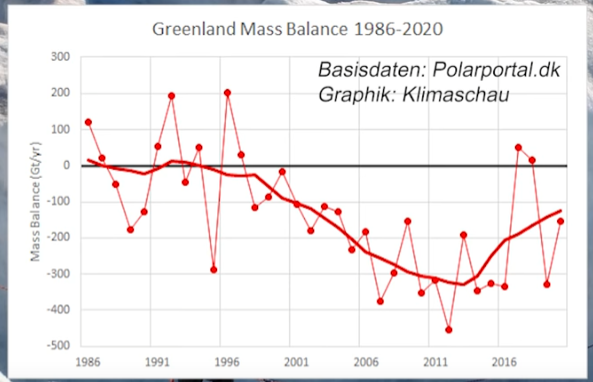
Chart: cropped from Klimaschau here.
Clearly Greenland is not melting faster and faster like the media bedwetters like to have their audiences believe. Ice lost has been slowing down substantially for about a decade now.
Greenland cooling since 2005
One reason for this unexpected trend is likely cooling taking hold, as data from 5 stations show cooling since 2005, according to Kobashi et al 2017:

Obviously the opposite of what the media and alarmists are claiming is in fact happening in Greenland. Where will the climate ambulance chasers go next?


I’ve followed all the DMI charts for Greenland and the Arctic for a few years now. The Greenland SMB has been a particular interest. I’ve never been convinced by the story that Greenland is losing ice mass. Not being an expert at finding data it’s been hard to correlate the gain/loss chart in Gt/day with a melt extent chart in %age. Do Glaciers than calve to the sea count as mass or are they already lost.
It seems to be deliberably obtuse so that it difficult for a lay person to decipher. Having something like this post helps clarify the situation
There are a couple warmist tricks buried in here, so we have to be careful (particularly with the first two of the three plots) – as it’s the old “technically accurate but actually very misleading” repackaging of very little to make it seem scary.
The first is what happens when you plot data for teeny-tiny changes in what is, underneath, a MUCH larger number – plotting the changes against zero (on the y-axis) rather than against the much larger number. The plots show changes in the Greenland ice mass of hundreds of gigatons; however, from three or four years back when this topic came up, checking the notes I had scrawled back then and stuffed in a desk drawer, the total mass of the Greenland ice sheet is 2.4E+15 tons. If you plot the data in those two plots not against zero but against 2.4E+15, they are barely visible (if even that).
The second is the use of Big Scary Numbers (aka “B.S. Numbers”) that are technically accurate but are only scary because they are made to sound scary (e.g., a claimed “0.02% change in the Earth’s thermal budget” obviously doesn’t sound very scary… whereas converting that into “400,000 Hiroshima bombs a day” does – even though it’s the same thing). As per the last paragraph, the loss of 300 gigatons of ice mass a year sounds scary; however, when compared with the total ice mass of 2.4E+15 tons, that amounts to an annual loss (300 gigatons divided by 2.4E+15 tons) of 0.00013 – that is, 0.013%. That’s trivial, and given the total mass, you wonder how that small a change can even be measured accurately. (See prior paragraph about not being able to see these changes in a proper graph.)
FWIW, from the above, if the Greenland ice sheet were to lose 300 gigatons of ice a year, it would disappear in… 8000 years.
Once again, the warmists are trying to take changes that are trivial (and perhaps even unmeasurable to the level claimed) and deceptively turn them into something scary.
Greenland’s ice mass is roughly 290,000 cubic km. This converts to roughly 290,000 Gigatonnes.
The reported changes are a couple of hundred gigatonnes. This brings me to my questions:
– (why) should we worry about a change that is smaller than 0.1% per year? Wouldn’t that be within the bandwidth of natural variation?
– Are we really able to measure a change with this kind of accuracy?
See my comment above.
Basically, “0.013%” doesn’t sound scary (because it isn’t). But “gigatons” sounds REALLY REALLY SUPER SCARY – because, you know, “giga” means REALLY REALLY SUPER BIG.
I’m not sure folks understand the graphs. They are the year-by-year CHANGE in ice volume. To understand what’s happening, you need to look at the cumulative sum of them. So the ice mass is not increasing in recent years. The loss is just decreasing.
Second, the total ice mass of the Greenland ice sheet is on the order of three MILLION gigatonnes. Thus, a loss of 3 THOUSAND gigatonnes is a tenth of one percent.
Not sure if this website will display graphs, if not just click on it to see the difference.
w.
https://wattsupwiththat.com/wp-content/uploads/2021/03/greenland-ice-loss-volume-loss.png
http://polarportal.dk/groenland/iskappens-overflade/
Runoff is reported from a discharge.
It has been normal the last years-and the trend is down.
It was alarming 2010.
[…] P. Gosselin, March 10, 2021 in […]
[…] Danish Institute Data: Greenland Ice Melt Has Slowed Down Significantly Over Past Decade […]