- Gold price attempts to recover as the US yields slide slightly.
- Risk-off sentiment stemming from Evergrande, China’s energy crisis, and debt ceiling debates may support the precious metal.
- Stronger Greenback amid Fed’s tapering may limit the gains in gold.
Gold price makes a small attempt to rebound from a seven-week low, reaching $1,728 again as buyers attempt to retest the $1,750 mark. As global stocks continue to slide, US Treasury bond yields fall along the entire curve, supporting gold prices. However, debt ceiling debates, energy shortages in China, and impending payments from offshore Evergrande have negatively affected investor sentiment.
–Are you interested to learn more about day trading brokers? Check our detailed guide-
Early Fed tapering, rising inflation, and price increases contributed to rising interest rates, among other factors contributing to the market’s rise. However, the gold price fell as more stable returns put downward pressure on the non-yielding metal. The focus is now shifting to Fed chairman Jerome Powell’s speech to find fresh impetus.
Investors assessed the prospect of tapering in Federal Reserve asset purchases in November and a subsequent rate hike. As a result, the US dollar rose to its highest level in 10 months. Recently, the yield on the 10-year government bond reached a three-month high of 1.5530%.
As a result of the Fed’s tightening last week, which took time to take effect, the Fed bolstered market sentiment with an earlier rate cut than expected. James Bullard, who was very bellicose in the most recent trade, reiterates Janet Yellen’s prediction that inflation will approach 4% by 2021.
Though the talk of tightening has eliminated some discomfort from the QE signaling channel, recent rate hikes likely reflect the effects of stocks affecting the precious metal.
The stagflation narrative is gaining market share as participants anticipate a period of high inflation and slower growth, but this has not yet sparked additional interest in gold.
Gold price technical analysis: Buying climax
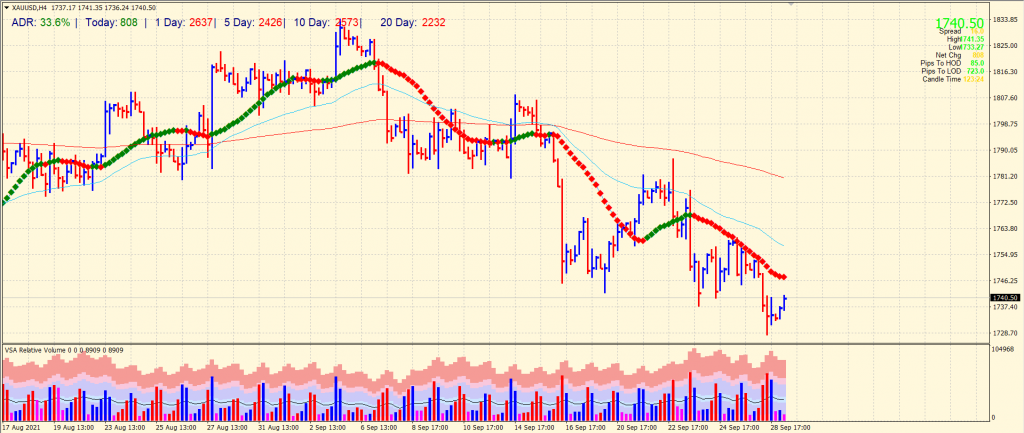
The gold price saw three consecutive down bars with ultra-high volume last day. However, the third bar closed off the highs with the highest relative volume. It indicates a ‘buying climax’ pattern that may signal a bullish reversal here. However, the price is still well below the 20-period SMA on the 4-hour chart. So, the buyers must overcome this hurdle to intensify bullish reversal.
–Are you interested to learn more about forex bonuses? Check our detailed guide-
On the flip side, recent swing lows at $1,728 may provide interim support ahead of August swing lows at $1,717, followed by $1,678.
Looking to trade forex now? Invest at eToro!
67% of retail investor accounts lose money when trading CFDs with this provider. You should consider whether you can afford to take the high risk of losing your money.
