
Economics of Grid-Tied Solar Photovoltaic Systems Coupled to Heat Pumps: The Case of Northern Climates of the U.S. and Canada


1
Department of Material Science & Engineering, Michigan Technological University, Houghton, MI 49931, USA
2
Department of Electrical & Computer Engineering, Michigan Technological University, Houghton, MI 49931, USA
3
School of Electrical Engineering, Aalto University, FI-00076 Espoo, Finland
4
Department of Energy Technology, KTH Royal Institute of Technology, SE-100 44 Stockholm, Sweden
*
Author to whom correspondence should be addressed.
Energies 2021, 14(4), 834; https://doi.org/10.3390/en14040834
Submission received: 15 January 2021
/
Revised: 29 January 2021
/
Accepted: 1 February 2021
/
Published: 5 February 2021
(This article belongs to the Section A: Sustainable Energy)
Abstract
:Solar photovoltaic (PV) technology is now a profitable method to decarbonize the grid, but if catastrophic climate change is to be avoided, emissions from transportation and heating must also decarbonize. One approach to renewable heating is leveraging improvements in PV with heat pumps (HPs). To determine the potential for PV+HP systems in northern areas of North America, this study performs numerical simulations and economic analysis using the same loads and climate, but with local electricity and natural gas rates for Sault Ste. Marie, in both Canada and U.S. Ground-mounted, fixed-tilt, grid-tied PV systems are sized to match 100% of electric loads considering cases both with and without air source HPs for residences with natural gas-based heating. For the first time the results show North American residents can profitably install residential PV+HP systems, earning up to 1.9% return in the U.S. and 2.7% in Canada, to provide for all of their electric and heating needs. Returns on PV-only systems are higher, up to 4.3%; however, the PV capacities are less than half. These results suggest northern homeowners have a clear and simple method to reduce their greenhouse gas emissions by making an investment that offers a higher internal rate of return than savings accounts, CDs and GICs in both countries. Residential PV and solar-powered heat pumps can be considered 25-year investments in financial security and environmental sustainability.

1. Introduction
Solar photovoltaic (PV) technology costs have plummeted [1,2,3] due to a consistent and aggressive industrial learning curve [4,5,6]. PV prices are expected to continue to decrease another 60% in the short term [7]. Already at scales from residential to industrial, the levelized cost of electricity (LCOE) is lower than the net metered cost of grid electricity [8,9,10] and the value of solar (VOS) is even greater than net metering rates in the U.S. [11]. Simultaneously the PV technical community continues to drive improved performance [12] with black silicon [13,14] and bifacial PV modules [15,16] that will reduce solar electricity further [17]. Due to these trends, PV technology is the fastest growing electricity technology [18,19]. This is fortunate because PV has an excellent ecological balance sheet [20] and an established path to a sustainable future [21]. PV, which can be used as a distributed generation (DG) technology [22], also benefits the electrical system with (i) improved reliability [23,24,25], (ii) enhanced power quality [26], and (iii) reduced transmission and distribution losses [27]. These factors are all contributing to widespread deployment of PV and a reduction in the role of fossil fuels, and their concomitant greenhouse gas emissions (GHG) [28]. GHG emissions from electricity generation only account for about 1/3 of all emissions [29], and if catastrophic climate change is to be avoided [30], emissions from transportation and heating must also transition to renewable energy sources. One method to transition to renewable heating is with solar-assisted heat pumps [31,32,33].
There are a considerable number of configurations and approaches to solar-assisted heat pumps considering both solar thermal and PV technologies [34,35]. It is easier to scale PV-powered heat pumps given that the systems can be installed and operated independently. It is also possible to install larger PV systems than the heating system requires, unlike solar thermal systems. Oversized PV systems thus provide more economic value to the building than solar thermal, because this additional solar electricity can be used to power a heat pump, appliances, lighting, and anything not used in the building can be sold to the grid, which has been demonstrated in Sweden [36]. Heat pumps can also be used to regulate PV generation both in the building and the grid using demand side management and storage [37,38] or the thermal mass of the building [39]. Heat pumps can also enable higher penetration of solar electricity in the power system, particularly when they are reversed for cooling [40].
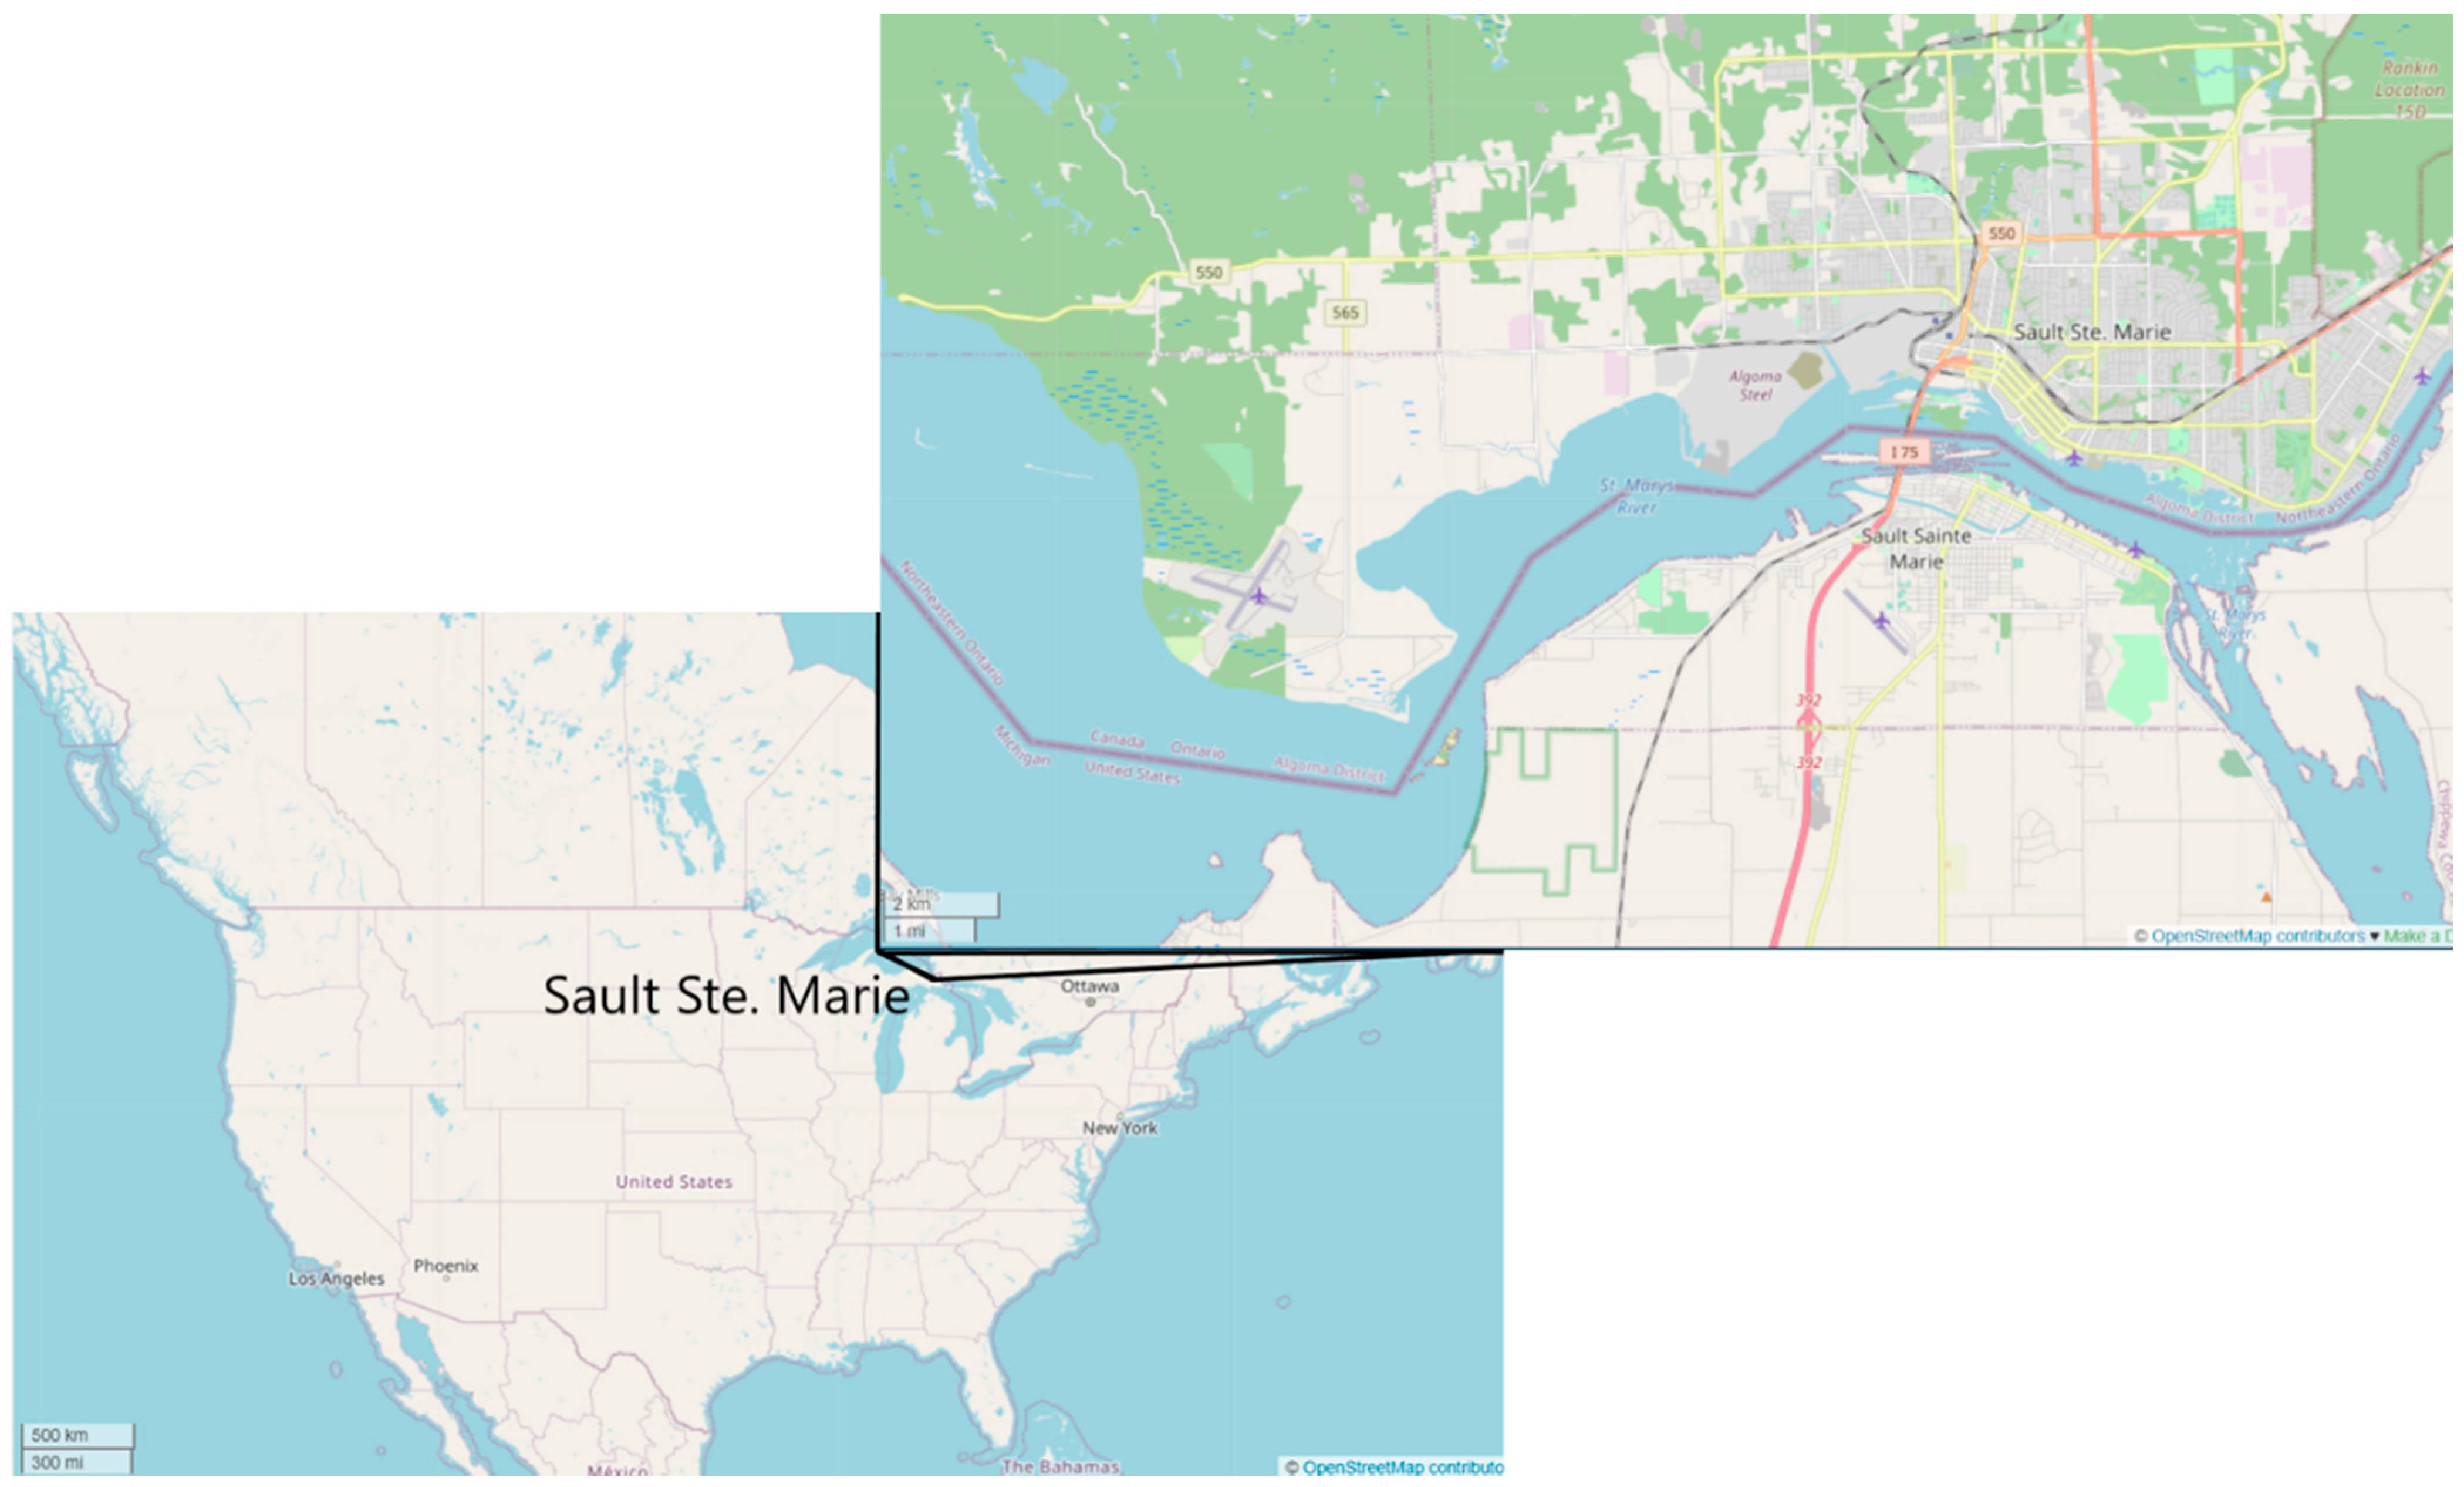
In North America, distributed generation with PV is becoming widespread and offers to the potential to accelerate heat pump adoption. Historic economics of both solar and heat pumps demanded major policy interventions to make such systems financially possible. In this study, the economic viability of PV-powered heat pump is probed with no additional policy interventions using numerical simulations of commercial systems available now. To remain conservative all simulations assume replacing natural gas furnace, which is the current most widespread and largely perceived to be the lowest cost form of heating in the region. Economic analysis is performed for the following scenarios using the same load and local electricity and natural gas for Sault Ste. Marie, which straddles the Canadian and U.S. border (shown in Figure 1): (i) ground mount fixed tilt PV-grid tied to match 100% of electric load in Sault Ste. Marie, MI; (ii) ground mount fixed tilt PV-grid tied to match 100% of electric load in Sault Ste. Marie, Ontario; (iii) air source heat pump to meet all thermal load with grid electricity in Sault Ste. Marie, MI; (iv) air source heat pump to meet all thermal load with grid electricity in Sault Ste. Marie, Ontario; (v) ground mount fixed tilt PV-grid tied to match 100% of electric load and electrified thermal load assuming air source heat pump in Sault Ste. Marie, MI; and (vi) ground mount fixed tilt PV-grid tied to match 100% of electric load and electrified thermal load assuming air source heat pump in Sault Ste. Marie, Ontario. The results are compared for both countries to probe the impact of national policy on the economic viability for not only electrification of the heating sectors in cold climates but also the solar-powered electrification of heating. Policy recommendations are discussed to accelerate economically favorable carbon emission reductions.
2. Materials and Methods
A systems diagram of the building energy system is shown in Figure 2, with electricity flows in green and thermal flows in red/blue. It is a typical grid connected PV system, where PV generation (Epv) is used first to service loads in the building (Eapp, Ehp) and excess is sold to the grid (Egrid,out). During times of no PV generation, building loads are serviced with grid electricity (Egrid,in). As the systems are net-zero energy, where the annual PV generation matches the annual demand, Egrid,in and Egrid,out are equal and opposite over the year. The configuration shown in Figure 2, which includes the heat pump, specifically maps to systems v/vi. Removing the PV system and relying only on electric grid supply represents systems iii/iv. Systems i/ii keep the PV but replacing the heat pump with gas heating supply, leading to smaller PV capacities to maintain net-zero energy.
2.1. Electric Rates
Table 1 summarizes the electric rates and natural gas rates for the utilities in Sault Ste. Marie, Ontario and Michigan. For the Public Utility Commission (PUC), all rates taken from the 11/2019 rate sheet, as 2020 rates were temporarily altered due to the pandemic. For PUC Time of Use Rate (TOU); Off-peak 7:00 pm–7:00 am plus weekends and holidays; Mid-peak 11:00 am–5:00 pm; On-peak 7:00 am–11:00 am; and 5:00 pm–7:00 pm.
All rates are converted to US dollars with an exchange rate of 1 USD to 1.325 CAD [45].
2.2. Thermal Load Conversion to Heat Pump
The average Michigan residential annual energy consumption is 123 million BTUs (1.3 × 10¹¹ J) [46]. Space heating makes up 55% of this amount, meaning the average Michigan resident uses 67.65 million BTUs (7.1 × 10¹⁰ J) for space heating [46]. Using the ten-year average monthly heating degree data for the eastern UP, the monthly space heating demand is approximated [47]. Then, the monthly fuel cost for a natural gas furnace of typical new modern high efficiency [48] is calculated. It should be noted that this is a conservative estimate for most home owners with 95% being on the high end, AFUE ratings still overpredicts real-world performance and the population in the region being economically depressed are likely to favor 80% efficiency non-condensing furnaces because of their lower capital costs [49]. For a regionally appropriate heat pump efficiency, the method determined by Fairey et al. (2004) [50] for calculating a local HSPF using the ASHRAE 1% design temperature for Sault Ste. Marie [51] and a nameplate HSPF of 10 was used. Thus, the required electricity demand (Ehp in kWhs per month) given the required thermal demand (BTUs per month) was calculated. This additional electric load is then added and normalized to U.S. National Renewable Energy Lab’s (NREL) load profile for Sault Ste. Marie, MI (Eapp) to determine monthly and annual cost for the three utility rate structures [52]. Finally, from personal communication with local pluming contractors, the cost to replace a natural gas furnace with air source heat pump for a typical 2000 square foot (186 m2) home was estimated to be USD$6000–7000.
2.3. Heat Pump Costs
The costs to electrify heating with a heat pump are summarized in Table 2. In Table 2, the weighted unit price for PUC Tiered is based on the proportion of electricity in each price bin for each month. Weighted unit for Union is the proportion gas in each price bin for each month. Cloverland and DTE are flat unit prices. Cost per year assumes 67.65 million British Thermal Units (BTU) (7.1 × 10¹⁰ J) consumed in space heating in a year. BTU is the standard unit of thermal energy used in the U.S. Heating load by month determined by two-year average of heating degree days for Sault Ste. Marie. Cost per year for heat pumps does not include monthly customer charge as residents would be paying for this already. Cost per year for furnaces does include monthly customer charge as replacing a furnace with a heat pump could mean discontinuing natural gas service. The heating seasonal performance factor (HSPF) is used as a measure of the efficiency of air source heat pumps and is defined as the ratio of heat output (measured in BTUs as is standard in the industry in North America) over the heating season to electricity used (measured in watt-hours). In parenthesis with HSPF is the same metric considering heat output and electricity used both in kilowatt-hours. For the furnaces, the thermal efficiency used was the annual fuel utilization efficiency (AFUE) that represents the actual, season-long, average efficiency of the furnace and is the ratio of useful energy output to energy input.
2.4. Numerical Simulations
PV generation and economic analysis was conducted with the National Renewable Energy Lab’s open source System Advisor Model (SAM) software [53] using the input parameters found in Table 3. The region is relatively flat and all systems were assumed to be on level ground and unshaded. All systems were ground mounted, fixed tilt, and grid tied to eliminate complexities of roof suitability and nuances. Similarly, all heat pumps (HP) were air source so that local conditions would not play a factor in the installation of a ground source heat pump. The six systems simulated include:
- ground mount fixed tilt PV-grid tied sized to match 100% of electric load in Sault Ste. Marie, MI;
- ground mount fixed tilt PV-grid tied sized to match 100% of electric load in Sault Ste. Marie, Ontario;
- air source heat pump to meet all thermal load with grid electricity in Sault Ste. Marie, MI;
- air source heat pump to meet all thermal load with grid electricity in Sault Ste. Marie, Ontario;
- ground mount fixed tilt PV-grid tied to match 100% of electric load and electrified thermal load assuming air source heat pump in Sault Ste. Marie, MI; and
- ground mount fixed tilt PV-grid tied to match 100% of electric load and electrified thermal load assuming air source heat pump in Sault Ste. Marie, Ontario.
For each PV system the total cost is calculated. Then, economics for a home owner in all six scenarios are determined for systems (1) without PV, (2) those with PV, (3) homes without PV and gas without a heat pump (HP), (4) homes with combined utilities with PV and without a heat pump, (5) homes with combined utilities without PV and without a heat pump, and finally (6) homes with combined utilities with PV and a heat pump. The solar resources are acquired from the National Solar Radiation Database (NSRDB) [54].
Finally, the net savings, year one return on investment (ROI), simple payback calculated in years, and the internal rate of return (IRR) are determined. Simple payback for the PV+HP is calculated in comparison to the no PV and no HP case, based on the annual value of the PV generation minus the cost difference between heating with gas and a HP.
3. Results
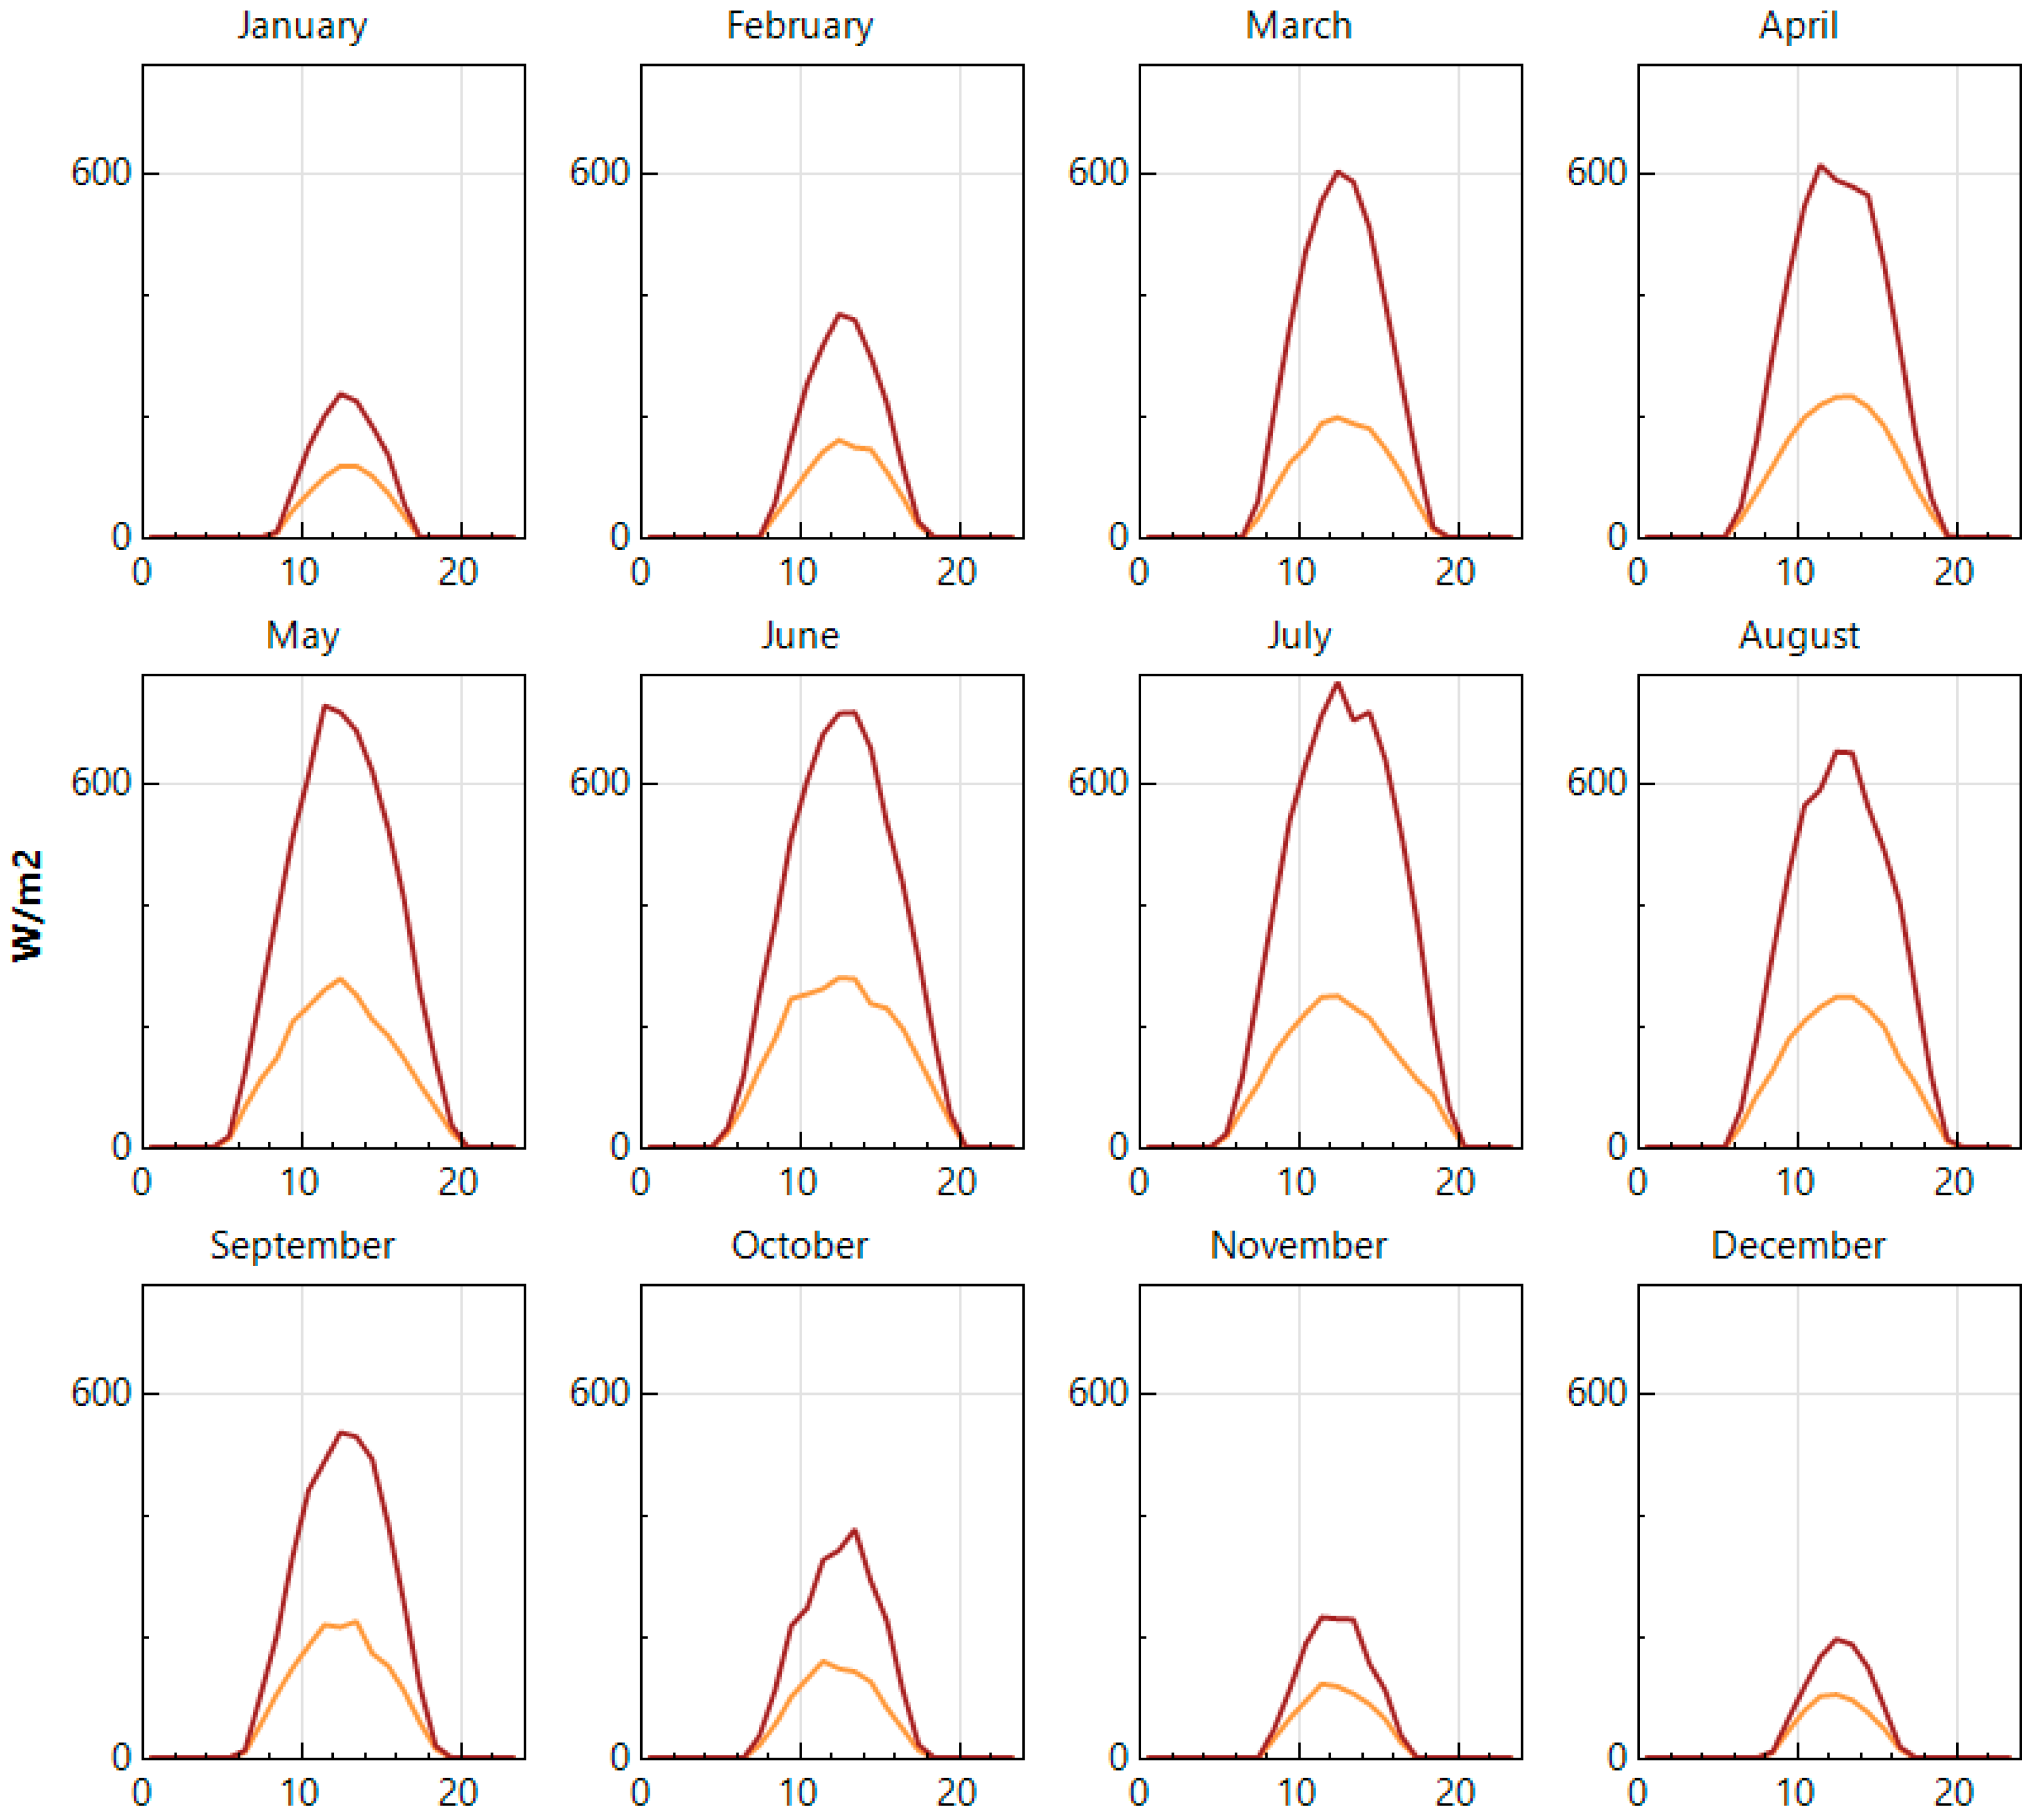
The solar resource for the regions is shown in Figure 3 as a function of the time of day for a representative day for each month throughout the year.
As can be seen in Figure 3, the available irradiance during the heating months is modest and from November through February has a substantial fraction of diffuse irradiance due to heavy cloud cover. In addition, it should be pointed out that much of this reduced solar energy is not collected because of snow losses. Thus, to match the load with these solar fluxes involves large PV systems. On both sides of the border, the PV systems for are sized at 6.9 kW without a HP, with the addition of a HP these increase to 20.6 kW. Annually they produce 9130 kWh and 20,611 kWh, respectively.
The total system costs for the different scenarios are shown in Table 4. As can be seen in Table 4, the PV systems are slightly more expensive in Ontario than Michigan coming in at $3.10/W and $3.30/W, respectively. This discrepancy is due in part to taxes and grid interconnection costs being roughly 10 cents per W higher in Ontario. With the addition of a HP system to electrify the heating both PV systems more than double in cost to be $43,854 in the U.S. and $49,029 in Canada. These costs represent a substantial investment for the average consumer as in the U.S. the average family has $40,000 in savings, across savings accounts, checking accounts, money market accounts, call deposit accounts, and prepaid cards [59], and the Canadian savings rate is even lower [60]. Interconnection fees in Canada are calculated on a case by case basis [61]. Per email correspondence with Electrical Engineering Tech Matthew Grigg with PUC, micro-generator Offer to Connect packages range from $1000–1500 and over 10 kW $5000–10,000 CAD.
The impact of the U.S. Federal income tax credit on system costs is shown in Table 5. Base estimates are for ground mounted fixed tilt PV arrays sized to Sault Saint Marie load profile. Costs assume a run of no more than 30 m and generation assumes a 100% solar window with 11.44% system losses. As can be seen in Table 5, as expected the ITC in the U.S. makes a substantial difference in the capital costs of the systems saving American consumers roughly $10,000 in the HP case.
Finally, the economics for the six systems are summarized in Table 6. Base estimates are for ground mounted fixed tilt PV arrays sized to Sault Saint Marie load profile. Costs assume a run of no more than 30, and generation assumes a 100% solar window with 11.44% system losses. PV generation and economic analysis are conducted with NREL’s System Advisor Model software [57]. Currently, if PUC customers install PV they must be on the tiered rate. The PUC TOU rate is not currently offered to customers with a PV system.
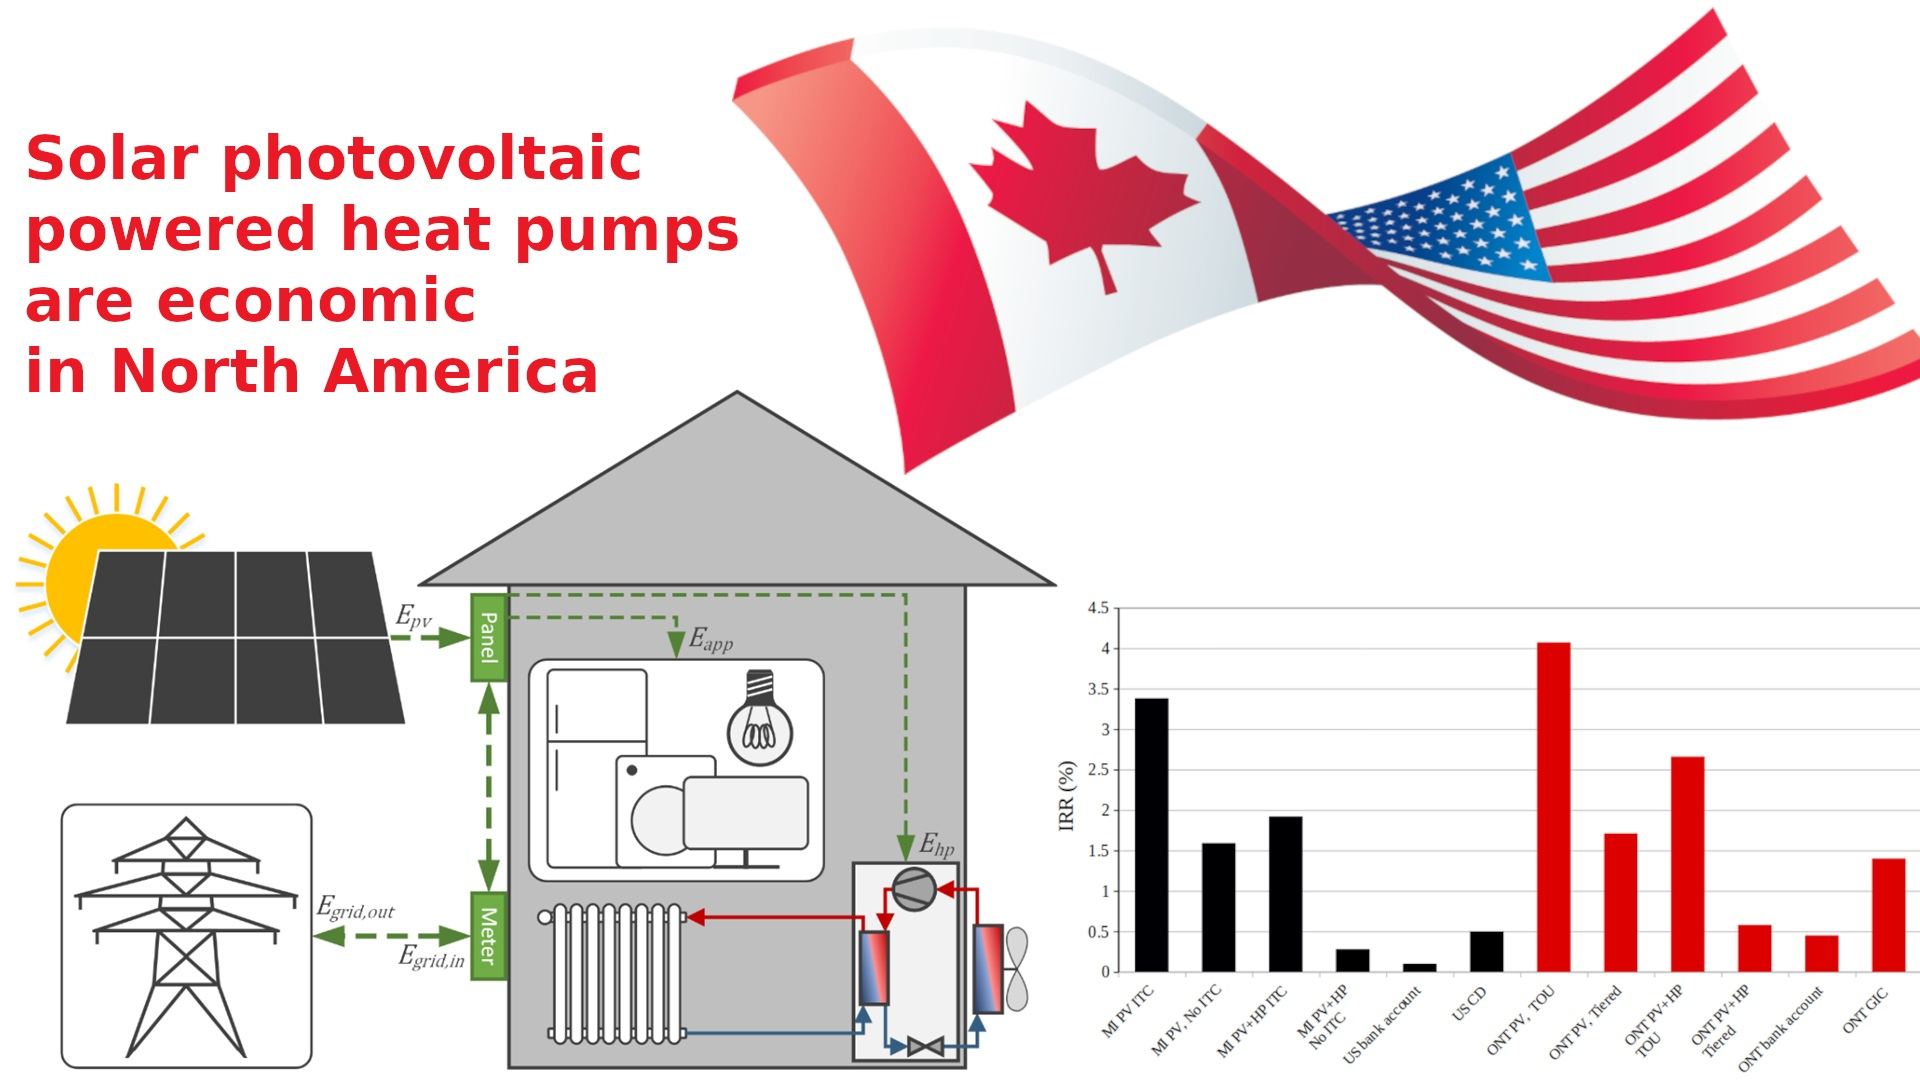
Table 6 shows that all of the systems have a simple payback time shorter than the lifetime under warranty that indicates all cases provide a positive return. This is verified with the net savings and year one return on investments that are all in the single digits and range from 2.9% to 5.1%. The most appropriate economic indicator is the internal rate of return (IRR). For the PV+HP systems in the U.S. the systems provide an IRR of 1.9% and in Canada they provide 0.6%. As can be more easily seen in Figure 4, the IRR is higher for the PV alone, but the PV+HP systems provide a positive IRR and reduce the risk of natural gas price escalations in the future. For PV systems alone, the inclusion of the ITC in the U.S. increases the IRR by more than 1.7% and decreases the payback time by 3.8 years. In Ontario electricity savings are substantially enhanced with TOU pricing instead of the tiered rates. As TOU pricing will encourage load shifting and lower costs for the grid [63] and as shown here substantially increase the potential return for installing solar-powered HPs, thus radically reducing GHG emissions for residential heating in Ontario. The paybacks are generally shorter and IRRs higher for Canadians than Americans living in Sault Saint Marie. These IRRs are compared to benchmark bank account interest rates and certificate of deposit (CD) rates in the U.S. [64] and Guaranteed Investment Certificate (GIC) rates in Canada [65] that are available in banks in Sault Saint Marie in both countries. Overall, all PV and HP cases provide better IRR in the U.S. and Canada than savings accounts (even high interest savings) at the local benchmark banks. CDs and GICs can provide a higher return than the worst cases of PV+HP in both countries. The ITC improves the economics considerably, but the TOU pricing in Ontario provides the best outcome. This indicates a policy priority of encouraging TOU pricing. Future work is needed to determine the impact of such pricing in the U.S. on these systems.
With the addition of the HP, the overall net savings increase for all systems and rate structures in both countries were comparable to the PV alone case. The simple payback times increase and the IRRs drop. It should be pointed out that in the HP systems powered with PV in Canada under the TOU pricing, the electric bill would go up, but the natural gas bill being eliminated still provides net savings and in fact a better IRR than the tiered rate. Currently, if PUC customers install PV they must be on the tiered rate. The PUC TOU rate is not currently offered to customers with a PV system and is an area that appears to be the most promising means of better matching the costs of the systems with the cost consumers pay. Previous research has shown customers will shift their use, reducing costs for the utility [66]. Clearly, small policy changes in Ontario that would encourage PV and the electrification of heating with PV+HP systems would be to adopt policy for a TOU rate. The additional investments needed to push the IRRs into the low single digits, but as can be seen in Table 6, all systems provide positive ROI and as Figure 4 shows economically attractive IRRs over the lifetime of the project. In the U.S. inclusion of the ITC makes both PV and PV+HP more profitable than all offerings at the bench mark bank, while in Canada the same is true for TOU pricing. Overall, all projects are profitable for the homeowners.
4. Discussion
This study has shown that under current economic conditions, residents of northern Michigan and Southern Ontario can profitably install solar PV to provide all of their electric and heating needs. This is consistent with earlier research on PV in northern Michigan, which found profitability for small PV systems [67]. Given that the PV systems are sized to cover 100% of the total loads, this would make the buildings net-zero energy and provide a simple method to reduce their greenhouse gas emissions. This is particularly critical with heating, which is dominated by fossil fuels [68]. While the payback times are long, and the returns modest, they are higher than what average consumers can earn on savings accounts, certificates of deposit, or bonds as shown in Figure 4. This is noteworthy given that a PV system can be considered a stable, long-term investment, hedging against inflation and price rises in electricity and gas. There are risks associated with such systems, but they are either minor and covered by existing insurance (e.g., theft or destruction from an accident), warranties, or are extremely low probability (e.g., government law changing and not grandfathering in rules the system was deployed under). Another risk that would be considered low probability is a radical decrease in fossil fuel prices. The opposite is indeed far more likely. For example, in Canada, the probability that gas prices will increase is substantial given the recent announcement by the Prime Minster Justin Trudeau that Canada would achieve net-zero by 2050 using several approaches, including continued price increases on pollution [69]. There is a high possibility that similar policies to reduce GHG emissions in the U.S. will also increase natural gas prices. All future gas price increases render the economic analysis in this study conservative. The ROI and IRR values should thus be viewed as minimums for investments in PV+HP systems in these regions. This analysis assumed 25 years, but it is well known that PV systems outlast this value and with good usage, proper maintenance, and suitable installation conditions a minimum lifespan of 25 years can also be expected for the HP [70]. Even for those not expecting to stay in their home for 25 years the investment is still sound. Past research has shown that PV systems can increase home values more than the cost of the PV system [71], so even those considering moving can consider these long-term green investments.
This study has several limitations. First, although for the U.S. the Upper Peninsula in MI represents one of the worst locations for solar flux, it also has high utility rates, so generalizing the results to all of the U.S. cannot be done. Future work is needed in this area. Generally speaking, the cases presented here are considered conservative in both cost and performance even when excluding natural gas cost escalation. To keep the analysis as transparent as possible, no electricity price escalation was considered, which is an extremely conservative assumption for PV cost analysis. In addition, installed PV costs decline at approximately 5% per year [2,3], and the degradation rate applied is taken from a southern climate even though colder climates reduce degradation [72,73]. Thus, economics on the PV-side are also minimum IRRs. Comparing these IRRs to PV-only systems tend to be lower (e.g., in the Canadian case, Sow et al. found, after 2016, the IRRs were high single digit to double digit returns for PV in most major cities) [74]. It is well established that those in Michigan would all profit from PV-only systems [67]. It should be pointed out, however, that in this study the PV systems needed to provide for both the electric and thermal loads are much larger than those in previous studies and they thus have a much larger potential for GHG emissions reductions. Estimates were likewise conservative on the HP side of the analysis. For example, changing the estimate of fuel efficiency for natural gas furnaces to 85% adds 0.2% to IRR on HP systems. While many local factors will influence heat pump efficiency, cold-climate performance has notably improved in recent years [75,76]. Furthermore, given that winters are expected to continue warming due to climate change [77,78,79,80,81], seasonal heat pump efficiency will increase and the total need for heating will decrease, suggesting that the PV systems here are oversized for the lifetime of use and thus more expensive than necessary. In addition, the snow losses historically measured for PV systems may also be reduced. Future work is needed to probe the optimal HP size given the potential for short term small investments in electric space heaters to cover the progressively more infrequent extreme cold days. The analysis here also represents a fuel-switching scenario, where the choice is to continue using existing natural gas equipment or switch to a heat pump. If the capital costs for a new gas furnace were included in the baseline comparison, the economics would be better still.
It is necessary to note that the net metering policy applied in all cases is a key driver in the economic success of these systems as they were modeled here. A critique of being too generous against net metering is that it does not take into account temporal differences between generation and consumption [82,83]. For residential PV systems, more generation is usually fed into the grid than self-consumed [84], and this effect is heightened with heat pumps in northern climates; for example, in this case where 67% of generation occurs in the sunniest six months and 79% of heat demand occurs in the darkest six months (October through March). On the other hand, net metering can be critiqued as too stingy, as the VOS is greater than net metering rates in the U.S. [11] and more than likely higher in Canada as well (although future work is needed to verify this).
In the configurations presented here, the homeowner is paying 75–90% less to the utility for electricity while still relying on a grid connection. The so-called “utility death spiral”, where distributed PV leads to higher prices which leads to more distributed PV, is a function of maintaining a volumetric pricing model ($/kWh) for distribution even though costs are largely fixed and/or a function of capacity ($/kW) [85,86]. A switch to greater fixed prices or capacity tariffs has been shown to be detrimental to prosumer PV economics [87] even though cross-subsidization is negligible at low penetration rates [88]. The problem becomes more pronounced at higher penetrations [88,89] and can also apply to high capacity appliances (like air conditioning or heat pumps) [90]. Utilities that increase fixed rates, however, risk encouraging grid defection. For example, studies have shown that both home owners [49] and small business owners [91] in the U.P. would currently profit from grid defection using hybrid systems comprising PV, cogen or generators, and a modest battery bank [92,93]. Likewise, natural gas could be used more efficiently than a furnace using a heat-driven heat pump [94] or an engine-driven compressor [95], potentially improving the economics for natural gas heating. The limitation is that these hybrid systems lock-in natural gas to provide heating and some electricity and can only provide marginal GHG reductions, so they are inferior technical solutions from a climate perspective than the PV+HP systems investigated here. This is not to say there are not integration solutions—community energy systems with high penetration rates of heat pumps can economically integrate high levels of PV using a combination of demand response, storage, and curtailment [96,97]. Realizing these solutions require novel policies and business models, in concert, developed around distributed generation as opposed to the legacy model of centralized generation and one-way power flow [98]. In the immediate term, TOU pricing, smart demand controls, and storage all assist PV heat pumps to scale and integrate with the grid [40,99,100,101]. To optimize the system, considerable future work is needed to improve both thermal and electrical efficiency while also pushing electric demand to both the middle of the day (e.g., with smart appliances, heat pump controls, and existing thermal storage) and when possible to the higher solar flux months. Finally, when applying these results to other locations in North America, it should be pointed out that there are significant inconsistencies in interconnection and net metering policies, within states and even within individual companies [102]. Clear and consistent national level policy in both Canada and the U.S. would be expected to speed the transition to PV+HP systems while reducing costs for consumers and GHG emissions.
This paper is an initial investigation into the economic potential for heat pumps in cold North American markets, and more detailed modeling is required for complete techno-economic analysis. In a follow-up study, hourly heat pump loads, self-consumption of PV generation, peak inflow and outflow, and alternative electricity pricing models will be analyzed [103]. These details also enable analysis on the primary energy savings, which are critical given the energy carriers being compared (electricity and heat), and can be further extended into detailed GHG emissions reductions based on various grid portfolios from solar heat pumps. Other heat pump configurations should be investigated as well, such as ground source, which have higher efficiencies and can enable seasonal storage of solar energy [104,105].
Finally, this study has shown that the rhetoric describing the transition to renewable energy as a high cost, such as the Wood Mackenzie analysis claiming the cost of shifting the U.S. power grid to 100 percent renewable energy would be $4.5 trillion [106], is misleading. Previous work has shown the wealthy could profit from large-scale PV deployment in the U.S. [107], and yet referring to the cost of a transition to renewable energy [108] remains the primary means of discourse. Some authors have pointed out that with the reduction in renewable energy technology prices such a conversion could be done with no costs [109] or even for less than it saves [110]. Instead, as this study has shown decarbonizing both the grid and the heating system should be viewed as an investment opportunity for all citizens.
5. Conclusions and Policy Implications
This study has shown that residents of both northern Michigan and Southern Ontario can profitably install residential solar to provide for all of their electric needs. PV systems to meet average loads were 6.9 kW without a HP and more than tripled to 20.6 kW to provide the needed electricity for the HP. Annually, these PV systems would produce 9130 kWh for the PV system alone and 20,611 kWh for the PV system to cover the HP additional load. The costs of PV and HP have been reduced enough that they now positive economic investments that yield a net savings and year one return on investments that are all in the single digits and range from 2.9% to 5.1%. In the current policy regime and current costs, an American installing a PV+HP would enjoy an internal rate of return of 3.4% and in Canada a PV+HP system would earn 0.6%. The IRR is higher for the PV alone, but the PV+HP systems provides not only a positive IRR and reduce the risk of natural gas price escalations in the future, but also eliminate all carbon emissions from heating. The current U.S. ITC has a large impact on the economics of PV systems, where alone the inclusion of the ITC in the U.S. increases the IRR by more than 1.7% and decreases the payback time by 3.8 years. Maintaining this ITC reduces the costs of the PV+HP systems by ten thousand dollars, which is approximately enough to be invested by the average American savings. In Ontario, the PV+HP systems IRR goes from marginally positive to economically attractive when the electricity savings are substantially enhanced with TOU pricing instead of the tiered rates. Converting from tiered to TOU will encourage load shifting that will decrease electric costs as well as PV+HP investing that has the potentially to radically reduce GHG emissions. Thus, policies encouraging TOU pricing would be expected to be both economically and environmentally beneficial as well as accelerate the electrification of the heating system.
The results of this study clearly show that for the first-time consumers can both electrify their heating loads using a heat pump and still profitably power their homes with solar energy in North America. This gives northern homeowners a clear and simple method to reduce their GHG emissions by making an investment that pays for itself over time. The current economics of these systems are not only positive, they are higher than what consumers can earn on their savings accounts and potentially CDs or GICs. It is time to stop emphasizing renewable energy costs, but rather start considering both residential PV and solar-powered heat pumps as 25-year investments in financial security and environmental sustainability.
Author Contributions
Conceptualization, J.M.P.; methodology, N.S. and J.M.P.; software, J.M.P.; validation, N.S. and J.M.P.; formal analysis N.S. and J.M.P.; investigation, N.S. and J.M.P.; resources, J.M.P.; data curation, N.S. and J.M.P.; writing—original draft preparation, N.S. and J.M.P.; writing—review and editing, N.S. and J.M.P.; visualization, J.M.P.; project administration, J.M.P.; funding acquisition, J.M.P. All authors have read and agreed to the published version of the manuscript.
Funding
This research was supported by the Witte Endowment.
Institutional Review Board Statement
Not applicable.
Informed Consent Statement
Not applicable.
Acknowledgments
The authors would like to acknowledge technical support from D. Cramer, helpful conversations with A. Kantamneni.
Conflicts of Interest
The authors declare no conflict of interest.
References
- Feldman, D.; Barbose, G.; Margolis, R.; Wiser, R.; Darghouth, N.; Goodrich, A. Photovoltaic (PV) Pricing Trends: Historical, Recent, and Near-Term Projections; National Renewable Energy Laboratory: Golden, CO, USA, 2012.
- Barbose, G.L.; Darghouth, N.R.; Millstein, D.; La Commare, K.H.; Di Santi, N.; Widiss, R. Tracking the Sun X: The Installed Price of Residential and Non-Residential Photovoltaic Systems in the United States; Lawrence Berkley National Laboratory: Berkley, CA, USA, 2017.
- IEA. Trends in Photovoltaic Applications 2019 (T1-36:2019); IEA: Paris, France, 2019. [Google Scholar]
- Yu, C.F.; van Sark, W.G.J.H.M.; Alsema, E.A. Unraveling the photovoltaic technology learning curve by incorporation of input price changes and scale effects. Renew. Sustain. Energy Rev. 2011, 15, 324–337. [Google Scholar] [CrossRef] [Green Version]
- Hong, S.; Chung, Y.; Woo, C. Scenario analysis for estimating the learning rate of photovoltaic power generation based on learning curve theory in South Korea. Energy 2015, 79, 80–89. [Google Scholar] [CrossRef]
- Mauleón, I. Photovoltaic learning rate estimation: Issues and implications. Renew. Sustain. Energy Rev. 2016, 65, 507–524. [Google Scholar] [CrossRef]
- Reuters. Solar Costs to Fall Further, Powering Global Demand—Irena. 2017. Available online: https://www.reuters.com/article/singapore-energy-solar-idUSL4N1MY2F8 (accessed on 7 April 2020).
- Lai, C.S.; McCulloch, M.D. Levelized cost of electricity for solar photovoltaic and electrical energy storage. Appl. Energy 2017, 190, 191–203. [Google Scholar] [CrossRef]
- Richard, C. New Wind and Solar Cheaper than Existing Coal and Gas 2018. Available online: http://www.windpowermonthly.com/article/1491146?utm_source=website&utm_medium=social (accessed on 7 April 2020).
- Dudley, D. Renewable Energy Will Be Consistently Cheaper Than Fossil Fuels By 2020, Report Claims. Forbes. 2018. Available online: https://www.forbes.com/sites/dominicdudley/2018/01/13/renewable-energy-cost-effective-fossil-fuels-2020/ (accessed on 7 April 2020).
- Hayibo, K.S.; Pearce, J.M. A review of the value of solar methodology with a case study of the US VOS. Renew. Sustain. Energy Rev. 2021, 137, 110599. [Google Scholar] [CrossRef]
- Green, M.A.; Dunlop, E.D.; Hohl-Ebinger, J.; Yoshita, M.; Kopidakis, N.; Hao, X. Solar cell efficiency tables (version 56). Prog. Photovolt. Res. Appl. 2020, 28, 629–638. [Google Scholar] [CrossRef]
- Kroll, M.; Otto, M.; Käsebier, T.; Füchsel, K.; Wehrspohn, R.; Ernst-Bernhard, K.; TÜnnermann, A.; Pertsch, T. Black silicon for solar cell applications. In Photonics for Solar Energy Systems IV, Proceedings of the International Society for Optics and Photonics, Brussels, Belgium, 9–12 December 2012; OSA: Washington, DC, USA, 2012; Volume 8438. [Google Scholar] [CrossRef]
- Modanese, C.; Laine, H.; Pasanen, T.; Savin, H.; Pearce, J. Economic Advantages of Dry-Etched Black Silicon in Passivated Emitter Rear Cell (PERC) Photovoltaic Manufacturing. Energies 2018, 11, 2337. [Google Scholar] [CrossRef] [Green Version]
- Liang, T.S.; Pravettoni, M.; Deline, C.; Stein, J.S.; Kopecek, R.; Singh, J.P.; Luo, W.; Wang, Y.; Aberle, A.G.; Khoo, Y.S. A review of crystalline silicon bifacial photovoltaic performance characterisation and simulation. Energy Environ. Sci. 2019, 12, 116–148. [Google Scholar] [CrossRef]
- Burnham, L.; Riley, D.; Walker, B.; Pearce, J.M. Performance of bifacial photovoltaic modules on a dual-axis tracker in a high-latitude, high-albedo environment. In Proceedings of the 2019 IEEE 46th Photovoltaic Specialists Conference (PVSC), Chicago, IL, USA, 16–21 June 2019; pp. 1320–1327. [Google Scholar]
- Barron, A. Cost reduction in the solar industry. Mater. Today 2015, 18, 2–3. [Google Scholar] [CrossRef] [Green Version]
- Center for Climate and Energy Solutions (CECS). Renewable Energy. 2019. Available online: https://www.c2es.org/content/renewable-energy/ (accessed on 11 November 2020).
- IEA. Snapshot of Global PV Markets 2020Report IEA-PVPS T1-37: 2020. Available online: https://iea-pvps.org/wp-content/uploads/2020/04/IEA_PVPS_Snapshot_2020.pdf (accessed on 11 November 2020).
- Gerbinet, S.; Belboom, S.; Léonard, A. Life Cycle Analysis (LCA) of photovoltaic panels: A review. Renew. Sustain. Energy Rev. 2014, 38, 747–753. [Google Scholar] [CrossRef]
- Pearce, J.M. Photovoltaics—A path to sustainable futures. Futures 2002, 34, 663–674. [Google Scholar] [CrossRef]
- Yuan, G. Improving grid reliability through integration of distributed PV and energy storage. In Proceedings of the 2012 IEEE PES Innovative Smart Grid Technologies (ISGT) (1–2), Washington, DC, USA, 16–20 January 2012. [Google Scholar]
- Koh, L.H.; Peng, W.; Tseng, K.J.; ZhiYong, G. Reliability evaluation of electric power systems with solar photovoltaic & energy storage. In Proceedings of the 2014 International Conference on Probabilistic Methods Applied to Power Systems (PMAPS), Durham, UK, 7–10 July 2014; pp. 1–5. [Google Scholar]
- Banerjee, B.; Islam, S.M. Reliability based optimum location of distributed generation. Int. J. Elec. Power Energy Syst. 2011, 33, 1470–1478. [Google Scholar] [CrossRef]
- Liu, L.; Bao, H.; Liu, H. Siting and sizing of distributed generation based on the minimum transmission losses cost. In Proceedings of the 2011 IEEE Power Engineering and Automation Conference, Wuhan, China, 8–9 September 2011; Volume 3, pp. 22–25. [Google Scholar] [CrossRef]
- Barker, P.P.; De Mello, R.W. Determining the impact of distributed generation on power systems. I. Radial distribution systems. In Proceedings of the 2000 Power Engineering Society Summer Meeting (Cat. No.00CH37134), Seattle, WA, USA, 16–20 July 2000; Volume 3, pp. 1645–1656. [Google Scholar] [CrossRef]
- Saad, N.M.; Sujod, M.Z.; Lee, H.M.; Abas, M.F.; Jadin, M.S.; Ishak, M.R.; Abdullah, N.R.H. Impacts of Photovoltaic Distributed Generation Location and Size on Distribution Power System Network. IJPEDS 2018, 9, 905. [Google Scholar] [CrossRef]
- Jäger-Waldau, A.; Kougias, I.; Taylor, N.; Thiel, C. How photovoltaics can contribute to GHG emission reductions of 55% in the EU by 2030. Renew. Sustain. Energy Reviron. 2020, 126, 109836. [Google Scholar] [CrossRef]
- Hockstad, L.; Hanel, L. Inventory of US greenhouse gas emissions and sinks. In Environmental System Science Data Infrastructure for a Virtual Ecosystem; US Department of Energy: Washington, DC, USA, 2018. [Google Scholar]
- Weitzman, M.L. GHG targets as insurance against catastrophic climate damages. J. Public Econ. Theory 2012, 14, 221–244. [Google Scholar] [CrossRef] [Green Version]
- Lazzarin, R. Heat pumps and solar energy: A review with some insights in the future. Int. J. Refrig. 2020, 116, 146–160. [Google Scholar] [CrossRef]
- Poppi, S.; Sommerfeldt, N.; Bales, C.; Madani, H.; Lundqvist, P. Techno-economic review of solar heat pump systems for residential heating applications. Renew. Sustain. Energy Rev. 2018, 81, 22–32. [Google Scholar] [CrossRef]
- Buker, M.S.; Riffat, S.B. Solar assisted heat pump systems for low temperature water heating applications: A systematic review. Renew. Sustain. Energy Rev. 2016, 55, 399–413. [Google Scholar] [CrossRef]
- Mohanraj, M.; Belyayev, Y.; Jayaraj, S.; Kaltayev, A. Research and developments on solar assisted compression heat pump systems—A comprehensive review (Part-A: Modeling and modifications). Renew. Sustain. Energy Rev. 2018, 83, 90–123. [Google Scholar] [CrossRef]
- Mohanraj, M.; Belyayev, Y.; Jayaraj, S.; Kaltayev, A. Research and developments on solar assisted compression heat pump systems—A comprehensive review (Part-B: Applications). Renew. Sustain. Energy Rev. 2018, 83, 124–155. [Google Scholar] [CrossRef]
- Andersson, M. Comparison of Solar Thermal and Photovoltaic Assisted Heat Pumps for Multi-Family Houses in Sweden. Master’s Thesis, KTH Royal Institute of Technology, Stockholm, Sweden, 2018. [Google Scholar]
- Williams, C.J.C.; Binder, J.O.; Kelm, T. Demand side management through heat pumps, thermal storage and battery storage to increase local self-consumption and grid compatibility of PV systems. IEEE PES Innov. Smart Grid Technol. Conf. Eur. 2012, 1–6. [Google Scholar] [CrossRef]
- Salpakari, J.; Lund, P. Optimal and rule-based control strategies for energy flexibility in buildings with PV. Appl. Energy 2016, 161, 425–436. [Google Scholar] [CrossRef] [Green Version]
- Psimopoulos, E.; Bee, E.; Widén, J.; Bales, C. Techno-economic analysis of control algorithms for an exhaust air heat pump system for detached houses coupled to a photovoltaic system. Appl. Energy 2019, 249, 355–367. [Google Scholar] [CrossRef]
- Fischer, D.; Madani, H. On heat pumps in smart grids: A review. Renew. Sustain. Energy Rev. 2017, 70, 342–357. [Google Scholar] [CrossRef] [Green Version]
- Cloverland Electric Cooperative. Rates and Charges. Available online: https://www.cloverland.com/your-account/rates-charges/ (accessed on 2 November 2020).
- Sault Ste. Marie Public Utilities Commission. Rates. Available online: https://ssmpuc.com/electricity/rates/ (accessed on 2 November 2020).
- DTE Energy. Rates Effective for Gas Service. Available online: https://newlook.dteenergy.com/wps/wcm/connect/e862777b-ce94-4c81-8ef4-ff88298abce1/rateCard.pdf?MOD=AJPERES (accessed on 2 November 2020).
- Union Gas. Current Residential Rates. Available online: https://www.uniongas.com/residential/rates/current-rates/rate-01-north-west (accessed on 2 November 2020).
- Bloomberg. USD-CAD X-Rate. Available online: https://www.bloomberg.com/quote/USDCAD:CUR (accessed on 2 November 2020).
- U.S. Energy Information Administration. Household Energy Use in Michigan; U.S. Energy Information Administration: Washington, DC, USA, 2009.
- NOAA. National Centers for Environmental Information’s. Available online: https://www7.ncdc.noaa.gov/CDO/CDODivisionalSelect.jsp (accessed on 2 November 2020).
- U.S. Department of Energy. Furnaces and Boilers. Available online: https://www.energy.gov/energysaver/home-heating-systems/furnaces-and-boilers (accessed on 2 November 2020).
- Kantamneni, A.; Winkler, R.; Gauchia, L.; Pearce, J.M. Emerging economic viability of grid defection in a northern climate using solar hybrid systems. Energy Policy 2016, 95, 378–389. [Google Scholar] [CrossRef] [Green Version]
- Fairey, P.; Parker, D.S.; Wilcox, B.; Lombardi, M. Lombardi, “Climate Impacts on Heating Seasonal Performance Factor (HSPF) and Seasonal Energy Efficiency Ratio (SEER) for Air Source Heat Pumps”. Ashrae Trans. 2004, 110, 178–188. [Google Scholar]
- ASHRAE. ASHRAE Climatic Design Conditions 2009/2013/2017; (WMO: 997268); ASHRAE: Sault Ste. Marie, MI, USA; Available online: http://ashrae-meteo.info/v2.0/ (accessed on 2 November 2020).
- Office of Energy Efficiency and Renewable Energy. Commercial and Residential Hourly Load Profiles for All TMY3 Locations in the United States. Available online: https://openei.org/datasets/files/961/pub/RESIDENTIAL_LOAD_DATA_E_PLUS_OUTPUT/BASE/ (accessed on 2 November 2020).
- System Advisor Model Version 2020.2.29 (SAM 2020.2.291); National Renewable Energy Laboratory: Golden, CO, USA, 2020.
- Sengupta, M.; Habte, A.; Buster, G.; Rossol, M.; Xie, Y.; Foster, M. A Status Update on the National Solar Radiation Data Base (NSRDB); PVPMC Webinar on Solar Resource Assessment; PV Performance Modelling Collaborative; National Renewable Energy Laboratory: Golden, CO, USA, 2020.
- Andrews, R.W.; Pearce, J.M. Prediction of Energy Effects on Photovoltaic Systems Due to Snowfall Events. In Proceedings of the 2012 38th IEEE Photovoltaic Specialists Conference, Austin, TX, USA, 3–8 June 2012; pp. 003386–003391. [Google Scholar]
- Andrews, R.W.; Pollard, A.; Pearce, J.M. The Effects of Snowfall on Solar Photovoltaic Performance. Sol. Energy 2013, 92, 84–97. [Google Scholar] [CrossRef] [Green Version]
- Cheery, L.; White, B. Green Tech Media. “SolarEdge and Enphase Now Control 80% of the US Residential Solar Inverter Market”. Available online: https://www.greentechmedia.com/articles/read/solaredge-technologies-and-enphase-control-80-of-us-residential-solar-marke#disqus_thread (accessed on 12 November 2020).
- Cramer, D. Solar Up. Personal Communication, 12 November 2020. [Google Scholar]
- Federal Reserve Board—Survey of Consumer Finances (SCF). Available online: https://www.federalreserve.gov/econres/scfindex.htm (accessed on 13 January 2021).
- Statistics Canada, Government of Canada. The Daily—Distributions of Household Economic Accounts for Income, Consumption, Saving and Wealth of Canadian Households. 2018. Available online: https://www150.statcan.gc.ca/n1/daily-quotidien/190327/dq190327b-eng.htm (accessed on 13 January 2021).
- Ontario Energy Board. Frequently Asked Question about Green Energy Initiatives. Available online: https://www.oeb.ca/industry/tools-resources-and-links/information-renewable-generators/frequently-asked-questions (accessed on 2 November 2020).
- Cloverland Electric Cooperative. Renewable Generation. Available online: https://www.cloverland.com/wp-content/uploads/Net-Metering-Application-and-Interconnection-Parallel-Operating-Agreement-Cat-1-2018-07-10-with-Diagrams.pdf (accessed on 2 November 2020).
- Spees, K.; Lave, L. Impacts of responsive load in PJM: Load shifting and real time pricing. Energy J. 2008, 29. [Google Scholar] [CrossRef]
- Chippewa County Credit Union. Savings Rates. Available online: https://chippewacountycu.com/savings-rates/ (accessed on 12 December 2020).
- Northern Credit Union. Rates. Available online: https://www.northerncu.com/personal/rates/accounts/ (accessed on 13 December 2020).
- Shirazi, E.; Jadid, S. Cost Reduction and Peak Shaving through Domestic Load Shifting and DERs. Energy 2017, 124, 146–159. [Google Scholar] [CrossRef]
- Prehoda, E.; Pearce, J.M.; Schelly, C. Policies to Overcome Barriers for Renewable Energy Distributed Generation: A Case Study of Utility Structure and Regulatory Regimes in Michigan. Energies 2019, 12, 674. [Google Scholar] [CrossRef] [Green Version]
- U.S. Energy Information Agency. 2015 Residential Energy Consumption Survey—CE4.1. Available online: https://www.eia.gov/consumption/residential/data/2015/ (accessed on 12 October 2020).
- Trudeau, J. Prime Minister Announces Canada’s Strengthened Climate Plan to Protect the Environment, Create Jobs, and Support Communities. Available online: https://pm.gc.ca/en/news/news-releases/2020/12/11/prime-minister-announces-canadas-strengthened-climate-plan-protect (accessed on 12 December 2020).
- Termo Plus. What Is the Life Expectancy of Heat Pumps? Available online: https://termo-plus.com/blog/life-expectancy-of-heat-pumps/ (accessed on 12 December 2020).
- Wee, S. The effect of residential solar photovoltaic systems on home value: A case study of Hawai ‘i. Renew. Energy 2016, 91, 282–292. [Google Scholar] [CrossRef]
- Jordan, D.C.; Kurtz, S.R.; VanSant, K.; Newmiller, J. Compendium of photovoltaic degradation rates. Prog. Photovolt. Res. Appl. 2016, 24, 978–989. [Google Scholar] [CrossRef]
- Jordan, D.C.; Kurtz, S.R. Photovoltaic Degradation Rates—An Analytical Review. Prog. Photovolt. Res. Appl. 2013, 21, 12–29. [Google Scholar] [CrossRef] [Green Version]
- Sow, A.; Mehrtash, M.; Rousse, D.R.; Haillot, D. Economic Analysis of Residential Solar Photovoltaic Electricity Production in Canada. Sustain. Energy Technol. Assess. 2019, 33, 83–94. [Google Scholar] [CrossRef]
- Baxter, V.D.; Groll, E.; Sikes, K. (Eds.) IEA HPT Annex 41 Cold Climate Heat Pumps—Final Report (HPT-AN41-1); IEA Heat Pump Centre: London, UK, 2017; ISBN 9789188349897. [Google Scholar]
- Zhang, L.; Jiang, Y.; Dong, J.; Yao, Y. Advances in vapor compression air source heat pump system in cold regions: A review. Renew. Sustain. Energy Rev. 2018, 81, 353–365. [Google Scholar] [CrossRef]
- Hansen, J.; Kharecha, P.; Sato, M.; Masson-Delmotte, V.; Ackerman, F.; Beerling, D.J.; Hearty, P.J.; Hoegh-Guldberg, O.; Hsu, S.-L.; Parmesan, C.; et al. Assessing Dangerous Climate Change: Required Reduction of Carbon Emissions to Protect Young People, Future Generations and Nature. PLoS ONE 2013, 8, e81648. [Google Scholar] [CrossRef] [Green Version]
- Ripple, W.J.; Wolf, C.; Newsome, T.M.; Galetti, M.; Alamgir, M.; Crist, E.; Mahmoud, M.I.; Laurance, W.F. World Scientists’ Warning to Humanity: A Second Notice. BioScience 2017, 67, 1026–1028. [Google Scholar] [CrossRef]
- Pachauri, R.K.; Allen, M.R.; Barros, V.R.; Broome, J.; Cramer, W.; Christ, R.; Church, J.A.; Clarke, L.; Dahe, Q.; Dasgupta, P.; et al. Climate Change 2014: Synthesis Report. Contribution of Working Groups I, II and III to the Fifth Assessment Report of the Intergovernmental Panel on Climate Change; Pachauri, R., Meyer, L., Eds.; IPCC: Geneva, Switzerland, 2014; p. 151. ISBN 978/92/9169/143/2. [Google Scholar]
- Moss, R.H.; Edmonds, J.A.; Hibbard, K.A.; Manning, M.R.; Rose, S.K.; Van Vuuren, D.; Carter, T.R.; Emori, S.; Kainuma, M.; Kram, T.; et al. The next generation of scenarios for climate change research and assessment. Nature 2010, 463, 747–756. [Google Scholar] [CrossRef] [PubMed]
- Irfan, U.; Barclay, E.; Sukumar, K. America Is Warming Fast. See How Your City’s Weather Will Be Different by 2050. Available online: https://www.vox.com/a/weather-climate-change-us-cities-global-warming (accessed on 12 December 2020).
- Brown, A.; Bunyan, J. Valuation of Distributed Solar: A Qualitative View. Electr. J. 2014, 27, 27–48. [Google Scholar] [CrossRef]
- Revesz, R.L.; Unel, B. Managing the Future of the Electricity Grid: Distributed Generation and Net Metering. Harvard Environ. Law Rev. 2017, 41, 43–108. [Google Scholar] [CrossRef]
- Luthander, R.; Widén, J.; Nilsson, D.; Palm, J. Photovoltaic self-consumption in buildings: A review. Appl. Energy 2015, 142, 80–94. [Google Scholar] [CrossRef] [Green Version]
- Costello, K.W.; Hemphill, R.C. Electric utilities’ “death spiral”: Hyperbole or reality? Electr. J. 2014, 27, 7–26. [Google Scholar] [CrossRef]
- Felder, F.A.; Athawale, R. The life and death of the utility death spiral. Electr. J. 2014, 27, 9–16. [Google Scholar] [CrossRef]
- Solano, J.C.; Brito, M.C.; Caamaño-Martín, E. Impact of fixed charges on the viability of self-consumption photovoltaics. Energy Policy 2018, 122, 322–331. [Google Scholar] [CrossRef]
- Johnson, E.; Beppler, R.; Blackburn, C.; Staver, B.; Brown, M.; Matisoff, D. Peak shifting and cross-class subsidization: The impacts of solar PV on changes in electricity costs. Energy Policy 2017, 106, 436–444. [Google Scholar] [CrossRef]
- Chesser, M.; Hanly, J.; Cassells, D.; Apergis, N. The positive feedback cycle in the electricity market: Residential solar PV adoption, electricity demand and prices. Energy Policy 2018, 122, 36–44. [Google Scholar] [CrossRef]
- Simshauser, P. Distribution network prices and solar PV: Resolving rate instability and wealth transfers through demand tariffs. Energy Econ. 2016, 54, 108–122. [Google Scholar] [CrossRef]
- Peffley, T.B.; Pearce, J.M. The Potential for Grid Defection of Small and Medium Sized Enterprises Using Solar Photovoltaic, Battery and Generator Hybrid Systems. Renew. Energy 2020, 148, 193–204. [Google Scholar] [CrossRef]
- Mundada, A.S.; Shah, K.K.; Pearce, J.M. Levelized Cost of Electricity for Solar Photovoltaic, Battery and Cogen Hybrid Systems. Renew. Sustain. Energy Rev. 2016, 57, 692–703. [Google Scholar] [CrossRef] [Green Version]
- Shah, K.K.; Mundada, A.S.; Pearce, J.M. Performance of U.S. Hybrid Distributed Energy Systems: Solar Photovoltaic, Battery and Combined Heat and Power. Energy Convers. Manag. 2015, 105, 71–80. [Google Scholar] [CrossRef] [Green Version]
- Brenn, J.; Soltic, P.; Bach, C. Comparison of natural gas driven heat pumps and electrically driven heat pumps with conventional systems for building heating purposes. Energy Build. 2010, 42, 904–908. [Google Scholar] [CrossRef]
- Baig, A.A.; Kimiaghalam, F.; Kumar, R.; Ma, J.L.; Fung, A.S. Natural gas engine driven heat pump system–a case study of an office building. Int. J. Green Energy 2020, 17, 476–487. [Google Scholar] [CrossRef]
- Luthander, R.; Widén, J.; Munkhammar, J.; Lingfors, D. Self-consumption enhancement and peak shaving of residential photovoltaics using storage and curtailment. Energy 2016, 112, 221–231. [Google Scholar] [CrossRef]
- Kästel, P.; Gilroy-Scott, B. Economics of Pooling Small Local Electricity Prosumers—Prosumer vs Business as Usual Approach. Energy Power Eng. 2018, 10, 226–252. [Google Scholar] [CrossRef] [Green Version]
- Burger, S.P.; Luke, M. Business models for distributed energy resources: A review and empirical analysis. Energy Policy 2017, 109, 230–248. [Google Scholar] [CrossRef]
- Arnaudo, M.; Topel, M.; Laumert, B. Techno-economic analysis of demand side flexibility to enable the integration of distributed heat pumps within a Swedish neighborhood. Energy 2020, 195. [Google Scholar] [CrossRef]
- Razmara, M.; Bharati, G.R.; Hanover, D.; Shahbakhti, M.; Paudyal, S.; Robinett, R.D. Building-to-grid predictive power flow control for demand response and demand flexibility programs. Appl. Energy 2017, 203, 128–141. [Google Scholar] [CrossRef]
- Lawrence, T.M.; Boudreau, M.C.; Helsen, L.; Henze, G.; Mohammadpour, J.; Noonan, D.; Patteeuw, D.; Pless, S.; Watson, R.T. Ten questions concerning integrating smart buildings into the smart grid. Build. Environ. 2016, 108, 273–283. [Google Scholar] [CrossRef] [Green Version]
- Schelly, C.; Louie, E.P.; Pearce, J.M. Examining interconnection and net metering policy for distributed generation in the United States. Renew. Energy Focus 2017, 22–23, 10–19. [Google Scholar] [CrossRef] [Green Version]
- Padovani, F.; Longobardi, F.; Sommerfeldt, N.; Pearce, J.M. Decarbonizing rural residential buildings in cold climates: A techno-economic analysis of heating electrification. (To be published).
- Rad, F.M.; Fung, A.S. Solar community heating and cooling system with borehole thermal energy storage—Review of systems. Renew. Sustain. Energy Rev. 2016, 60, 1550–1561. [Google Scholar] [CrossRef]
- Hirvonen, J.; ur Rehman, H.; Sirén, K. Techno-economic optimization and analysis of a high latitude solar district heating system with seasonal storage, considering different community sizes. Sol. Energy 2018, 162, 472–488. [Google Scholar] [CrossRef] [Green Version]
- Shreve, D. Deep Decarbonisation: The Multi-Trillion Dollar Question. Available online: https://www.woodmac.com/news/feature/deep-decarbonisation-the-multi-trillion-dollar-question/ (accessed on 13 December 2020).
- Pearce, J.M.; Prehoda, E. Could 79 People Solarize the U.S. Electric Grid? Societies 2019, 9, 26. [Google Scholar] [CrossRef] [Green Version]
- IER. Cost of Transitioning to 100-Percent Renewable Energy. 2019. Available online: https://www.instituteforenergyresearch.org/renewable/cost-of-transitioning-to-100-percent-renewable-energy/ (accessed on 13 December 2020).
- Marcacci, S. Plunging Renewable Energy Prices Mean, U.S. Can Hit 90% Clean Electricity By 2035—At No Extra Cost. Available online: https://www.forbes.com/sites/energyinnovation/2020/06/09/plunging-renewable-energy-prices-mean-us-can-hit-90-clean-electricity-by-2035at-no-extra-cost/ (accessed on 13 December 2020).
- McMahon, J. How the Clean Energy Transition Could Save More than It Costs. Available online: https://www.forbes.com/sites/jeffmcmahon/2019/08/05/how-the-clean-energy-transition-could-save-more-than-it-costs/ (accessed on 13 December 2020).
Figure 1.
Sault Ste. Marie, located in western Ontario and the eastern part of the Upper Peninsula of Michigan, is shown context in North American OpenStreetMap.
Figure 1.
Sault Ste. Marie, located in western Ontario and the eastern part of the Upper Peninsula of Michigan, is shown context in North American OpenStreetMap.

Figure 2.
Systems diagram of building energy system with PV generation (Epv), appliance loads (Eapp), heat pump loads (Ehp), and a grid connection (Egrid).
Figure 2.
Systems diagram of building energy system with PV generation (Epv), appliance loads (Eapp), heat pump loads (Ehp), and a grid connection (Egrid).

Figure 3.
The diffuse irradiance (in orange) and global irradiance (in red) measured in W/m2 as a function of hours in a representative day for 12 months.
Figure 3.
The diffuse irradiance (in orange) and global irradiance (in red) measured in W/m2 as a function of hours in a representative day for 12 months.

Figure 4.
Comparison of IRR for the various PV and PV+HP scenarios in Sault Saint Marie with “high interest” savings accounts and CD and GICs in the U.S. (black) and Canada (red), respectively.
Figure 4.
Comparison of IRR for the various PV and PV+HP scenarios in Sault Saint Marie with “high interest” savings accounts and CD and GICs in the U.S. (black) and Canada (red), respectively.


Table 1.
All electric rates are from publicly available information found on utility websites as of 11/2020.
Table 1.
All electric rates are from publicly available information found on utility websites as of 11/2020.
| Electric | Location | Flat/Off-Peak | Mid-Peak | Peak | Customer Charge Per Month | ||
|---|---|---|---|---|---|---|---|
| Cloverland Electric Coop [41] | MI | $0.093 | $23.75 | ||||
| PUC, Time of Use [42] | ONT | $0.090 | $0.124 | $0.174 | $21.88 | ||
| First 1000 kWh Oct-Apr First 600 kWh May-Sept | Balance | ||||||
| PUC, Tiered [42] | ONT | $0.100 | $0.115 | $21.88 | |||
| Gas | Location | $/100 Ccf | |||||
| DTE [43] | MI | $0.667 | $12.25 | ||||
| $/m3 first 100 m3 | 100–200 | 200–500 | 500–1000 | Over 1000 | |||
| Union Gas [44] | ONT | $0.248 | $0.246 | $0.243 | $0.240 | $0.238 | $16.98 |
Table 2.
Weighted unit price for PUC TOU is the weighted average of the prices given the number of hours they occur per week, excluding holidays.
Table 2.
Weighted unit price for PUC TOU is the weighted average of the prices given the number of hours they occur per week, excluding holidays.
| Utility | Unit | Weighted Price Per Unit | BTU Content Per Unit | Heating Type | Type of Efficiency Rating | Efficiency Rating | Cost Per Million BTU | Cost Per Year |
|---|---|---|---|---|---|---|---|---|
| Cloverland, MI | kWh | $0.093 | 3412 | Heat Pump | HSPF | 5.9 (1.73) | $15.85 | $1072.00 |
| PUC, ONT TOU | kWh | $0.111 | 3412 | Heat Pump | HSPF | 5.9 (1.73) | $18.81 | $1271.00 |
| PUC, ONT Tiered | kWh | $0.107 | 3412 | Heat Pump | HSPF | 5.9 (1.73) | $18.19 | $1365.00 |
| DTE, MI | Ccf | $0.667 | 102,800 | Furnace | AFUE | 0.95 | $6.83 | $609.04 |
| Union, ONT | M3 | $0.246 | 35,078 | Furnace | AFUE | 0.95 | $7.38 | $703.18 |
Table 3.
System Advisor Model Version 2020.2.29 [53] simulation parameters, inputs, and sources.
Table 3.
System Advisor Model Version 2020.2.29 [53] simulation parameters, inputs, and sources.
| Parameters | Input | Source | |
|---|---|---|---|
| Location and Resources | Solar Resource Library | Sault Ste. Marie MI, Station ID 971207 | NSRDB [54] |
| Global horizontal | 3.83 kWh/m2/day | NSRDB [54] | |
| System Design | System nameplate capacity (kWdc) | 6.9,20.6 | Sized to meet load |
| Module type | Standard | Default | |
| DC to AC ratio | 1.1 | Default | |
| Inverter efficiency | 96% | Default | |
| Array type | Fixed open rack | Default | |
| Inclination | 31° | Optimal for annual generation for location | |
| Azimuth | 180° | Default | |
| Losses | Soiling | 2% | Default |
| Shading | 0% | Unshaded | |
| Snow | 3% | Southern Ontario [55,56] | |
| Mismatch | 0% | Assuming optimizer or microinveter [57] | |
| Wiring | 2% | Default | |
| Connections | 0.5% | Default | |
| Light-induced degradation | 1.5% | Default | |
| Nameplate | 0% | Assuming positive power tolerance [58] | |
| Age | 0% | Default | |
| Availability | 3% | Default | |
| Total system losses | 11.44% | Default | |
| Lifetime and Degradation | Annual AC degradation rate | 0.50% | Default |
| Financial Parameters | Analysis Period | 25 years | Default |
| Inflation Rate | 2.5% | Default | |
| Sales Tax, % of total direct cost | 6% MI, 13% ONT | Local rate | |
| Insurance rate (annual) | 0% | Included under personal property on most insurance, 0.5% default [58] | |
| Property tax | 0% | Default | |
Table 4.
PV systems costs in MI and Ontario with and without HP. Interconnection fee for Cloverland Electric Coop installations included in install cost is $100 [62], for systems less than 10 kW for PUC analysis includes $1000, and for systems over 10 kW $5000.
Table 4.
PV systems costs in MI and Ontario with and without HP. Interconnection fee for Cloverland Electric Coop installations included in install cost is $100 [62], for systems less than 10 kW for PUC analysis includes $1000, and for systems over 10 kW $5000.
| System Costs | MI | ONT | MI+HP | ONT+HP | ||||
|---|---|---|---|---|---|---|---|---|
| $ | $/W | $ | $/W | $ | $/W | $ | $/W | |
| Module | 3795 | 0.55 | 3795 | 0.55 | 8580 | 0.55 | 8580 | 0.55 |
| Inverter | 2760 | 0.40 | 2760 | 0.40 | 5460 | 0.35 | 5460 | 0.35 |
| Ground mount and BOS | 4140 | 0.60 | 4140 | 0.60 | 9360 | 0.60 | 9360 | 0.60 |
| Labor | 5950 | 0.86 | 5950 | 0.86 | 10,020 | 0.64 | 10,020 | 0.64 |
| Installer margin and overhead | 3450 | 0.50 | 3450 | 0.50 | 7800 | 0.50 | 7800 | 0.50 |
| Grid interconnection | 100 | 0.01 | 754 | 0.11 | 100 | 0.01 | 3775 | 0.24 |
| Shipping | 552 | 0.08 | 552 | 0.08 | 1248 | 0.08 | 1248 | 0.08 |
| Sales tax | 627 | 0.09 | 1358 | 0.20 | 1286 | 0.08 | 2786 | 0.18 |
| Total gross cost | 21,374 | 3.10 | 22,759 | 3.30 | 43,854 | 2.81 | 49,029 | 3.14 |
Table 5.
PV system cost comparison including the U.S. Federal income tax credit.
| System Summary | MI, ITC | MI, No ITC | ONT TOU | ONT Tiered | MI+HP ITC | MI+HP No ITC | ONT+HP TOU | ONT+ HP Tiered |
|---|---|---|---|---|---|---|---|---|
| Estimated PV cost | $21,373 | $21,373 | $22,759 | $22,759 | $43,854 | $43,854 | $49,029 | $49,029 |
| 22% Federal income tax credit | $4700 | $9650 | ||||||
| Net PV cost | $16,673 | $34,204 | ||||||
| HP cost | $6500 | $6500 | $6500 | $6500 | ||||
| Total System cost | $16,673 | $21,373 | $22,759 | $22,759 | $40,704 | $50,354 | $55,529 | $55,529 |
Table 6.
PV system cost comparison including the US Federal income tax credit.
| System Summary | MI, ITC | MI, No ITC | ONT TOU | ONT Tiered | MI+HP ITC | MI+HP No ITC | ONT+HP TOU | ONT+HP Tiered |
|---|---|---|---|---|---|---|---|---|
| Electricity bill w/o PV | $1141 | $1141 | $1365 | $1277 | $2213 | $2213 | $2636 | $2592 |
| Electricity bill w/ PV | $288 | $288 | $94 | $352 | $287 | $287 | ($236) | $236 |
| Electricity savings | $853 | $853 | $1271 | $925 | $1926 | $1926 | $2872 | $2356 |
| Natural gas cost | $609 | $609 | $703 | $703 | $0 | $0 | $0 | $0 |
| Electricity w/o PV + gas w/o HP | $1750 | $1750 | $2068 | $1980 | $1750 | $1750 | $2068 | $1980 |
| Combined utilities w/ PV, w/o HP | $897 | $897 | $797 | $1055 | N/A | N/A | N/A | N/A |
| Combined utilities w/ PV, w/ HP | N/A | N/A | N/A | N/A | $287 | $287 | ($236) | $236 |
| Net savings | $853 | $853 | $1271 | $925 | $1463 | $1463 | $2304 | $1744 |
| Year one ROI | 5.1% | 4.0% | 5.6% | 4.1% | 3.6% | 2.9% | 4.1% | 3.1% |
| Simple payback (years) | 16.7 | 20.5 | 15.5 | 20.2 | 19.7 | 24.1 | 18.1 | 23.2 |
| IRR | 3.4% | 1.6% | 4.1% | 1.7% | 1.9% | 0.3% | 2.7% | 0.6% |
Publisher’s Note: MDPI stays neutral with regard to jurisdictional claims in published maps and institutional affiliations. |
© 2021 by the authors. Licensee MDPI, Basel, Switzerland. This article is an open access article distributed under the terms and conditions of the Creative Commons Attribution (CC BY) license (http://creativecommons.org/licenses/by/4.0/).
Share and Cite
MDPI and ACS Style
Pearce, J.M.; Sommerfeldt, N. Economics of Grid-Tied Solar Photovoltaic Systems Coupled to Heat Pumps: The Case of Northern Climates of the U.S. and Canada. Energies 2021, 14, 834. https://doi.org/10.3390/en14040834
AMA Style
Pearce JM, Sommerfeldt N. Economics of Grid-Tied Solar Photovoltaic Systems Coupled to Heat Pumps: The Case of Northern Climates of the U.S. and Canada. Energies. 2021; 14(4):834. https://doi.org/10.3390/en14040834
Chicago/Turabian StylePearce, Joshua M., and Nelson Sommerfeldt. 2021. "Economics of Grid-Tied Solar Photovoltaic Systems Coupled to Heat Pumps: The Case of Northern Climates of the U.S. and Canada" Energies 14, no. 4: 834. https://doi.org/10.3390/en14040834
Note that from the first issue of 2016, this journal uses article numbers instead of page numbers. See further details here.