We’ve been writing for a number of years about the relationship between attainment and the amount of time pupils have been eligible for free school meals.
We have also shown how this varies by ethnic background and how geographic differences in disadvantage and ethnic background (rather than school effectiveness) largely account for regional differences in attainment.
We’ve revisited this area in some work we’ve carried out for the Northern Powerhouse Partnership.
So we’re now in a position to say: What was the relationship between attainment and the amount of time pupils had been eligible for free school meals in 2019 (the latest year for which data is available)?
Setting the scene
We’re going to look at both Key Stage 2 and Key Stage 4 outcomes.
To facilitate analysis, we’re going to assign pupils to one of five bands based on their history of free school meal eligibility from Reception to either the end of Year 6 (KS2 pupils) or the end of Year 11 (KS4).[1][2] These bands are:
- Never eligible for free school meals (‘Never FSM’)
- Eligible for free school meals up to a quarter of school career (measured in terms), and at least once
- Eligible for free school meals between a quarter and a half of school career
- Eligible for free school meals between a half and four-fifths (80%) of school career
- Eligible for free school meals for more than four-fifths of school career – what we’ve referred to before, and will refer to here, as ‘long-term disadvantaged’
We’ll also classify pupils by ethnic background. Some of the work referenced above identified that disadvantage appears to have a particularly acute impact on attainment for certain groups of pupils. For ease of presentation, we’ll collapse ethnic backgrounds into two groups based on this: those for whom disadvantage appears to have a big impact, and those for which its impact is less – referred to subsequently as the ‘high impact’ and the ‘low impact’ group, respectively.
The former group consists of white British, Irish, Irish heritage Traveller, Gypsy/Roma, black Caribbean and mixed white/Caribbean pupils. The second group consists of all other groups.
National differences in attainment
To do this analysis, at both KS2 and KS4 we’ll consider an overall measure of attainment.
For KS2, this is pupils’ average scaled score[3] in reading; grammar, punctuation and spelling; and maths. Maths is double-weighted to ensure an even balance between literacy and numeracy.
For KS4, this is Attainment 8.
To enable comparison between the two, we’ll ‘standardise’ them – that is, put them on the same scale, with mean 100 and standard deviation 15.
We’ll also calculate value added scores for our measures. At KS2, we’ll calculate our own measure using total score in the Early Years Foundation Stage Profile as a baseline, while for KS4, we’ll use Progress 8.
And we’ll put the value added scores onto the same scale as the attainment measures. This helps show the extent to which attainment gaps are due to prior attainment.
The chart below shows how these standardised scores differ by region, at both KS2 and KS4.
From this we can see that there are small differences in overall attainment and value added between regions at KS2 and KS4. London leads the way for both. (Its attainment and value added are between 0.1 and 0.2 of a standard deviation higher than the national average.)
Regional differences in pupil characteristics
Before diving further into the regional differences, and looking how they’re related to length of time spent eligible for free school meals, it’s worth looking at how the composition of the pupil population differs between the regions.
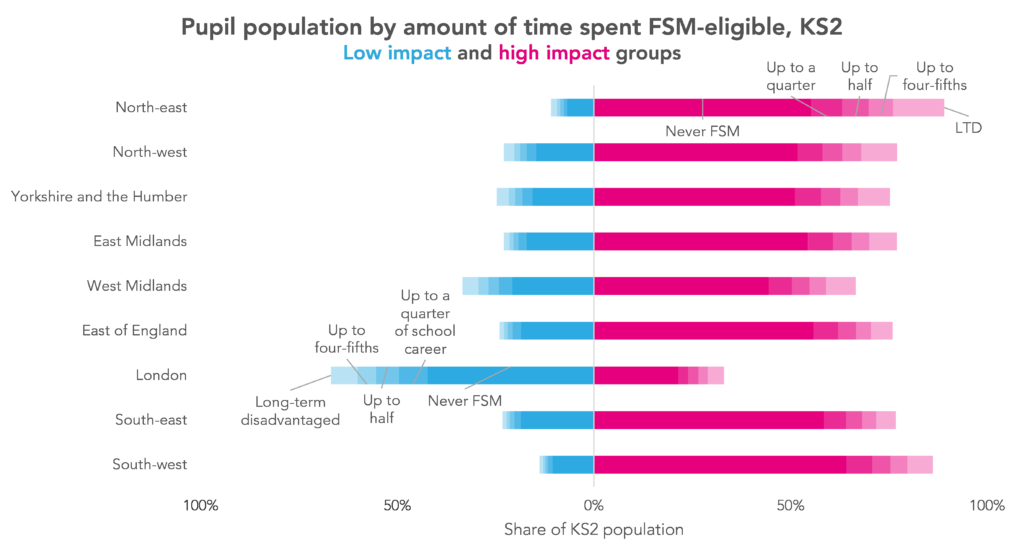
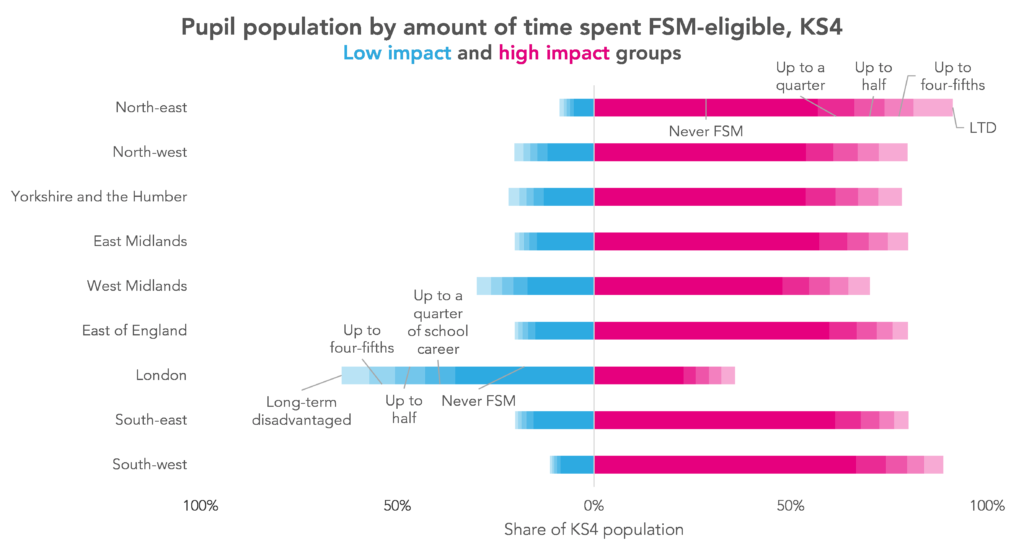
The charts below do this, for KS2 and KS4, dividing the pupil population up into the disadvantage/ethnicity groupings described above – that is, one grouping of pupils who are highly impacted by disadvantage, on average, and one grouping of those for whom disadvantage has a comparatively low impact.
London stands out most clearly, having a much greater share of pupils in the ‘low impact’ group – that is, pupils whose attainment (on average) appears less affected by periods of disadvantage.
Regional differences in attainment
So how does the attainment and value added of these different groups of pupils vary?
You can explore this in the chart below.
A number of things stand out.
Firstly, at KS2, for pupils of all disadvantage levels, those in the ‘low impact’ group have higher attainment in London than in any other region. (The same is not true for value added.)
But, considering the ‘high impact’ group, KS2 attainment is highest in the north-east for all groups bar the ‘Never FSM’ group – by some margin in some cases. We called this back in 2016, as it happens, and while it’s perhaps slightly more widely known now, it may still come as a surprise to some.
The (low) KS2 attainment of the long-term disadvantaged, ‘high impact’ group in East of England and the south-east, also seems notable.
At KS4, pupils in the long-term disadvantaged, ‘high impact’ group attain most highly in London, despite their value added not being notably different to other regions. This shows that the advantage for this group of pupils was due to attainment at primary school rather than making better progress at secondary. (For more of discussion of the interaction of ethnicity and disadvantage in the capital, see this post.)
Demography not geography
As we mentioned at the top of this post, our previous work has led us to conclude that geographic differences in the composition of pupil populations rather than school effectiveness largely account for regional differences in attainment.
Many of the patterns that we see in the 2019 data don’t come as a surprise, then. (At region-level, pupil populations don’t vary much from one year to the next). But they do shed some light on the challenges being faced in different parts of the country, even before the pandemic hit.
Want to stay up-to-date with the latest research from FFT Education Datalab? Sign up to Datalab’s mailing list to get notifications about new blogposts, or to receive the team’s half-termly newsletter.
1. We’re using school census data to do this. Note that some pupils may have experienced short periods of free school meal eligibility between school censuses that we do not observe in the data available to us.
2. This could be the swansong for this type of analysis. The criteria for free school meals eligibility were changed in April 2018 for new claimants of Universal Credit. The Department for Education had earlier consulted[PDF] on the changes and what they would mean for schools.
Under the new free school meals eligibility criteria, only households with net incomes (i.e. excluding benefits) of £7,400 or under are eligible.
However, to avoid pupils missing out on free school meals as a result of the changes, the DfE has chosen to ‘protect’ the children of existing claimants, even if they no longer meet the eligibility criteria. These transitional arrangements will remain in place in two phases. Firstly until Universal Credit has been fully rolled out nationally (expected to be March 2022) and then until a pupil reaches the end of the phase of schooling (Year 6 or Year 11) that they are in at the time. This affects our 2019 data – but analysis in subsequent years will find data rendered less comparable still because of this point.
3. We also include pupils working below the standards assessed by the KS2 tests based on teacher assessment using the methodology used by the Department for Education in their value added calculations.


Leave A Comment