Guest Post by Willis Eschenbach
Well, for my sins I’ve been working on a paper with the hope of getting it published in a journal. Now that it’s nearly done, I realized that I have the worlds’ best peer-reviewers available on WUWT. So before seeing if I can get this published, I thought I’d take advantage of you good folks for some “peer preview”, to point out to me any problems you might see with the title, format, style, data, conclusions, or any other part of the following paper. All of the graphics are in grayscale because that’s what the journals want.
Many thanks for any and all contributions.
w.
The Emergent Thermostat
Abstract
The current paradigm of climate science is that the long-term change in global temperature is given by a constant called “climate sensitivity” times the change in downwelling radiation, called “radiative forcing”. However, despite over forty years of investigation, the uncertainty of the value of climate sensitivity has only increased.1 This lack of any progress in determining the most central value in the current paradigm strongly suggests that the paradigm itself is incorrect, that it is not an accurate description of reality. Here I propose a different climate paradigm, which is that a variety of emergent climate phenomena act in concert to keep the surface temperature within tight limits. This explains the unusual thermal stability of the climate system.
Overview
Several authors have analyzed the climate system as a heat engine. Here is Reis and Bejan’s description
The earth with its solar heat input, heat rejection, and wheels of atmo- spheric and oceanic circulation, is a heat engine without shaft: its maximized (but not ideal) mechanical power output cannot be delivered to an extraterrestrial system. Instead, the earth engine is destined to dissipate through air and water friction and other irreversibilities (e.g., heat leaks across finite ∆T) all the mechanical power that it produces. It does so by ‘‘spinning in its brake’’ the fastest that it can (hence the winds and the ocean currents, which proceed along easiest routes).2
When viewed as a heat engine, one of the most unusual and generally unremarked aspects is its astounding stability. Over the 20th Century, the global average surface temperature varied by less than one kelvin. This is a variation of ± 0.2%. Given that the system rejects a variable amount of incoming energy, with the variations mostly controlled by nothing more solid than clouds, this is a most surprising degree of stability.
This in turn strongly argues for some global thermoregulatory mechanism. The stability cannot be from simple thermal inertia, because the hemispheric land temperatures vary by ~ 20K over the year, and hemispheric sea temperatures vary by ~ 5K.
Emergence
There is no generally accepted definition of emergence. In 1874 Lewes proposed the following definition: “Emergence: Theory according to which the combination of entities of a given level gives rise to a higher level entity whose properties are entirely new”.3
For the purposes of this article, I will define emergent climate phenomena functionally and by example.
Emergent climate phenomena arise spontaneously, often upon passing some thermal or other threshold. Consider the daily development of the tropical cumulus cloud field. Upon passing a temperature threshold, out of a clear sky hundreds of individual cumulus clouds can appear in a short time.
They have a time of emergence and a limited lifespan. Dust devils form spontaneously at a certain moment, persist for a while, and then dissipate and disappear.
They form a separate whole, distinct from the surroundings. Tropical thunderstorms are surrounded by clear air.
They are often mobile and move in unpredictable ways. As a result, tropical cyclones have “prediction cones” for where they might possibly go next, rather than being accurately predictable.
They are often associated with phase changes in the relevant fluids. Convective cloud emergence involves a phase change of water.
Once in existence, they can persist below the threshold necessary for their emergence. Rayleigh-Benard circulation requires a certain temperature difference to emerge, but once in existence, the circulation can persist at a smaller temperature difference.
They are flow systems far from equilibrium. As such, in accordance with the Constructal Law4, they must evolve and mutate to survive.
They are not naively predictable, as they have entirely different properties than the substrate from which they emerge. If you lived somewhere that there were never clouds, you likely would not predict that a giant white object might suddenly appear hundreds of meters above your head.
Examples of natural emergent phenomena with which we are familiar include the behavior of flocks of birds, vortices of all kinds, termite mounds, consciousness, and indeed, life itself. Familiar emergent climate phenomena include thunderstorms, tornadoes, Rayleigh-Bénard circulation of the atmosphere and ocean, clouds, cyclones, El Ninos, and dust devils.
A Simple Example
To explain how emergent phenomena thermoregulate the earth’s surface temperature, consider the lowly “dust devil”. As the sun heats a field in the summer, the change in temperature is some fairly linear function of the “forcing”, the downwelling solar radiation. This is in accord with the current paradigm. But when the hottest part of the field reaches a certain temperature with respect to the overlying atmospheric temperature, out of the clear sky a dust devil emerges. This cools the surface in several ways. First, it moves warm surface air upwards into the lower troposphere. Second, it increases sensible heat transfer, which is a roughly linear function of the air velocity over the surface. Third, it increases evaporation, which again is a roughly linear function of the surface air velocity.
At this point, the current paradigm that the change in temperature is a linear function of the change in forcing has broken down entirely. As the sunshine further irradiates the surface, instead of getting more temperature we get more dust devils. This puts a cap on the surface temperature. Note that this cap is not a function of forcing. The threshold is temperature-based, not forcing-based. As a result, it will not be affected by things like changing amounts of sunshine or variations in greenhouse gases.
A Complete Example
The heavy lifting of the thermoregulatory system, however, is not done by dust devils. It is achieved through variations in the timing and strength of the daily emergence of tropical cumulus fields and the ensuing tropical thunderstorms, particularly over the ocean. This involves the interaction of several different emergent phenomena
Here is the evolution of the day and night in the tropical ocean. The tropical ocean is where the majority of the sun’s energy enters the huge heat engine we call the climate. As a result, it is also where the major thermostatic mechanisms are located.

Figure 1. Daily emergent phenomena of the tropical ocean.
As seen in Panel “Early Morning”, at dawn, the atmosphere is stratified, with the coolest air nearest the surface. The nocturnal emergent Rayleigh-Bénard overturning of the ocean is coming to an end. The sun is free to heat the ocean. The air near the surface eddies randomly.
As the sun continues to heat the ocean, around ten or eleven o’clock in the morning a new circulation pattern emerges to replace the random atmospheric eddying. As soon as a critical temperature threshold is passed, local Rayleigh-Bénard-type circulation cells emerge everywhere. This is the first emergent transition, from random circulation to Rayleigh-Bénard circulation. These cells transport both heat and water vapor upwards.
By late morning, the Rayleigh-Bénard circulation is typically strong enough to raise the water vapor to the local lifting condensation level (LCL). At that altitude, the water vapor condenses into clouds as shown in Panel “Late Morning”.
This area-wide shift to an organized circulation pattern is not a change in feedback, nor is it related to forcing. It is a self-organized emergent phenomenon. It is threshold-based, meaning that it emerges spontaneously when a certain threshold is passed. In the wet tropics there’s plenty of water vapor, so the major variable in the threshold is the temperature. In addition, note that there are actually two distinct emergent phenomena in Panel 2—the Rayleigh-Bénard circulation which emerges prior to the cumulus formation, and which is enhanced and strengthened by the totally separate emergence of the clouds. We now have two changes of state involved as well, with evaporation from the surface and condensation and re-evaporation at altitude.
Under this new late-morning cumulus circulation regime, much less surface warming goes on. Part of the sunlight is reflected back to space, so less energy makes it into the system to begin with. Then the increasing surface wind due to the cumulus-based circulation pattern increases the evaporation, reducing the surface warming even more by moving latent heat up to the lifting condensation level.
The crucial issues here are the timing and strength of the emergence. If the ocean is a bit warmer, the new circulation regime starts earlier in the morning and it cuts down the total daily warming. On the other hand, if the ocean is cooler than usual, clear morning skies last later into the day, allowing increased warming. The system temperature is thus regulated both from overheating and excessive cooling by the time of onset of the regime change.
Consider the idea of “climate sensitivity” in this system, which is the sensitivity of surface temperature to forcing. The solar forcing is constantly increasing as the sun rises higher in the sky. In the morning before the onset of cumulus circulation, the sun comes through the clear atmosphere and rapidly warms the surface. So the thermal response is large, and the climate sensitivity is high.
After the onset of the cumulus regime, however, much of the sunlight is reflected back to space. Less sunlight remains to warm the ocean. In addition to reduced sunlight, there is increased evaporative cooling. Compared to the morning, the climate sensitivity is much lower.
So here we have two situations with very different climate sensitivities. In the early morning, climate sensitivity is high, and the temperature rises quickly with the increasing solar insolation. In the late morning, a regime change occurs to a situation with much lower climate sensitivity. Adding extra solar energy doesn’t raise the temperature anywhere near as fast as it did earlier.
At some point in the afternoon, there is a good chance that the cumulus circulation pattern is not enough to stop the continued surface temperature increase. If the temperature exceeds a certain higher threshold, as shown in Panel “Late Afternoon”, another complete regime shift takes place. The regime shift involves the spontaneous emergence of independently mobile heat engines called thunderstorms.
Thunderstorms are dual-fuel heat engines. They run on low-density air. That air rises and condenses out the moisture. The condensation releases heat that re-warms the air, which rises deep into the troposphere.
There are two ways the thunderstorms get low-density air. One is to heat the air. This is how a thunderstorm gets started, as a solar-driven phenomenon emerging from strong cumulus clouds. The sun plus GHG radiation combine to heat the surface, which then warms the air. The low-density air rises. When that circulation gets strong enough, thunderstorms start to form. Once the thunderstorm is started, the second fuel is added — water vapor. The more water vapor there is in the air, the lighter it becomes. The thunderstorm generates strong winds around its base. Evaporation is proportional to wind speed, so this greatly increases the local evaporation. This makes the air lighter and makes the air rise faster, which makes the thunderstorm stronger, which in turn increases the wind speed around the thunderstorm base. A thunderstorm is a regenerative system, much like a fire where part of the energy is used to power a bellows to make the fire burn even hotter. Once it is started, it is much harder to stop. This gives thunderstorms a unique ability that is not represented in any of the climate models. A thunderstorm is capable of driving the surface temperature well below the initiation temperature that was needed to get the thunderstorm started. It can run on into the evening, and often well into the night, on its combination of thermal and evaporation energy sources.
Thunderstorms function as heat pipes that transport warm air rapidly from the surface to the lifting condensation level where the moisture turns into clouds and rain, and from there to the upper atmosphere without interacting with the intervening greenhouse gases. The air and the energy it contains are moved to the upper troposphere hidden inside the cloud-shrouded thunderstorm tower, without being absorbed or hindered by GHGs on the way. Thunderstorms also cool the surface in a host of other ways, utilizing a combination of a standard refrigeration cycle with water as the working fluid, plus cold water returned from above, clear surrounding air allowing greater upwelling surface radiation, wind-driven evaporation, spray increasing evaporation area, albedo changes, and cold downwelling entrained air.
As with the onset of the cumulus circulation, the onset of thunderstorms occurs earlier on days when it is warmer, and it occurs later (and sometimes not at all) on days that are cooler than usual. Again, there is no way to assign an average climate sensitivity. The warmer it gets, the less each additional watt per meter warms the surface.
Once the sun sets, first the cumulus and then the thunderstorms decay and dissipate. In Panel 4, a final and again different regime emerges. The main feature of this regime is that during this time, the ocean radiates the general amount of energy that was absorbed during all of the other parts of the day.
During the nighttime, the surface is still receiving energy from the greenhouse gases. This has the effect of delaying the onset of oceanic overturning, and of reducing the rate of cooling. Note that the oceanic overturning is once again the emergent Rayleigh-Bénard circulation. Because there are fewer clouds, the ocean can radiate to space more freely. In addition, the overturning of the ocean constantly brings new water to the surface to radiate and cool. This increases the heat transfer across the interface. As with the previous thresholds, the timing of this final transition is temperature-dependent. Once a critical threshold is passed, oceanic overturning emerges. Stratification is replaced by circulation, bringing new water to radiate, cool, and sink. In this way, heat is removed, not just from the surface as during the day, but from the entire body of the upper layer of the ocean.
Predictions
A theory is only as good as its predictions. From the above theoretical considerations we can predict the following:
Prediction 1. In warm areas of the ocean, clouds will act to cool the surface, and in cold areas they will act to warm the surface. This will be most pronounced above a temperature threshold at the warmest temperatures.
Evidence validating the first prediction.

Figure 2. Scatterplot, sea surface temperature (SST) versus surface cloud radiative effect. The more negative the data the greater the cooling.
As predicted, the clouds warm the surface when it is cold and cool it when it is warm, with the effect very pronounced above about 26°C – 27°C.
Prediction 2. In the tropical ocean, again above a certain temperature threshold, thunderstorms will increase very rapidly with increasing temperature.
Evidence validating the second prediction.
Since there is always plenty of water over the tropical ocean, and plenty of sunshine to drive them, thermally driven tropical thunderstorms will be a function of little more than temperature.

Figure 3. Cloud top altitude as a proxy for deep convective thunderstorms versus sea surface temperature.
As with clouds in general, there is a clear temperature threshold at about 26°C – 27°C, with a nearly vertical increase in thunderstorms above that threshold. This puts a very strong cap on increasing temperatures.
Prediction 3. Transient decreases in solar forcing such as those from eruptions will be counteracted by increased sunshine from tropical cumulus forming later in the day and less frequently. This means that after an initial decrease, incoming solar will go above the pre-eruption baseline until the status quo ante is re-established.
Evidence validating the third prediction.
Regarding the third prediction, my theory solves the following Pinatubo puzzle from Soden et al.5
“Beginning in 1994, additional anomalies in the satellite-observations of top-of-atmosphere absorbed solar radiation become evident, which are unrelated to the Mount Pinatubo eruption and therefore not reproduced in the model simulations. These anomalies are believed to stem from decadal-scale changes in the tropical circulation over the mid to late 1990’s [see J. Chenet al., Science 295, 838 (2002); and B.A. Wielicki et al., Science 295, 841 (2002], but their veracity remains the subject of debate. If real, their absence in the model simulations implies that discrepancies between the observed and model-simulated temperature anomalies, delayed 1 to 2 years by the climate system’s thermal inertia, may occur by the mid-1990s.”

Figure 4. Soden Figure 1, with original caption
However, this is a predictable result of the emergent thermostat theory. Here is the change in lower atmospheric temperature along with the ERBS data from Soden:

Figure 5. ERBE absorbed solar energy (top panel in Figure 4) and UAH lower tropospheric temperature (TLT). Both datasets include a lowess smoothing.
As predicted by the theory, the absorbed solar energy goes above the baseline until the lower troposphere temperature returns to its pre-eruption value. At that point, the increased intake of solar energy ceases and the system is back in its steady-state condition.
Prediction 4. The “climate sensitivity”, far from being a constant, will be found to be a function of temperature.
Evidence validating the fourth prediction.
Figure 6 below shows the 1° latitude by 1° longitude gridcell by gridcell relationship between net downwelling radiation at the surface and the surface temperature.

Figure 6. Scatterplot, CERES net downwelling surface radiation (net shortwave plus longwave) versus Berkeley Earth global surface temperature. The slope of the lowess smooth at any point is the “climate sensitivity” at that temperature, in °C per watt per square metre (W/M2)
The tight correlation between the surface temperature and the downwelling radiation confirms that this is a valid long-term relationship. This is especially true given that the two variables considered are from entirely different and unrelated datasets.
Note that the “climate sensitivity” is indeed a function of temperature, and that the climate sensitivity goes negative at the highest temperatures. It is also worth noting that almost nowhere on the planet does the long-term average temperature go above 30°C. This is further evidence of the existence of strong thermoregulatory mechanisms putting an effective cap on how hot the surface gets on average.
Prediction 5. In some areas, rather than the temperature being controlled by the downwelling surface radiation, the surface radiation will be found to be controlled by the temperature.
Evidence validating the fifth prediction.
Figure 7 below shows the correlation between net downwelling surface radiation (net shortwave plus longwave) and surface temperature. As expected, over most of the land masses the correlation is positive—as the downwelling radiation increases, so does the surface temperature.

Figure 7. Correlation between monthly surface temperatures and monthly surface downwelling radiation. Seasonal variations have been removed from both datasets.
However, over large areas of the tropical ocean, the temperature and downwelling surface radiation are negatively correlated. Since decreasing downwelling radiation cannot increase the surface temperature, the only possible conclusion is that in these areas, the increasing temperature modifies the number and nature of the overlying clouds in such a way to decrease the downwelling radiation.
CONCLUSIONS
1) The current climate paradigm, which is that in the long run, changes in global surface temperature are a simple linear function of changes in forcing (downwelling radiation), is incorrect. This is indicated by the inability of researchers to narrow the uncertainty of the central value of the paradigm, “climate sensitivity”, despite forty years of investigations, millions of dollars, billions of computer cycles, and millions of work-hours being thrown at the problem. It is also demonstrated by the graphs above which show that far from being a constant, the “climate sensitivity” is a function of temperature.
2) A most curious aspect of the climate system is its astounding stability. Despite being supported at tens of degrees warmer than the moon by nothing more stable than evanescent clouds, despite volcanic eruptions, despite changes in CO2 and other GHG forcings, despite great variations in aerosols and black carbon, over the 20th Century the temperature varied by only ±0.2%.
3) This amazing stability implies and indeed requires the existence of a very strong thermoregulation system.
4) My theory is that the thermoregulation is provided by a host of interacting emergent phenomena. These include Rayleigh-Benard circulation of the ocean and the atmosphere; dust devils; tropical thermally-driven cumulus cloud fields; thunderstorms; squall lines; cyclones; tornadoes; the La Nina pump moving tropical warm water to the poles and exposing cool underlying water; and the great changes in ocean circulation involved with the Pacific Decadal Oscillation, the North Atlantic Oscillation, and other oceanic cycles.
5) This implies that temperatures are unlikely to vary greatly from their current state because of variations in CO2, volcanoes, or other changing forcings. The thresholds for the various phenomena are temperature-based, not forcing-based. So variations in forcing will not affect them much. However, it also opens up a new question—what causes slow thermal drift in thermoregulated systems?
REFERENCES
1 Knutti, R., Rugenstein, M. & Hegerl, G. Beyond equilibrium climate sensitivity. Nature Geosci 10, 727–736 (2017). https://doi.org/10.1038/ngeo3017
2 Lewes, G. H. (1874) in Emergence, Dictionnaire de la langue philosophique, Foulquié.
3 Reis, A. H., Bejan, A, Constructal theory of global circulation and climate, International Journal of Heat and Mass Transfer, Volume 49, Issues 11–12, 2006, Pages 1857-1875, https://doi.org/10.1016
4 Bejan, A, Reis, A. Heitor, Thermodynamic optimization of global circulation and climate, International Journal of Energy Research, Vol. 29, Is. 4, https://doi.org/10.1002/er.1058
5 Brian J. Soden et al., Global Cooling After the Eruption of Mount Pinatubo: A Test of Climate Feedback by Water Vapor,Science 26 Apr 2002, Vol. 296, Issue 5568, pp. 727-730, DOI: 10.1126/science.296.5568.727
Anyhow, that’s what I have to date. There are few references, because AFAIK nobody else is considering the idea that emergent phenomena act as a global thermostat. Anyone who knows of other references that might be relevant, please mention them.
Finally, any suggestions as to which journal might be willing to publish such a heretical view of climate science would be much appreciated.
My best to all, the beat goes on,
w.
As Always: I can defend my own words, but I can’t defend your interpretation of them. So if you comment, please quote the exact words you are discussing so we can all understand what you are referring to.
I would publish on a pre-print service first, just to be sure. Also, I don’t understand journals wanting grayscale, I would submit everything in colour, I haven’t seen a journal wanting grayscale since the 90’s.
Thanks, Pauleta, good suggestion re preprint. As to colour, from Nature magazine:
Being an unwealthy man …
However, as you point out, different journals have different requirements. And only the last figure really benefits from being in color.
w.
Nature is quite a high bar, Willis. They slapped me and my five co-authors around hard on a submission some years ago and wouldn’t bother with us at all — told us don’t come back basically. Some of their objection was undoubtedly a stance that our lead author took that I advised against and that they disliked, but Nature, the editors and reviewers, will not consider certain topics or viewpoints. So, be prepared for a rejection is all I am saying. I see you are getting some suggestions for prior work below, which will aid you a lot.
I’ll have a read of this later, and pass on what I can. As I have said, I like this hypothesis of yours, but it seems somewhat similar to the IR iris thesis of Lindzen, which I am sure you know of.
Similar but not same. See my comment below. Lindzen argued via Tstorm indirect impact on amount of warming (hence IR) high cirrus formed from thunderhead moisture detrainment. WE is arguing direct via humidity washout and insolation/clouds
Nature has door guards. Only a small percentage of submissions go to review with the subject specialist editors culling most papers.
I understand, but my warning is that hinting at certain things, especially things the editors dislike, is a sure way to get cancelled early. The best policy is often to let the argument and data speak for themselves. i.e. Willis’s discussion about future warming I would ixna…
One important thing here is the claim that climate sensitivity is not a global constant, but is variable and locally dependent on temperature. That is new and quite important, since this “debunks” a lot of climate models which depend on a “fixed” ECS and gives an explanation (among a lot of other things) why they fail.
This is a good point, but it needs a lot more development. A person could have looked at the pattern of warming two decade ago and found that it was largely confined to specific places like western North America. The paleo record probably shows the same. We came out of the last ice age in fits and starts, here and there, and the timing of the climb from the Little Ice Age seems dependent on region as well.
Yes, different regions have their own internal storage of warm energy in water and some regions have their own internal storage of ice that cools by reflecting (albedo) and cools by ice thawing (ice was formed from IR out at an earlier time)
Willis has a good description of tropical cooling, but he does not mention the Polar cooling. Warm water flows to the polar regions and cold water flows back.
One important thing here is the claim that climate sensitivity is not a global constant, but is variable and locally dependent on temperature ADD and dependent on water and ice.
Willis, have you thought about crowd-funding regarding the colour figures? Compared to Peter Ridd’s requirements this should hardly be a problem.
Rainer Facius
Willis – Nature will NEVER take your paper.
a. They are snobby, and you lack their credentials and establishmentarianism.
b. You are proposing a theory outside the consensus, which is completely taboo.
They will just take your paper, and sit on it for a year – thus stopping you from applying to anyone else.
Ralph
Willis. Don’t presume they won’t. Your emergent phonomena is a major breakthrough.
Agree. Try to condense to letter form first, with just max 2 figures, balance supporting to come later. Should get through. Once wedge in crack will open and you will get full peer review. Important for WE to get his discovery (yes) out there first. Brilliant!
I think everything is better in colour Willis (except “It’s a Wonderful life”) but I cant judge how much you are losing by the greyscale. Ae you able to publish here at WUWT figure2 which I guess would give us a good example as to whether greyscale in this case is inferior
tonyb
I can’t recall what the policy is for Nature, but I suspect they will not consider for publication a paper that has appeared elsewhere, and I imagine that includes pre-print.
Is there any progress since October last of the H&W 2020 pre-print paper finding saturation of CO2and water vapour in the atmosphere discussed here at the time?
I have not kept up with progress of the Happer and Wijngaarten paper. For me the preprint is generally all I have interest in — I just want to know the data and thinking behind something.
What people believe is not of any practical value. What happens is.
Pre print exists to allow the paper to get pre pub comment and protect the IP.
Pre print is not considered as a publication that then makes it the copyright property of the publisher in some contractual way. You CAN offer a pre pub for publication, I have, several times. It’s non consensual science so hard to place.
FYI I am advised by academics that it is common in academe to submit to several journals at once and simply lie about this, so you can withdraw if more than one accept. I also think this is reasonable, for all the obvious reasons of serialised delay, ……….. as long as the acceptance results in the other submissions being terminated.
Elsevier SSRN is where my two papers sit, being improved until I can find a publisher that is not scared of papers testing theories about the natural World that prefer the application of physical laws to test a definite theory by actual observations. Deterministic science 101. Surely not!
I have not had one suggestion/question from the pisting, but 200 reads for each. People seem more interested in publishing what they believe than reading what others have actually proven in the new “consensual science”
Lovelock’s GAIA included bio control. i suggest in my “test the limits macro approach” that you can burn the planet off and nothing much happens, the oceans have control.
What’s on the dry, low heat capacity land is largely irrelevant in the scale of things, as the Dinosaurs showed, the carbon just got recycled into new “bio diversity”, that nature just creates by accident but doesn’t care about and that constantly go extinct to be replaced by the new better adapted model. Evolving surface mold. Whatever works best at the time evolves to exploit the carbon and water, and by eating plants and each other.
Anyone of our rather too smart for its own good evolutionary pathway, looking in a quantified way at the planet as a joined up / coupled system of transfer functions, subected to positive and negative perturbations from the range of possible causes, can see it is not an open system sensitive to perturbation such as small changes in the lapse rate. That only happens with partial approaches that are simply wrong – for this very obvious reason that is somple to ddemonstarte on tye umbersscience knows..
It is self evident the oceanic response to SST change and its secondary effects on albedo dominate, and the lapse rate changes of whatever GHE there is are a tiny effect within one transfer function, controlled within the strongly fed back system.
Hope that helps somehow?
“1.1 Natural Feedback and Cyclic Control:In addition to the above causes and effects, extreme “surface” events, such as external asteroids or internal super volcanoes on land, primarily affect the low heat content atmosphere in the short term, and have not been of sufficient nor sustained effect to cause significant deviation from the long term climate cycles in the geological record. That is because the dominant control of planetary climate is the varying heat content of the oceans, 1,000 times that of the atmosphere, that cover 70% of the Earth’s surface and control global surface temperatures at sea and on land, and whose powerful negative feedback to SST change also limits the upper and lower bounds of the ice age cycles. The land modifies that dominant control to produce continental climate effects. The atmosphere’s primary function is as a medium to support the level of water vapour required to cool the ocean surface by evaporation and to transport the latent heat in the vapour to the Tropopause by convection, that then contributes to the formation of clouds as the vapour condenses. The clouds reduce solar insolation through the change in total cloud albedo.
This oceanic response is the dominant negative feedback control of the Earth’s equilibrium heat balance. Currently this is at 100W m-2 of convective transport of evaporated latent heat [14], plus the albedo effect at 50W m-2[15] , of which the variability is estimated to be as high as 10% per deg K at the equator where it is highest. Another estimate from Roy Spencer published by John Christy suggests 2.6W m-2 deg-1 for the average global effect. This dominant response to changing SST is largest in the tropics, where the majority of the energy is both deposited by the Sun and given up by the oceans, the evaporative effect changing at around 10% per degree at 28 deg c.
1.1.1 Tropical Feedback As a Limiting ControlThe interglacial rise itself is observed to continue at a steady pace until arrested relatively suddenly. This is suggested to be due to the rapidly increasing negative feedback from the rising humidity in the tropical atmosphere, as Tropical oceans reach daytime SSTs of around 28 C, from the 23 C or less of the glacial phase. As a result the exponentially increasing power of tropical region’s powerful evaporative control rises to a level capable of minimising further increases from the cause of submarine volcanic heat. Achieving this saturated tropical climate at the equator, characterised by precipitation rather than temperature, appears to define the stable upper level of ice age cycles. The 4 degree higher polar temperatures observed in the Eemian are thus more likely to be the result of a tropical climate extending towards the poles to lose the excess heat at a greater rate, rather than from higher SST’s of above 28 deg K at the Equator. This is supported by the evidence of more exotic fauna over a wider latitudinal range during the Eemian, such the well known remains of Hippos, Lions and Elephants across Northern Europe dated to the last interglacial event. Also note the extra 4 degrees was well controlled in the record.”
Pre pub here, but this is the early version. http://dx.doi.org/10.2139/ssrn.3259379
Thanks, Brian.
w.
This explains the unusual thermal stability of the climate system.
“Unusual” compared to what? Past climates? Climate on other planets? Possibly “marked” or some other term than “unusual”.
When viewed as a heat engine, one of the most unusual and generally unremarked aspects of the climate system is its astounding stability.
Standard practice would include a relevant literature review section. Your references provide a starting point for such a survey.
Thanks, John. Perhaps “unexpected” would be better than “unusual”.
As to a “literature review”, as far as I know I’m the only person writing about the idea that the temperature of the entire globe is thermoregulated, rather than being free to take up any temperature and at the mercy of changes in forcing.
What “relevant literature” would you suggest that I include?
w.
https://www.sciencedirect.com/science/article/abs/pii/0921818189900179
https://agupubs.onlinelibrary.wiley.com/doi/abs/10.1029/JC086iC10p09776
https://link.springer.com/article/10.1023/B:CLIM.0000037493.89489.3f
https://www.icevirtuallibrary.com/doi/abs/10.1680/cien.2007.160.2.66
https://advances.sciencemag.org/content/6/19/eaba1951.abstract
Thanks, Charles, much appreciated.
w.
Literature on climatic homeostasis is legion:
https://www.sciencedirect.com/science/article/pii/S1007570419303090
A source for some literature, to include textbooks as well as papers:
https://en.m.wikipedia.org/wiki/Gaia_hypothesis
A goal of literature search is to argue for the originality of your hypothesis.
As far as you know it is, but that’s why a literature search is SOP, in order to ascertain that assertion.
Perhaps compare and contrast with Lindzen and other similar hypotheses:
https://en.m.wikipedia.org/wiki/Iris_hypothesis
Thanks for both the links and the suggestion, John, good stuff.
w.
De nada. Good luck!
Stable, warm temperature on centennial scale isn’t unexpected in an interglacial.
Again, unexpected by whom? Consensus “climate scientists”?
Stable to ±0.2%? Not seeing it without some thermoregulatory mechanism, thanks.
w.
There are homeostatic mechanisms, for sure. But they’re not powerful enough to keep glaciations from happening. However within each climatic state, self-regulating factors operate.
Stability for centuries and millennia is but a blink of the climatic eye. Earth’s climate has been everything from global ocean of magma under a metallic atmosphere to iceball.
HI Willis, excellent and thought-provoking post. I would definitely include the granddaddy of all journal articles on thermo-stability, Newell and Dopplick:
Newell, R., & Dopplick, T. (1979). Questions Concerning the Possible Influence of Anthropogenic CO2 on Atmospheric Temperature. J. Applied Meterology, 18, 822-825. Retrieved from http://journals.ametsoc.org/doi/pdf/10.1175/1520-0450(1979)018%3C0822%3AQCTPIO%3E2.0.CO%3B2
Thanks, Andy, hadn’t seen that one.
w.
Leave out as much qualitative language as possible and replace it with simple quantitative statements.
This explains the unusual thermal stability of the climate system.This explains the thermal stability of the climate system – ca. 1.5 degrees K for the past 10,000 years.
Good plan, I’ll do that in a variety of places. You’re right, numbers rule.
w.
I was looking for this reply 🙂
Things like “lowly” dust devil are all unnecessary and the current version of the paper is full of this.
Also …references? You’re probably a couple of hundred short.
I don’t think the paper reads like a scientific paper as it is. It’s more an opinion piece and every argument you make must be backed by a prior scientific result to have scientific merit.
We have already explained in an AMS presentation last January, what determines the long-term stability of global surface temperature of a planet using NASA data and Earth’s geological records. There are 2 factors defining the baseline (long-term) temperature of a planet: TOA solar irradiance (i.e. distance from the Sun) and total surface atmospheric pressure. As long as these factors are constant (or nearly constant), the baseline global surface temperature will remain stable. Watch this video for details:
Implications of a Semi-empirical Planetary Temperature Model for a New Understanding of Earth’s Paleoclimate History and Polar Amplification
The stability of the climate system is real, it is not unusual, it is not unexpected, it is simply not understood or accepted by mainstream peer reviewed consensus.
I believe Willis has a best understanding of the Tropical Climate Stability.
IR out in polar regions produce sequestered ice. Tropical energy is transported to Polar Regions by warm tropical ocean currents. That energy powers the conversion of water to ice. Ice is sequestered on land in Polar Regions and high mountains. Ice spreads and reflects and thaws and provides additional cooling that is not considered by Willis.
Try “remarkable”, it’s why you,re writing. Mention the poles, as those are where the regulating currents are going.
Wish i could help, as I’m in violent agreement with your posts.
But sadly lacking such skills or background.
I would only embarrass myself.
My people!!
I went ahead and embarrassed myself anyway. Clarity is always good, even if the muddiness is on my side.
Prediction 3. Transient decreases in solar forcing such as those from eruptions
======
On longer scales this would also apply to changes in CO2.
This would explain the finding some years ago by econometric analysis that CO2 effects were transient.
True observation, although it would likely go better in another section.
w.
“On longer scales this would also apply to changes in CO2.”
The one variable that Willis cannot measure is the slight change in emergent timing each day. Can satellite data determine if an exta 5 minutes of daily thunderstorms have happened over the past 50 years? In theory, imo, the global avrage temperature would rise just slightly, but no where what has been expected from our added CO2.
Prediction 4. The “climate sensitivity”, far from being a constant, will be found to be a function of temperature.
======
Prediction 3 is a special case of Prediction 4.
I’ll have to think about that one, Ferd.
w.
Willis ignore the “special case”. I misread prediction 4.
Possibly a function of many variables? I should think- not being a scientist- that more variables would result in more stability?? So, if one changes substantially, like “carbon pollution”- it’s effect is not on the same scale as its change?
I would say that ‘emergence’ is another way of saying ‘the devil is in the details’, meaning you can explain it after the fact, but not before the fact because higher level generalizations&approximations of theory&data smooth over those details.
Isn’t it merely that the properties of water with the fixed points at which it changes state and the latent heat involved what provides the underlying stability?
Self-regulation is to be expected on a water world, yet Earth’s present climate system switches among different states, ie glacial maxima, stadials, interstadials and interglacials.
The climate system clearly exhibits stochastic resonance. Long periods of stability in an attractor state between short periods of rapid change to a new attractor state brought on by a resonance of noise and first order variables.
The climate system does not change states. The climate system has internal responses and the perceived different states are just different phases in the loner term cycles. When much tropical warm water flows into the Arctic, Increased IR out producing sequestered ice on the continents initates ice ages and the the cold phase of the cycle follows while the ice spreads and thaws and depletes. More IR out from the Arctic cools the climate systems, later when the ice reflects and thaws.
That’s key, imagine a planet where all is identical other than atmospheric pressure is say double our world. From what I see the upper temperature achievable of the ocean would be higher than the notional 31C we tend to observe, or alternatively, a lower pressure atmosphere would yield a lower “maximum ocean temperature”.
The point being that it the equatorial ceiling temperature that sets the stage for the width of the Hadley cells etc.
This is a sensational paper but Willis it’s a tree falling in a forest with no ears. May my pessimism not be rewarded.
If the planet imagined also has identical reserves of water, water vapour should vary the atmospheric pressure with the same effect it does here.
The cooling depends on the circulation of the water. If the primary circulation is around the equator the planet would be warmer as earth was fifty million years ago. If tropical water is circulated in polar regions to thaw sea ice and get additional IR out and if there was land in the polar regions to sequester ice, it could be as we are now.
Willis – I think we have a typo here…
“and millions of work-hours being throw at the problem”.
Should be ‘thrown’, not ‘throw’.
Thanks, Chris. I hate typos.
w.
Actually better to remove that phrase altogether even if you have evidence to show that it is true (which you don’t). The amount of effort spent doing something, no matter how right or wrong, is irrelevant to the argument being made.
I’ll likely remove the phrase, for the reasons given to me elsewhere.
However, it seems to me that if you spend millions of dollars, millions of work-hours, and billions of computer cycles working on a problem for forty years and at the end of that time your uncertainty is GREATER than when you started, something is seriously wrong.
On the other hand, if you spend $10, ten work hours, and an hour of computer time working on the same problem without results … well, that doesn’t mean much.
So it seems to me that the amount of effort spent doing something is quite relevant to the argument being made.
w.
Number of publications would be a proxy for hours
Remove personal pronouns. The royal “we” and “our” are preferred over “my”.
the royal consensus? :-}
That has been the style for publications in the past. However, that has been loosening up in recent years. It also varies with the publisher.
Most papers are collaborative efforts, so end up as being ‘we’.
I think Willis is working in solitary mode.
R
Thanks Willis,
Quick editorial comment. The showpiece scatterplot at the top of net downwelling vs surface temperature has the caption “The slope of the lowess smooth at any point is the climate sensitivity at that temperature”. Some people might take issue with reference to a “slope” at a “point”. Perhaps this wording could be revised.
To hammer home the concept of emergent phenomena reinforcing thermoregulation and system stability you could clarify what you propose is the primary cause of the system (temperature) stabilising at the current level. Is it an hydrostatic equilibrium conceptual framework? I realise this may be outside the scope of the paper.
Congrats on presenting the draft document.
JCM
The “slope at a point” of a curve is well defined if the curve satisfies certain requirements which, in non-mathematical lingo, ensure the curve is “smooth.” Construction of a lowess curve meets those conditions, and more.
Thanks, Needle, beat me to it.
w.
While that may be technically true, I think the graph and caption is unclear about how I can use it to find climate sensitivity. Most readers will skim over most articles and if the showcase plot isn’t immediately clear it will be dismissed. my two cents. regards.
Maybe i’m over analysing, but the more I look at it the more confused I am. All I see is that “net downwelling surface radiation” is some function of “surface temperature”, and vice versa. Where is the lamda “climate sensitivity” listed. It’s in the slope at a 1D point location? What is “net downwelling surface radiation”, exactly?. Maybe it’s just me over complicating this, I seem to be the only one having this problem.
I see it’s in the text “net downwelling radiation at the surface”. So what I’m seeing is that for a change in “net downwelling radiation at the surface” there is an associated change in temperature. This is not measured at a point, it is a delta between two values. The figures should be labelled carefully and precisely. The graph shows that temperature no longer increases with increases to net downwelling radiation above 625 W/m2 or so.
JCM, the central equation of the climate paradigm is:
∆T = λ ∆F
where T is temperature, F is forcing, λ (lambda) is climate sensitivity, and ∆ is the “change in” operator.
So yes, it is a delta between two values.
w.
ok I see what you’re getting at. I might suggest that in your paper you discuss a bit about CERES EBAF data and what it really is. It is satellite brightness temperatures transformed to flux by calibrating to GEOS-5 simulation. GEOS-5 relies on temperature and humidity outputs from GCMs, or at least it used to be.
In a nutshell, any satellite data does not measure flux directly. They merely measure the spatial variation of intensity of radiation or reflection from different wavelengths and polarities, usually expressed as a brightness temperature. This raw data must then be run through a model to output physically meaningful units and it’s not just a direct linear transform. This process should be considered in detail prior to the analysis in order to fully convey the limits of the data, uncertainties, and dependencies.
True. All of that is covered in the CERES documentation, which I should link to, as well as the Berkeley Earth and the Reynolds OI documentation.
w.
JCM, you say “is it an hydrostatic equilibrium conceptual framework” …
No clue.
w.
You said: “As the sunshine further irradiates the surface, instead of getting more temperature we get more dust devils.”
I am not aware of any studies that actually show this.
Conclusion could be suggested by this:
https://www.researchgate.net/publication/249609878_A_Simple_Thermodynamical_Theory_for_Dust_Devils
Or maybe implied.
perhaps ‘more heat’ but ‘higher temperature’ ?
Willis, a suggestion. Drop dust devils and stick with thunderstorms. Two reasons. 1. They are familiar to all. Nobody in Florida knows what a dust devil is. 2. They cannot be modeled by climate models.
To do a good job on Tstorms, grid cells need to be 4km or less (doable with regional weather models out a few days). Due the computational constraints imposed by CFL, this is not possible to do in global climate models for a century—several orders of magnitude computational intractability. As a rule of thumb, NCAR says halving a gridcell x-y results in 10x the computation intensity thanks to CFL constraints on numeric solutions to,partial,differential equations. The typical CMIP5 resolution was 280x280km at the equator (my previous posts on models here). Just checked; the typical CMIP6 is 250x250km at the equator. Still off by ~six orders of magnitude on the biggest baddest superduperest super computers that exist today.
So Tstorms are parameterized. But as you nicely show, there is NO one Tstorm parameter since it varies during the day and by season.
In parts of the UK these are known as Hay Devils. Presumably because they are more common in summer when there was dry hay to play with.
https://www.bbc.co.uk/news/av/uk-england-bristol-48882596
Or call them Dry Waterspouts.
Haha.
I have called them “Saskatchewan Waterspouts” since I saw one stirring up alkali dust from the partly dessicated lake bed of Old Wive’s Lake during one of the droughts that periodically descends on the prairies.
Regarding the tropical thunderstorm system, when I fly over the Carribean, I watch thew with awe… so high and so turbulent. Any image of the Earth from space shows a line of them following the sun across the ocean. There might be a way to measure the difference in longitude from the sun’s position to a given width of cloud formation and compare any variation with sea surface temperature changes.
I agree: drop the dust devils.
Thanks, Leif and the others. As with many of the things that I know about the climate, I know that the dust devils arise when there’s a large horizontal and vertical thermal gradient for a simple reason.
Direct observation. Yeah, I know it’s just anecdotal, but still. I’ve closely obverved dozens and dozens of them, both on land and at sea (waterspouts).
I also know, from the same source (observation) that they transport surface heat and warm air vertically, cooling the surface through both increased evaporation and vertical transport of warm surface air.
My thanks to John Tillman for pointing to a study which says the same thing. However, I agree with you and Rud that it should likely be dropped.
Thanks for the good suggestion.
w.
I would think that anyone reading your paper would know what a dust devil is, even Floridians. I have a dust devil antidote. I once hiked to the top of Mt. Sacagawea near Bozeman Montana. Just as I got to the peak I saw a dust devil (it might not have been a big enough swirl to qualify as a dust devil in some official sense). If someone wanted to study dust devils, perhaps a mountain peak might be a good place to wait for them to form.
Perhaps the term could be “thermals”? Certainly understood by pilots and bird watchers.
“Electric Dust Devils
The electrical character of dust devils and tornadoes is rarely mentioned. In fact, researchers only recently began to examine the electrical nature of dust devils in an effort to understand what is happening on Mars. Mysteries still surround electrical activity in our atmosphere. For example, the Earth has a vertical electric field, in the order of 100 volts per meter in dry air, whose origin is unknown. And scientists do not know what causes the most obvious electrical phenomenon in the atmosphere –’ lightning.”
Electric Dust Devils – holoscience.com | The ELECTRIC UNIVERSE®
I know this is a mere comment detail. But with respect to lightening we have known the basic physics since Helmholtz elucidated it in 1888. It results from the Helmholtz double layer static dielectric effect (in Tstorms from static friction between any two phases of water — think carpet shuffling and doorknobs), and is the basis of all commercial EDLC capacitors, a $multibillion industry in which I have several very basic US (and Korea, and Japan, and Russia) issued storage materials patents.
And you Rud can explain how that electrostatic charge happens to be there in atmosphere.
I my self see it as very simple to explain, and maybe it could give WE some idea about his work.
Oh well you seem to have explain it… sorry, missed it!
It is simply due to the thermal flux and thermal currents.
The thermal gradient, “produces” an electrical gradient, due to the high energy exchange.
Sure, you know what electricity is!
cheers
Oh, Rud still keeps believing of him being a good man… Hilarious… !!!
cheers, not!
Willis, I hope for the best that you at least try to understand the concept of “vanity”…
The favored sin, as per Devils advocate.
DON’T DO IT…!
Let it be without you playing the “prostitution game”… please… do consider!
Frack them Whores for everlasting!
Do not commit to their wrong, by validating their deceptive platform structure as with some merit in truth or reality… by some pleading or appeasement.
Well, still find kindness in your self, to
forgive such a blatant, direct request!
Don’t Fracking do it!
Respect to whatever you decide!
cheers
The Mars Dust Devils may add to the climate there since thunderstorms don’t exist.
I think what Willis mean is that : past a certain point, there will be no more temperature increase. ie. it will get to 45 degrees C, and then instead of rising to 46 or 47, there are dust devils created
The tight correlation between the surface temperature and the downwelling radiation
========
Isn’t this an expected result independent of emergent effects? Not sure this advance your theory
Ferd, the tight correlation is expected. So that validates both the CERES and the Berkeley earth datasets. However, the change in the slope proves that the “climate sensitivity” is not a constant, and that in fact it goes negative at the highest temperatures. This is not expected from the current climate paradigm.
Thanks,
w.
Yes, my eyes missed the negative correlation.
I would recommend blowing up the scale on the top right of the graph because it tends to get lost.
This is great Willis. I forwarded it to Adrian Bejan and others.
BTW, off topic, fountain of youth (TRIIM-X) trials ongoing.
One item I didn’t see was the percentage of the planetary energy budget subject to emergent phenomenon.
If it is 1% then it can be dismissed. If it is 50% then it seems easy to accept the effect cannot be ignored.
Excellent point. I’ll take a look at that, although the numbers will be subject to large uncertainty.
Regards,
w.
Ferd, great suggestion, but maybe not reliably calculable because of uncertainties.
BUT, I went back to my analysis of Trenberth’s famous energy balance 2009 paper in essay Missing Heat in ebook Blowing Smoke. Added up all the stuff he claimed due to emergent phenomena (clouds, Tstorms, other emergent convection stuff…). Answer appears to be 206w/m^2 on 341. SO, up to 60%. QED using only their stuff. Willis, use as you may. Even Tstorm alone per Trenberth 2009, clearly labeled separately as such, is 80/341 or 24% by itself. NOT Trivial.
My essay critique of this paper/diagram was that the uncertainties summed to several times the net energy imbalance estimate, so utterly useless.
Thanks as always, Rud, I’ll take another look at Trenberth’s paper.
w.
“the long-term change in global temperature is given by a constant called “climate sensitivity””
This is a long-running issue, but you need to define what you mean by climate sensitivity. They won’t (or shouldn’t) let you avoid that by just putting it in quotes. The ordinary, well-defined meaning, is equilibrium climate sensitivity, and that is not to be found by the methods used here. There is a defined notion of transient climate sensitivity, but in each such case you need to define an associated scenario – eg steady warming over 70 years.
It’s no use claiming that “climate sensitivity” is dependent on temperature unless you show how to quantify it.
Thanks, Nick, you’re absolutely right. I need to define it. However, Figure 4 shows the long-term effects of the downwelling LW+SW on the surface temperature, as they have had thousands of years to achieve the 20-year average temperatures shown in that figure.
w.
I think one challenge is that the usual “climate sensitivity” is global, whereas Willis is presenting a local version. This makes comparisons difficult.
I would also cite the Sherwood et al. 2020 paper on climate sensitivity somewhere (doi.org/10.1029/2019RG000678) as the most recent overview paper of the mainstream climate scientists. Note that the “standard” climate community approach does include the likelihood that some kinds of tropical clouds provide negative feedbacks, so I’d be curious about a more in-depth comparison of that.
Finally, it would be useful for your claim to discuss how the climate shifted between glacial and interglacial temperatures, and how global temperatures were substantially warmer before 3 million years ago. One issue is how tropical warming is balanced with extra-tropical warming – e.g., you can get a lot of “global” warming or cooling with very little tropical temperature change.
As an alternative to Nature, I might suggest Earth Systems Dynamics or some other similar journal. One benefit of ESD is the public, interactive review.
(as an aside: I think the analysis is really neat, I’m a little more dubious about the broader claims, so if I were writing this paper, I would make it much more targeted, but i recognize that’s not what you are interested in)
[fixed typo in email-mod]
Willis, I wonder what the effect is of lightening discharge in these tropical thunderstorms? The lightening bolts are 20,000 to 25,000 deg C, four or five times hotter than the surface of the sun. The internal circulation of a cumulo-nimbus cloud generates the accumulation of this energy, and it discharges either cloud-to-cloud or cloud to surface (some videos suggest surface to cloud?). Large tropical thunderstorms present an impressive lightening display for hours. The additional complication of more intermediate latitudes is the accompanying discharge of hail, which is truly and oxy-moron (or moron-moron?) as the 25,000 de C is accompanied by frozen water. Good luck with your publication.
Thanks, Ron. I’ve looked at total lightning discharge. On a global 24/7 average it’s not that great. However, it does increase loss, since something like half the light goes out to space …
w.
I reviewed your document and put the word file on Dropbox.
https://www.dropbox.com/preview/Public/EMERGENCEEMERGENT%20CLIMATE%20PHENOMENA–law.docx?role=personal
If the link doesn’t work, I can send the Word document to your email if you provide it.
Lance Wallace
lwallace73@gmail.com
Dropbox said no such document, all that came up was the Diesel Duck folder, go figure. I’ll email you.
Thanks,
w.
Willis Please email draft doc to me at David L Hagen @ gmail dot com.
Willis, Lindzens ‘adaptive infrared iris’ published if I recall correctly in 2010 is an early emergent thermoregulatory hypothesis involving thunderstorm generated high cirrus. You probably want to include it. Judith Curry and I did a paired posting on it over at Climate Etc a few years back. Contains reference to the paper. (Just useher search tool on adaptive iris.) She interviewed Lindzen about the paper’s history, I commented on a then new climate model modification in Germany that incorporated the adaptive iris and resulted in a significantly lower ECS.
Rud, I agree. Lindzen’s Adaptive Iris theory is similar, but not identical.
Willis, I would concentrate on tropical thunderstorms since that is what can change the radiative budget of the planet and would be a negative feedback to an enhanced greenhouse effect. Or is it more than a negative feedback? Does it set an effective limit on how hot the plant can get? If CO2 causes warming, thunder storms just start earlier and reflect more sunlight, to counter act all of the greenhouse effect.
The same phenomena occurs on summer days in areas with a continental climate, so you should mention that it’s not just limited to the tropics. I remember eating an early dinner in a restaurant on the top floor of a skyscraper in Chicago in the summer in the mid 1980s. From that vantage point, I could see a large thunder storm pop up and move across the countryside.
You should consider asking Richard Lindzen to coauthor the paper with you. You still get the credit for the idea but it’s more likely to be published and he has lot’s of experience with writing papers for the climate community. I have Richard email address. I would be happy to share it with you. Charles can give you my email address.
By the way, relative humidity at ground level often goes down durning a thunderstorm. I think it is due to water vapor condensing on cold rain droplets, and to the fact that the falling rain brings air with it. That air was saturated at cloud level but it’s absolute humidity was low. When it mixes with warm air near the ground the result is drier air.
“…I would concentrate on tropical thunderstorms since that is what can change the radiative budget of the planet and would be a negative feedback to an enhanced greenhouse effect. Or is it more than a negative feedback? Does it set an effective limit on how hot the plant can get? If CO2 causes warming, thunder storms just start earlier and reflect more sunlight, to counter act all of the greenhouse effect.”
What I read in the paper, the emergent phenomena make CO2 TOTALLY IRRELEVANT!!! How? He already said that, “Thunderstorms function as heat pipes that transport warm air rapidly from the surface to the lifting condensation level where the moisture turns into clouds and rain, and from there to the upper atmosphere without interacting with the intervening greenhouse gases. The air and the energy it contains are moved to the upper troposphere hidden inside the cloud-shrouded thunderstorm tower, without being absorbed or hindered by GHGs on the way.” In other words, a thunderstorm punches a hole right through the atmosphere, transporting the required amount of heat to the required places, regardless of the composition of that atmosphere!!! And Willis, I think you should emphasize that harder, louder, in bold, with italics, and a couple of foot stomps just for good measure.
I recall reading something in the last few months, right here on WUWT IIRC, explaining just how remarkable is the stability of this planet’s climate, and used as an illustration an internal combustion engine running to that steady state even under varying load! I think it mentioned the cruise control on my automobile as well. Was that your work, Willis? Seems to me the writing style I recall was more like Monkton. Gently plagiarize some quotes from that, use a few paragraphs worth but beef them up to standards for an academic paper, just to emphasize what a big deal this is!
Willis, I don’t mean to be discouraging, but based on the comments I have read so far it looks like this paper is about 20% complete with respect to being ready for submission. But I agree completely with this hypothesis, and I want to see it pursued to completion! Thanks for all your hard work!
Oh, one more thing, in Figure 6, Downwelling Radiation vs. Temperature, it is such a tight correlation just by Mark I eyeball, but wouldn’t it be even more impressive to show an r-squared?
Above I suggested discussing that hypothesis among other similar instances in a literature review section.
Thanks, Rud and all. You’re right that it should be included in a literature search. However, it is only a minor part of the temperature regulatory power of thunderstorms, which cool the surface by that and a number of other mechanisms.
w.
Willis, your point is part of what gets you ahead of Lindzen. See a more detailed mechanism comment below for details.
Hi, Willis.
Very nice and written well enough that I could follow along and envision the actions of your descriptions and predictions. No small feat, that – you are a talented writer; please keep it up.
I’m not a climate scientist (whatever that is), but I am a retired scientist in biomedical and I read a bunch in that arena.
a nitpick and a suggestion
nitpick – you have written everything in the 3rd person (excellent) except for 2 places in 1st person. Keep it all in 3rd person – shows objectivity rather than subjectivity.
Evidence validating the third prediction –
Regarding the third prediction, my theory solves – change to this theory …
in CONCLUSIONS –
4) My theory is that – change to the proposed theory is …
suggestion – have a few illustrations particularly of clouds and your hypotheses. Don’t leave it readers’ imagination – show and tell.
Best of luck.
Keep it all in 3rd person
=========
Yes. Reads much better.
As always fine work Willis. Here are my humble quibbles on a first quick read.
Reis and Bejan quote. Take the dash out of “atmo- spheric”.
In your Prediction 3, add the word “volcanic” so it reads ” those from volcanic eruptions”. My brain stuttered a moment while I figured out that you were referring to geologic rather than dermatological eruptions.
I stumbled on the phrase: “If you lived somewhere that there were never clouds”. It gains some grace if reads “If you lived in a cloudless place”.
Thanks for letting me nibble around the edges of a paper I am grateful you have chosen to prepare.
Good suggestions, modifications made.
w.
Could you include a plot of “climate sensitivity” versus temperature as described in Figure 6? You might also rename it “temperature response” to avoid confusion with CO2 effects.
Interesting though, and quite possible.
w.
Willis,
I’m no scientists but I suggested some time ago this was the way science should be heading, for an open, public peer review system.
I guess it’s difficult for confidential matters or those with IP issues, but if most other science was peer reviewed publicly, perhaps it would free up the time of regular reviewers to provide more than a cursory glance at papers.
Don’t the Donnelly’s run an open type of peer review?
Yes they do, their papers are there.
“Stratification is replaced by circulation, bringing new water to radiate, cool, and sink. In this way, heat is removed, not just from the surface as during the day, but from the entire body of the upper layer of the ocean.” I like that, many marine papers I read don’t know seem to know about nocturnal operations.
Also like this one. I think Reid taught me physical oceanography. DiMarco, S. F., M. K. Howard and R. O. Reid. 2000. Seasonal variation of wind-driven diurnal current cycling on the Texas-Louisiana continental shelf. Geophysical Research Letters. 7(7):1017-1020.
Shelf currents have a strong onshore component most of the night, but offshore most of the day. It was not apparent from the wind.
Thanks, H. D. I learned about nocturnal overturning of the ocean in my usual manner—direct observation. If you do a night dive in the tropics after midnight or so once the overturning is established, the difference between the large slowly upwelling areas and faster-descending, smaller downwelling columns is quite evident.
It’s both my blessing and my curse that I have exactly zero formal training in climate … or anything really. I took Physics 101 and Chem 101 in college, and that’s it.
The curse is that my knowledge has no traditional written underpinnings, in that it comes from a lifetime of spending a lot of time outside and observing the weather.
The blessing is that I have no preconceptions about how things work, which has let me figure them out on my own without following previous wrong paths, for better or worse.
w.
I know a now retired fisheries biologist who worked his way up in a federal fisheries lab from a helper, only had an junior high education. This was a relatively recent surprise to me when I asked him where he went to school. His name on important work. It’s not the impressiveness of your resume, but the quality of your work!
You figure them out quite well Willis, the actual difference is you notice the real world effects you experience, academic’s do not, the difference is the curiosity factor, you ponder your experiences, academics dont even notice the phenomena.
The snod-ification of academia will get you tho, as you say your lack of anything formal as per qualifications,
Wills, this is a keeper for me to discuss with youngsters the amazing observable weather phenomena that naturally occur, and the wider purposes and effects they produce.
Just 2 non-technical suggestions from me –
When you write
Could it be better phrased – “If
youone lived somewhere that there were never clouds,youone likely would not predict that a giant white object might suddenly appear hundreds of meters aboveyourone’s head.”I say this only because you’re intending submitting to academic journals, where passive literary styles may be more in keeping than everyday narrative styles. ?
Also, is there any chance you could submit this work under a pseudonym, given the certain automatic denial of the probity of your work by “establishment” peer reviewers?
I agree about the passive voice and will change it … grrr. I’ve commented before that I feel like I have to give myself a lobotomy to write in the journal-preferred style.
However, I won’t submit anonymously. I always sign my own words, even if it is with the simple “w.”. Take me or leave me as I am. Plus which, I’m the only guy I know of talking about emergent phenomena, so I’d likely be recognized …
In that line, however, my suggestions for peer review restructuring would include double-blinding (neither the author nor the peer-reviewers identified during the review), followed by double-unblinding (author and the peer-reviewers both identified when the paper is published).
Thanks,
w.
This should be an absolute, non-negotiable condition of any work being submitted for publication.
Biases just don’t get a co-pilot seat at the screen that way.
passive voice
===========
Willis, academia loves verbs that end in “ing” because they make BS sound like fact.
The active voice is preferred when you have facts to convey and are prepared to back them.
“when you have facts to convey and are prepared to back them.”
THAT would be an anomaly, the journals wouldn’t know what to do! 🙂
It isn’t just academics who love passive voice. Banks and other institutions like it because it defers responsibility: “It was found that an error occurred in your account.” (or) “An error has occurred in your account…” Instead of the more direct “Stan Smith made an error in calculating your account. He’s been fired and the error corrected.”
Passive voice is universally considered a weaker sentence structure than active. A commenter (above?) suggested a revision as follows:
Agree that Willis should get rid of the first person throughout his essay, but substituting a passive construction taking two steps forward and one step back. Simpler is better. Try:
“Thermoregulation is provided by…”
I’m not a science / math person, but I do read technical papers sometimes, and the ones that lard on the passive voice structures really do no credit to objectivity, style or direct speech.
Willis and several other writers on WUWT are able to build strong technical arguments with many difficult underlying concepts… and draw conclusions that logically follow. Keep it simple for everyone who reads, including the non-scientist. If that’s off-putting for the style police who don’t like clarity and directness, or who dislike conclusions that don’t support AGW alarmism, who cares? The object isn’t to butter them up, it’s to write well and create a good analysis.
Hi Willis –
I have a couple of comments about your excellent draft.
It’s been a while since I dealt with academic papers, but I was always impressed with my professors who used a deliberately understated tone or voice in their papers.
You say:
“This lack of any progress in determining the most central value in the current paradigm strongly suggests that the paradigm itself is incorrect, that it is not an accurate description of reality.”
Since this is the introduction, and you don’t want to lose your audience immediately, I suggest something more neutral like “This lack of any progress in determining the most central value in the current paradigm is a significant problem, limiting its utility and may even suggest that the paradigm itself is incorrect. I.e. that it is not an accurate description of reality.” Your later conclusions still convey the full force of the argument.
Prediction 4 graphic has the caption: “Figure 6. Scatterplot, CERES net downwelling surface radiation (net shortwave plus longwave) versus Berkeley Earth global surface temperature. The slope of the lowess smooth at any point is the “climate sensitivity” at that temperature, in °C per watt per square metre (W/M2)”
That is fascinating. I looked at the shape of the curve to try to estimate the slope at various points. I wonder if you could create a second, related graphic that actually is the slope, i.e. the derivative of the above figure. It doesn’t look to me like the “climate sensitivity” is in the same units as I’m used to seeing in the other paradigm, like “ECS range of 1.5-4.5”, and possibly there could be a scale that relates your data to the other method of presentation?
Further on, you say “Since decreasing downwelling radiation cannot increase the surface temperature, the only possible conclusion is that in these areas, the increasing temperature modifies the number and nature of the overlying clouds in such a way to decrease the downwelling radiation.” May I suggest “Since decreasing downwelling radiation cannot increase the surface temperature, the more likely alternative is that the increasing temperature modifies the number and nature of the overlying clouds in such a way to decrease the downwelling radiation.” When people tell me “the only possible conclusion” I always start looking for others. Stick to your argument.
These are just small nits in what I think is a clear and coherent presentation. Thank you.
I hope it gets some circulation and acceptance.
– Eric
Thanks, Eric. Your changes are excellent and have been incorporated. You also say:
As you might imagine, I already have such a graph and have debated adding it to the paper. Here it is.
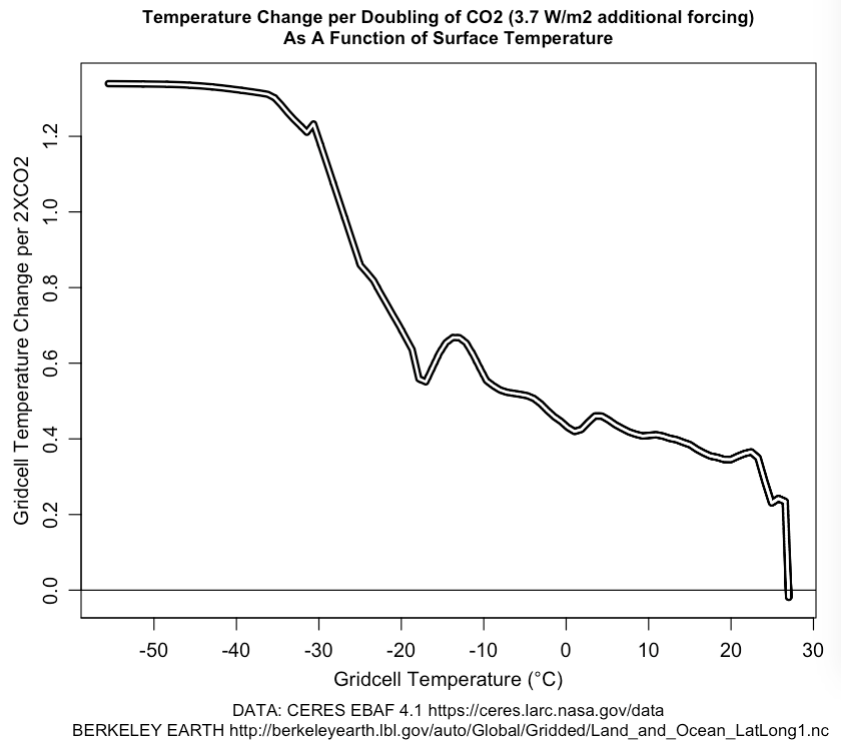
Worth including?
w.
Woerth including? That is debatable and troublesome.
Your graph shows climate sensitivity reaching zero. Many people have been dogmatic that sensitivity cannot be zero, so you risk having some of them turning off and stopping their reading of this rather important paper. Geoff S
Geoff
IF thermoregulation is real, then forcing sensitivity MUST reach zero.
Logically necessary to include.
Perhaps “asymptotic to zero” is more exact. Each successive increment in forcing may be countered more and more by the various emergent dynamics Willis discusses (eg the thunderstorms and the ocean layer overturning).
It would be an empirical issue as to whether the emergent mechanisms could “take on a life of their own” and once triggered by warming, in the end, produce net cooling,
My sense is that happens locally (eg the cooled ocean in the wake of the recent hurricane), but over time and space is not sustained for a global system.
Well, I’m with the people that say, “Calculating an average temperature of the globe is nonsense.”, and as such you cannot calculate an average climate sensitivity, neither ECS nor TCS. This graph just hammers home that point.
More importantly, Willis shows that the derivative (slope, forcing sensitivity) GOES NEGATIVE at the highest temperatures, (not just approaches zero). That appears to correspond with Richard Lindzen’s “Iris Effect”. Lindzen, R.S. and Choi, Y.S., 2021. The Iris Effect: A Review. Asia-Pacific Journal of Atmospheric Sciences, pp.1-10. https://link.springer.com/article/10.1007/s13143-021-00238-1
I thought it would be worth including because it helps clarify the temperature/feedback relationship that is your central point. Now I’m not sure. There were some comments that pointed out the Tropics vs Global issue and the question of negative feedback on a global scale, and others that spoke about ambiguous definitions for climate sensitivity, ECS/TCS/xCS.
I come to believe that any mention of “climate sensitivity” will detract from your effort. It will lead to endless debates about whether your definition of climate sensitivity matches theirs, which one is correct, and who doesn’t understand the other. This isn’t central to your theory. You don’t need/want an ECS figure anyway. It can’t be calculated because the feedbacks are temperature-dependent and therefore do not lend themselves to a scalar value. Maybe a second-degree polynomial function, best-fit to your data, could give an approximate effective feedback value for a given temperature (and location), with no claim that this represents a global equilibrium anything.
I would therefore remove the mention of climate sensitivity from the caption of Figure 6 (and everywhere else). Maybe just invent/define a new term to stay away from the inevitable word games that will result from using that old term in this new way.
Second comment/reply. The larger problem is the difference is overall conception of the climate system.
“Climate sensitivity” as a unitary global figure depends on the idea that the energy balance is unaffected by emergent phenomena (and most other things besides downwelling energy and GHG).
Your hypothesis on the other hand posits that as the earth warms these emergent systems regulate the max, and ultimately the average, temperature. They don’t appear at the same times, or at the same places. And the frequency/duration of their appearances will increase along with temperature. The heat pump mechanisms of the Earth (wind/currents) will then distribute the heat more uniformly over time. Your estimate of “climate sensitivity” would necessarily approach 1.0, by definition. The other paradigm must be higher. These are two different world views and the term climate sensitivity can’t mean the same thing in both. I recommend you not buy into the old paradigm and avoid the term and the old concepts entirely.
Yes, I think you should include this.
*doh!*
Let me make a complete 180 on this. Do not include this. Furthermore, as someone else said, remove all references to λ from any graph you produce for this paper. Why? Because as I already noted elsewhere, this paper shows that the AGW wishcasting as currently framed, a change in temperature resulting from a change in GHG concentrations, does not exist! So the climate sensitivity you talk about at the beginning of your paper, and as laid out in the references, is the change in temperature resulting from a change in atmospheric CO2 concentration. And as such, it’s irrelevant.
But most importantly, the Figure 6 graph from whence you calculated this “sensitivity” does not even include CO2 concentration, so that sensitivity cannot be obtained from taking a derivative. What’s in the graph? Net downwelling surface radiation is on the x-axis, but that may or may not depend on the concentration of CO2 in the atmosphere, as far as I know there is not research, data or proof as to how much the downwelling surface radiation changes with respect to a change in CO2 concentration. And the y-axis shows the resultant temperature at each given surface radiation value. So the “sensitivity” you have graphed via taking the derivative shows a different sensitivity.
Now, you can still leave your discussion of sensitivity at the beginning of the paper (though make it a little less confrontational as someone else suggested), but the rest of the paper then lays out the proof that that sensitivity is irrelevant to (maximum) surface temperatures, at least over substantial bodies of water.
Thought question… doesn’t this emergent phenomena also dictate that the temperature within the eye of ALL hurricanes, regardless of location on the globe or time of day, is always the same? Right at the limit which instigates this particular emergent phenomena (I’m going with, a hurricane is just an organized accumulation or gathering of multiple thunderstorms.) Right?
4) My theory is that the thermoregulation ….
perhaps the less subjective
“Proposed hypothesis is that the thermoregulation ….”
Thanks, vuk, done.
w.
excellent.
cheers
Good read, a few thoughts to consider:
1) The emergent phenomenon you describe applies mostly to large bodies of water – landscapes may lack the necessary water or have significant interfering mountains that complicate the system you describe.
2) “As the sun continues to heat the ocean, around ten or eleven o’clock in the morning a new circulation pattern emerges to replace the random atmospheric eddying. As soon as a critical temperature threshold is passed, local Rayleigh-Bénard-type circulation cells emerge everywhere.”
I was under the impression that large-scale cloud formations occurred mostly in bands over the oceans, so again a complication that isn’t addressed. (or I am wrong)
3) There is no mention of angle of incidence other then the Sun “rising” from morning to noon – latitude also plays a big part. It seems to me that the angle that the Sunlight hits clouds (especially ice particles) would play a part in the amount of light reflected to Earth below.
4) The ocean serves to buffer temperature changes in other ways – in the morning it takes up heat and starting around noon to evening it releases extra heat. This buffering of heat is seldom ever mentioned but helps result in a more moderate climate. Rocks and soil do the same – this can lengthen the amount of time that water is being used to transport heat high up.
–
Maybe all of this is tangential to the purpose of your paper, but it would show that you considered such ideas rather than didn’t think of them.
Conclusion number five (5), specifically where you say ” or other changing forcings” is flat out wrong. You ask the question: “what causes slow thermal drift in thermoregulated systems?” which has already been answered by Milankovitch: https://earthobservatory.nasa.gov/features/Milankovitch You can see the effect in the ice core record due to the minuscule change in radiative forcing of ~0.45 W/m2
In other words Willis, you hypothesis fails to regulate the climatic effect of very small changes in TSI due to orbital variations.
.
You also need a different word than “emergent” because the subject phenomena of your hypothesis have been around for millions of years, and have failed to prevent the advance and retreat of glaciers. If they “regulate” the climate, they don’t do a very good job of it.
Small changes in TSI may cause shifts in storm tracks. Over time, all that is needed is a small place (like in northern Quebec) to accumulate a few more inches of winter snow than melt in the summer. 5 inches of ice per year? Over 1000 years, you now have an expanding region of 1/2 mile high ice, which will now accumulate ice year round – because it has a surface elevation of 2000 ft, which can then more quickly reach 10,000 feet, the pressure of which spreads the ice out and south. I would argue that it would take a major emergent phenomena to melt all this, causing our brief interglacials.
Most Milankovitch cycles don’t rely on change in TSI, but in insolation due to orbital and rotational mechanics.
Jut to be clear, it is the change in orbit that causes the TSI to change.
Where did you come up with that crap, Taguchi? The total solar insolation at 65° N (where all the land is) varies from 450 W/m^2 to 550 W/m^2 over the course of the Milankovitch cycles.
And tell us Mr. Meab, when 65N increases, doesn’t 65S decrease?
Hai Taguchi-san, but it is the 450 to 550 north of 65° that causes ice formation north of 65°.
Maybe. I would argue that it is the increased local precipitation more than the subtle change in insolation which causes the ice to build up. It would not have to be much, because we are talking thousands of years to accumulate.
Fred, Very good point. There was a theory published in the 1970s that posited an ice free Arctic ocean would cause more precipitation on land, and the gradual accumulation of snow, which would eventually become glaciers.
No, Taguchi. When the orbital eccentricity elongates, the Earth spends more time near aphelion and less time at perihelion (Kepler figured this out 400 years ago). Winters in one hemisphere will be much longer and much colder and summers will be much hotter but also much *shorter*. The percent change in insolation is about 4 * eccentricity. Presently, eccentricity is about .017 so the Earth receives about 6.8% more insolation during the Southern Hemisphere summer (because the Earth is closer to the Sun during SH summer at present). The Earth’s eccentricity gets as high as .0679 so the difference between the hemisphere’s insolation will rise to about 27%. That’s huge.
The hemispheres will still be out of phase BUT insolation over land areas counts the most in warming the Earth. 2/3 of the Earth’s land area is in the Northern Hemisphere – that’s why the global average temperature actually goes up in present times during the NH summer despite the fact that the Earth is closest to the sun during the SH summer. So, when the Earth’s axial precession puts NH winter at perihelion at a time with maximum orbital eccentricity, the whole Earth cools dramatically – enough for a global glacial advance as opposed to just a NH glaciation which can happen during other Milankovitch cycle conditions.
Taguchi, the impact of the Milankovitch cycles does NOT result from the tiny change in radiative forcing that you falsely alluded to.
You are wrong Meab. When the orbit elongates, the TIME spent at the DISTANT aphelion increases. Total energy drops because it is TSI times time. The TSI increases at perihelion, but since the time drops, the amount of energy decreases. It is an unbalanced difference.
That’s what I wrote, learn to read. Quoting ” When the orbital eccentricity elongates, the Earth spends more time near aphelion and less time at perihelion (Kepler figured this out 400 years ago).”
You are pulling stuff out of your nether regions. It’s NOT the global TSI that creates glaciation, it’s the TSI over land. You know, where grounded glaciers grow. Sheesh.
WRONG
.
You post: “The total solar insolation at 65° N (where all the land is) varies from 450 W/m^2 to 550 W/m^2 over the course of the Milankovitch cycles.”
.
Ignoring what happens in the Southern Hemisphere where MORE ocean area with a lower albedo than land areas.
Let me note that Roger Taguchi is up to his usual trick here. He takes some minor point and he spins it into endless disagreement. In this case, he has people spending loads of mental energy debating minor issues regarding Milankovich, which is only very tangentially related to the subject of the post.
Let me STRONGLY recommend that you do not feed the trolls, and Roger is assuredly one of them. Me, I’ve given up answering him directly. It’s an endless, joyless mudpit.
w.
I certainly root for this to be published in the most distinguished journals in existence. Failing that, how about aiming for popularity, in household magazines, trade journals, hobby mags etcetera? THEY will not easily give this exposure, but the battle is for the heart and mind of the “common man”, so publish where the “common man” reads.
One caveat; the graphs may need some more, er, colloquial captioning for such an audience, but the information as is should be comprehensible to most folk, given a little more background. (How does a model work, and how that ‘senstivity’ thing fits into it. One or two paragraphs?)
For this particular audience, this is near perfect, far’s my limited opinion matters.
P.S. Colour them pics, then make’em move. Apparently that is how today’s kids ‘read’.
Hi Willis – Great article – my suggestions are grammatical/clarity related only
You say “They are not naively predictable, as they have entirely different properties than the substrate from which they emerge. If you lived somewhere that there were never clouds,” – I suggest you say “If you lived somewhere where clouds did not exist — “
You say “The sun plus GHG radiation combine to heat the surface, which then warms the air. The low-density air rises.” – I suggest you define GHG here – then you don’t have to do it again
You say, “Thunderstorms function as heat pipes that transport warm air rapidly from the surface to the lifting condensation level where the moisture turns into clouds and rain, and from there to the upper atmosphere without interacting with the intervening greenhouse gases.” — here you say greenhouse gasses – if you defined GHG earlier it is proper to here just say GHG. Nitpicky stuff but ——
You say “Prediction 4. The “climate sensitivity”, far from being a constant, will be found to be a function of temperature.” I suggest you change to say “The “climate sensitivity”, far from being a constant, will be a function of temperature.”
You say “Prediction 5. In some areas, rather than the temperature being controlled by the downwelling surface radiation, the surface radiation will be found to be controlled by the temperature.” – same suggestion as above – recommend rewriting to say, “In some areas, rather than the temperature being controlled by the downwelling surface radiation, the surface radiation will be controlled by the temperature.”
Roger, wilco.
w.
Refreshing to see old fashioned predictions.
I heartily approve of your effort to publish, and I think that I understand what you have written. It is refreshing to see a reasonable hypothesis and theory for this complex system.
Along the lines of the Terry Pratchett character, however, to call me a peer is to call for more sawdust on the floor. In my sordid past, I have done engineering technical writing and editing, and have some suggestions along those lines not suited to this comment format.
My suggestions may not be appropriate for where and how you may intend to publish. Let me know, here, if and/or how I should send these to you, and correspond with you in a different way.
Willis, as one of your biggest fans, I hate to sound brutal on this, but believe me, the reviewers will be even more brutal, and forget Nature, even if you submit as Eschen Willisbach. Those immature, phony-scientists are still trying to get out of their political short pants since leaving university. I wish I had more time to work on this as I know I can help. In fact, this month I, and my colleagues, just had two papers accepted in seriously good journals after some fairly healthy reviewer critiques. I think the content is great but it’s just not written in Journal style and, as such, makes it a bit difficult (for me) to follow.
I just picked a paper that I thought was well written (when I first read it), for PNAS, that you could use as a template, whether or not you agree with the content: Feldman et al. (2014).
https://www.pnas.org/content/pnas/111/46/16297.full.pdf
I think if you rewrote the paper in that style, it would look fantastic.
If you’re not pissed off at me, I could help further, just not this week.
Pissed off at you? Why on earth would I be pissed? Brutal is honest, and honesty is what is needed in this situation. I’m not looking for kudos.
I had a “Brief Communications Arising” peer-reviewed (3 reviewers) by Nature, so I’m aware of their style …
Thanks for the example, looks good. I’ll study it when I finally work my way through the 100+ comments here.
w.
I knew you wouldn’t be but, you know, how beautiful one’s baby is can sometimes be a sensitive subject. I actually do get pissed off at some reviewer’s comments if they’ve obviously been a bit lazy.
Overall, an excellent paper. But there is one nit to pick:
[QUOTE FROM PAPER]”Note that the “climate sensitivity” is indeed a function of temperature, and that the climate sensitivity goes negative at the highest temperatures. It is also worth noting that almost nowhere on the planet does the long-term average temperature go above 30°C. This is further evidence of the existence of strong thermoregulatory mechanisms putting an effective cap on how hot the surface gets on average.”[END QUOTE]
Since most of the paper deals with the formation of thunderstorms over tropical oceans, which tend to prevent them from becoming too hot, the statement about “long-term average temperatures” never going above 30 C should be limited to areas over or near oceans, not anywhere “on the planet”, which can include some desert areas (Sahara or parts of southwestern USA) where average daily temperatures can exceed 30 C. Even over some bodies of water nearly surrounded by land, such as the Mediterranean Sea or Gulf of Mexico, average daily temperatures can exceed 30 C in summer.
Also, what is meant by a “long-term” average temperature? A diurnal average? A monthly average? A yearly average? The time period of the average should be specified.
In this case, “long-term average” means the 20 years Mar 2000 – Feb 2020. However, the result is the same for the last fifty or the last 100 years. And you’re right, I should have specified the time period, I’ll change that.
And over that 20-year period only 0.22% of the world’s surface averaged over 30°, tiny spots in inland Africa south of the Sahara.
It strikes me that an interesting analysis would be just how much of the globe is over 30°C, year by year. So many drummers … so little time.
w.
Maybe a nit pick – on dust devils – “First, it moves warm surface air upwards into the lower troposphere.” The surface air is already in the lower troposphere isn’t it? So “in” instead of “into”.
Figure 5. label vertical dashed line “Pinatubo”.
Thanks, Rick. Changed. Please note when I say “changed”, I’m changing the original not the blog post.
w.
Well for starters I think that most climate scientists would disagree with the first statement that
The current paradigm of climate science is that the long-term change in global temperature is given by a constant called “climate sensitivity” times the change in downwelling radiation, called “radiative forcing”.
The parameter or climate sensitivity is something that emerges from different climate models as a simple number that allows people to hide all the messy details. For example in your model there is still a climate sensitivity parameter only you are claiming that it is zero.
Secondly you appear to be confusing global and local effects. The climate sensitivity parameter as used is an average over the entire globe. So your discussion after prediction 4 is missing the point entirely. At best you would need to average your climate sensitivity at each grid cell to come up with an average climate sensitivity for the globe and then look to see if that global average varied with average global temperate.
In addition to which climate scientists already know that climate sensitivity varies with temperature. For example in Roe’s “Feedbacks, Timescales and Seeing Red” the climate
sensitivity parameter ignoring feedbacks is just the derivative of the Stefan-Boltzmann law with respect to temperature giving (his Eq. 3) 1/(sigma T^3).
There are also fairly fundamental issues regarding your model. Firstly the question arises as to timescales over which your emergent effects work. You describe a series of events such as thunderstorms, dust devils etc all of which emerge over the course of a day and so can only operate on timescales of 24 hours. Thus they should work to stop seasonal changes — your model clearly predicts that seasons shouldn’t happen since your thermo-regulatory system would act to counteract the reduction in forcing. But clearly seasons happen and result in local temperature variations of more than 0.2%. Hence the question would be why can your emergent effects stop global variations of more than 0.2% but not local seasonal changes.
Your model is also incomplete. It only discusses how energy is moved around the climate system. It does not say anything about how energy enters or more importantly leaves the earth. I could just as easily say that your model explains why global warming is more pronounced at the poles since all the thermoregulatory systems you describe take energy from the equator and shift it polewards. This would explain the fact that the arctic is warming faster than the equator, keep all of the mechanisms you discuss intact and allow for significant global warming. If you want to claim that you thermoregulatory system actually cools the earth then you need to couple it to a model of radiation and discuss the greenhouse effect in detail since that is the only way for energy to leave.
Also you do not show any evidence that the mechanisms you discuss are not already included in current climate models. Clearly they are not explicitly in them due to the size of the grid cells but if a modeller were to claim that such feedbacks are implicitly included as parameterised values for convection and cloud feedback or something similar and therefore there is nothing new in your model since it is already in current simulations how would you disprove them? You need to create a mathematical model for your feedbacks so that you can estimate the size of them and then compare them to the size of various parameters in the climate models.
Your final sentence shows that the entire premise is wrong. You ask
“what causes slow thermal drift in thermoregulated systems?”
to which the answer many people would give might be the rise in greenhouse gases. Nothing you describe stops an increase in greenhouse gases from producing a slow thermal drift. Dr. Spencer’s satellite measurements show a temperature rise of 0.13 degree rise per decade. How do you know this is not caused by an increase in CO2? You also make the misleading claim that temperatures have varied by less than one degree Kelvin. Most people would say instead that temperatures have risen by about one degree Kelvin. This difference is crucial to whether or not your mechanism is working. If there is a slow steady rise over a century then clearly your thermoregulatory mechanisms are not doing their job. If the temperature on the other hand has gone up and down over the past century while remaining roughly constant then your mechanisms might be working but then you have to explain how effects that only last a day work to slow temperature changes over a 50 year period but not any faster.
“Climate sensitivity is something that emerges from different climate models as a simple number that allows people to hide all the messy details.”
To hide messy details, it has to be built in – not to emerge from the same messy details.
Izaak,
I don’t believe that the emergent phenomena as described by Willis would have anything to do with seasonal suppression. The primary region for this proposed effect is the ITCZ. Thunderstorm formation anywhere outside of this is typically not due to the temperature reaching a high point, but rather lifting mechanisms: fronts, orographic lifting, advection, etc. Sure, there is some, but not the overwhelming majority. The transport of this excess energy from the tropics toward the poles via humidity or enso or whatever will increase the rate of energy leaving the system as a whole. Now, you can argue that the rate of energy transport from these emergent phenomena does not exactly equal the energy change radiated from earth, and I’ll listen.
You say “If there is a slow steady rise over a century then clearly your thermoregulatory mechanisms are not doing their job.” Or it could be that they are. These are not mutually exclusive. The mechanisms are primarily describing what happens in the tropics, and that region has not warmed.
Finally, I didn’t catch that part where Willis claimed that the rise in CO2 didn’t cause the rise in temperature, but I was reading it fast. I’ll read it more carefully now.
Thanks, Izaak. You say:
The problem is that nobody can agree on the value of the simple number. But it’s worse than simple disagreement. As I pointed out in “Dr. Kiehl’s Paradox”:
So this “simple number” as you put it, differs by a factor of 2 to 3 but they still get the right answer? Really? And you find nothing at all curious about that, to you that makes sense? Because to me, it says something is wrong with the theory.
Next, you say:
Nope. I said very clearly that there is a climate sensitivity, but it is a function of temperature, and sometimes is less than zero.
You say:
Per S-B, the change in temperature corresponding to a doubling of CO2 (3.7 W/m2) is 0.8°C at 0°C, and 0.6°C at 30°C. So you are correct, and I do need to clarify that statement. But no one uses those figures.
On the other hand, my own figures show that the change in temperature corresponding to a doubling of CO2 (3.7 W/m3) is ~0.5°C at 0°C, and by the time you get to 30°C, it’s gone negative. So clearly, we’re talking about different things.

Note that at the point where the emergent thermostat really kicks in, which is at about 26-27°C, the temperature sensitivity falls off a cliff.
You say:
First, the cloud radiative effects include the clouds sending energy directly back out of the system via reflection. Next, thunderstorms transport energy from the surface to high in the troposphere without it interacting with greenhouse gases. For the transport up to the thunderstorm base its in the form of latent heat, so not radiating. Once it hits the lifting condensation level, it is transported inside the thunderstorm tower with little interaction with any GHGs outside the tower. And at the top it is released in an area nearly free of CO2 and H2O so it is free to radiate to space … and that is how it “more importantly leaves the earth” as you say.
So your claim that “all the thermoregulatory systems you describe take energy from the equator and shift it polewards” is simply not true. In fact, most of them move energy from the surface upwards, not polewards. And every metre that the energy moves vertically, it has less and less CO2 and more importantly water vapor between it and space.
Next, you say:
First, none of the emergent thermoregulatory phenomena are 100% effective. Clouds and thunderstorms keep tropical temperatures from overheating or over cooling by the timing and strength of their emergence. But some days are still hotter than others, due to differences in overlying atmosphere characteristics, wind, and other variables.
Second, the emergent thermoregulatory phenomena are not always present at all locations and at all times.
Now when I started thinking about this question, like you I thought “what could keep the temperature stable within a percent over a century or more”. So I was looking at all kinds of slow, long-term phenomena, like the long-term interaction between rain, mountain rock, and CO2.
I was living in Fiji at that time, and one late morning I was sitting on the beach looking at the cumulus field forming, and I thought “I’m looking through the wrong end of the telescope”.
What I realized what that if there were a phenomenon that could keep most days from getting too hot or too cold, it would also keep a week from getting too hot or too cold … and a month, year, or a century from getting too hot or too cold.
And I was looking at an important part of that phenomenon. On cold days, the cumulus field formed later, allowing in more heat. On warm days, the field forms earlier, reflecting sunshine back out to space. And since half of the incoming sunlight hits the tropics, controlling tropical albedo is the same as the gas pedal in your car—it controls the amount of energy entering the engine.
So yes, controlling temperatures in the short term, even imperfectly, can indeed control temperatures in the long term.
Finally, you say:
Not true. Here’s the key. The tropical cumulus field forms when a certain temperature is exceeded. It doesn’t form when the sunshine gets to a certain strength. The threshold is temperature-based, not forcing-based. And as a result, if GHG forcing increases AND that increases the temperature, all that happens is that the clouds form earlier in the day.
And in the tropics, total downwelling noon radiation is about a kilowatt. Increasing GHGs since 1900 may have changed that by a couple watts, less than half a percent … so an imperceptible change in the timing of the emergence of the cumulus field would be enough to totally counteract that change.
My thanks to you for your detailed objections, they make me think and will definitely focus and improve my paper.
w.
Willis,
If your feedback mechanisms are not 100% effective then they do not work as you claim they do and still leave room for a small change in temperature over the course of a century to be due to greenhouse effects. You state that the temperature has changed by about 0.2% since 1900 and similarly the forcing at the tropics has changed by less than half a pecent over the same time period. So an imperceptible change in the timing of the cumulus field would just as easily be changed by the forcing resulting in the temperature rise.
And again unless you can put some numbers into your model it will just get ignored. Since you can easily still be right and for CO2 to be driving the climate. Suppose for example the global temperature is given by:
T(t) = T0+ A cos(b*t) Exp(-c*t)
where T0 is the set point, A the magnitude of some perturbation and c is a decay term. Your paper only says that c is positive while leaving open the question of what determines the set point T0. All a climate scientist has to do is say that once you average over suitably long time scales the value of A, b and c are irrelevant and the only equations of interest are those for T0 which is determined by things like the amount of CO2 in the atmosphere, the ellipticity of the orbit, solar intensity etc.
Willis’s emergent mechanisms are not described as eliminating climate variations, including seasons and decadal (or longer) climate changes, but in moderating them—-and most importantly, putting bounds on them.
Those bounds mean No Tipping Point from CO2 forcing lies ahead. This is just the opposite of the claims of climate alarmists, whose models forecast runaway warming from the course of rising CO2 we are on.
This is an enormously important point. The Western world is getting ready to commit unnecessary economic suicide based on the models Willis’s theory contradicts.
kwinterkorn,
It is very hard to see how emergent mechanisms such as Willis describes operates on a decadal timescale. His model involves things like thunderstorms or tropical clouds that naturally have a periodicity of about 24 hours (i.e. the water heats up during the day causing clouds to form in the afternoon). Thus any such mechanisms react almost instantly and on a timescale of hours to days to a change in temperature. Therefore if they exist and they work they should stop it getting colder in winter so the fact that in most places it gets colder in winter shows that such mechanisms are of very limited strength.
Nor do Willis’ mechanisms put any useful bound on global temperatures. Tropical temperatures might be limited to 30 degrees but the average temperature of the planet is only 15 degrees or so and hence there is still a maximum of 15 degrees of global warming possible until Willis’ mechanisms operate globally. So there is still room for catastrophic global warming even if Willis’ theory is correct.
How can it be catastrophic? This mechanism is already in full affect in the tropics, and all kinds of creatures inhabit the tropics, in fact the biodiversity and/or concentrations of living organisms on this planet is likely highest in the tropics. If anything, a whole lot of warming on this planet would just make bigger tropics. And if that worries you, relax, this planet has been there before as well, and still supports life just fine. If anything, global warming would make life a beach everywhere!
I like the description of thunderstorms as heat pipes that cool the ground, partly by way of cool rain hitting the ground. Of course the raindrops themselves at whatever temperature have heat content, caloric content, so the falling rain represents a downward component of heat related energy. This all seems to me very much in contrast to simple depictions of greenhouse theory, where virtually the only downward power components are held to be either solar input or else downwelling IR, with seemingly no special attention to a regulatory cooling effect overall.
Willis thanks for a very interesting article! I think there is an additional related phenomen that perhaps should be checked in the future. When a thunderstorm forms large amounts of water is condensed into microscopic droplets with zero CO2 content at a high altitude and thus low temperature with an extremely large surface area. My view is that the thunder storm efficiently locally removes CO2 from the atmosphere thus increasing radiating heat loss over the sea. Over land the CO2 is released close to the ground when the water evaporates.
Perhaps something to look into in the future.
To me the mechanisms you describe feel very plausible.
Willis, a suggestion concerning Tstorm mechanism discussion, which you may wish to add. You note clouds cool by increasing albedo. But some don’t—high wispy ice cirrus warms because transparent to incoming SWR but opaque to outgoing LWR—part of Lindzens adaptive iris.
IMO there is a second and arguably more important Tstorm thermoregulatory mechanism. The condensation at altitude in a thunderhead releases the heat of evaporation in large part above the greenhouse radiative altitude threshhold, radiatively cooling directly. For sure this is true for hail and grauppel. The condensation falling as rain lowers troposphere specific humidity, reducing the water vapor feedback. That cools indirectly by lowering the positive WVF.
I studied this second issue back when writing The Arts of Truth (climate chapter) and then Blowing Smoke (eassys Humidity is Still Wet, and Cloudy Clouds). In both CMIP3 (AR4) and CMIP5 (AR5) the amount of modeled ocean rainfall is about half that which can now be ‘known’ directly from the ARGO near surface ocean salinity measurements. Means two things. First, you have second and third Tstorm cooling mechanisms at least as powerful as reduced insolation. And second, observational proof that Tstorms are incorrectly parameterized. See my above comment for the more powerful statement you ‘prove’ by showing they cannot be parametrized at at all since vary over the day and season. In the conventional climate model sense, parameters are the ‘constants’ in some larger climate function. See my post here some years ago ‘The Trouble with Climate Models’ for details.
“releases the heat of evaporation in large part above the greenhouse radiative altitude threshhold, radiatively cooling directly.
N2 and O2 cannot cool radiatively, but liquid or solid water can. I wonder if models take it into account.
They do, but incorrectly by assuming constant relative humidity, observationally proven false.
Rud and Willis,
I’ve wondered about this. All the energy of evaporation or sublimation is converted into latent energy, and yes this cools the surface, but then an equal amount must then be released on condensation or precipitation. During condensation or precipitation, I have always assumed that the bulk of this energy is then thermalized, but I always wondered what fraction of it is radiated. Do you have a handle on what % of the energy released on condensation is radiated? Or, is it that all energy is transferred to the surrounding molecules, warming them, and then it is radiated?
Curious.
If the release is above the radiative layer, it all goes to space. The equivalent radiative layer, determined by CO2, is a function of CO2 concentration and altitude. Is why CO2 never saturates.
I would think that needs to be an exaggeration, on at least two counts:
It’s all thermalized, transferred to the surrounding molecules.
The warm air radiates at a rate related to its temperature. (It also absorbs longwave radiation from below and above.)
The efficiency of radiative heat transfer from the air increases at higher altitudes, as the atmosphere above becomes more “optically thin.”
But, there is no point at which all added heat is instantly and magically whisked away by being radiated to space.
Some of the heat is eventually returned to the surface, as convective circulation transports air to higher latitudes where it returns to the surface.
See also my comment to Rud.
Could you unpack or cite what evidence you’re referring to? (I don’t have any assumptions about this either way; just curious.)
“N2 and O2 cannot cool radiatively,”
Is that actually a true statement?
Just because they do not radiate in the LWIR doesn’t everything radiate away it’s energy if it is above 0k.
In the case of N2 and O2 it is in the microwave frequencies.
First, yes, N2 and O2 can cool radiatively, but the effect is trivially small.
Next, all solids radiate. But monatomic gases (e.g. argon) don’t.
w.
“The condensation falling as rain lowers troposphere specific humidity, reducing the water vapor feedback. That cools indirectly by lowering the positive WVF.”
I can see that specific humidity would be lower in the upper troposphere, where the condensation occurs, but there must be a lot of evaporation from raindrops as they fall and warm. This should cool the surviving droplets but increase humidity (as compared with before the rain) at that lower altitude.
Thanks, Rud. Elsewhere I’ve listed the following:
In addition to reflecting sunlight from their top surface as cumulus clouds do, and transporting heat to the upper troposphere where it radiates easily to space, thunderstorms cool the surface in a variety of other ways, particularly over the ocean.
1. Wind driven evaporative cooling. Once the thunderstorm starts, it creates its own wind around the base. This self-generated wind increases evaporation in several ways, particularly over the ocean.
a) Evaporation rises linearly with wind speed. At a typical squall wind speed of 10 mps (20 knots), evaporation is about ten times higher than at “calm” conditions (conventionally taken as 1 mps).
b) The wind increases evaporation by creating spray and foam, and by blowing water off of trees and leaves. These greatly increase the evaporative surface area, because the total surface area of the millions of droplets is evaporating as well as the actual surface itself.
c) To a lesser extent, surface area is also increased by wind-created waves (a wavy surface has larger evaporative area than a flat surface).
d) Wind created waves in turn greatly increase turbulence in the atmospheric boundary layer. This increases evaporation by mixing dry air down to the surface and moist air upwards.
e) As spray rapidly warms to air temperature, which in the tropics is often warmer than ocean temperature, evaporation also rises above the sea surface evaporation rate.
2. Wind driven albedo increase. The white spray, foam, spindrift, changing angles of incidence, and white breaking wave tops greatly increase the albedo of the sea surface. This reduces the energy absorbed by the ocean.
3. Cold rain and cold wind. As the moist air rises inside the thunderstorm’s heat pipe, water condenses and falls. Since the water is originating from condensing or freezing temperatures aloft, it cools the lower atmosphere it falls through, and it cools the surface when it hits. In addition, the falling rain entrains a cold wind. This cold wind blows radially outwards from the center of the falling rain, cooling the surrounding area.
4. Increased reflective area. White fluffy cumulus clouds are not tall, so basically they only reflect from the tops. On the other hand, the vertical pipe of the thunderstorm reflects sunlight along its entire length. This means that thunderstorms shade an area of the ocean out of proportion to their footprint, particularly in the late afternoon.
5. Modification of upper tropospheric ice crystal cloud amounts (Linden 2001, Spencer 2007) . These clouds form from the tiny ice particles that come out of the smokestack of the thunderstorm heat engines. It appears that the regulation of these clouds has a large effect, as they are thought to warm (through IR absorption) more than they cool (through reflection).
6. Enhanced night-time radiation. Unlike long-lived stratus clouds, cumulus and cumulonimbus often die out and vanish as the night cools, leading to the typically clear skies at dawn. This allows greatly increased nighttime surface radiative cooling to space.
7. Delivery of dry air to the surface. The air being sucked from the surface and lifted to altitude is counterbalanced by a descending flow of replacement air emitted from the top of the thunderstorm. This descending air has had the majority of the water vapor stripped out of it inside the thunderstorm, so it is relatively dry. The dryer the air, the more moisture it can pick up for the next trip to the sky. This increases the evaporative cooling of the surface.
8. Increased radiation from less water vapor. The dry air surrounding the thunderstorm allows for more upwelling surface longwave radiation to make it to space.
So yes, lots of ways that thunderstorms cool … but I couldn’t justify going through all of that in the paper.
Charles said it really should be about five different papers … might be right.
As always,
w.
You wrote:
“3. Cold rain and cold wind. As the moist air rises inside the thunderstorm’s heat pipe, water condenses and falls. Since the water is originating from condensing or freezing temperatures aloft, it cools the lower atmosphere it falls through, and it cools the surface when it hits. In addition, the falling rain entrains a cold wind. This cold wind blows radially outwards from the center of the falling rain, cooling the surrounding area.”
Yes, I distinctly experienced such a cold wind one time back in the mid 1990’s here in Saskatchewan. From my tractor at the time, I could see a really big lenticular shaped cloud formation above the hills to the northeast of me, maybe 10 miles away, or maybe more like 15 miles to the center of this thing. When I stopped my machine to step off for a bit, the wind coming direct from there felt very cool indeed.
Later when I got in my car and drove through that area, there were steel bins strewn all around. Also I saw one old farmhouse ripped in half, and another newer house sitting intact in an otherwise completely obliterated farmyard. “Plough wind” damage, they called it.
I will give it a closer look later, but I want to say from the start the opening statement is very strong. The fact that decades of new and better data have failed to improve the uncertainty in our estimates of climate sensitivity is proof that the underlying model is wrong. This is a basic principle of science. Just as the very precise observations of Tycho Brahe failed to improve the uncertainty about the size of the orbit of Mars, until the underlying model was changed from a circle to an ellipse by Kepler, our estimate of climate sensitivity will not become more precise until the underlying model is similarly rectified. This is the central issue.
Willis, I really wish more journal articles read as easily as your writing, but sadly, that is not the case. There seems to be a stylistic bias requiring more turgid and less easily comprehensible writing style. An example from this article is your statement “doesn’t raise the temperature anywhere near as fast”, from which you could remove the “anywhere near” making it more in accord with scientific journals, but less interesting. There are many such stylistic adjustments that might be made, to make this important work read more in the way to which journal editors are accustomed. I have never been the lead author on a journal article, so I am perhaps a poor judge, but others on WUWT might agree with me here that such stylistic changes may improve the likelihood of publication.
Also, the consensus elite (?) scientists will no doubt be looking for every nit to pick, so the way you have used “climate sensitivity” in the context of the processes in a single day will be an easy target. I understand why you have done so, in that climate is simply weather writ large, yet being content to call it temperature sensitivity may be a safer option. Again, the thoughts of someone having been published in a lot of journals would carry more weight than mine.
Willis,
Lowess fitting provides an aesthetically-pleasing representation of the general trend of data. However, it has a disadvantage of not being particularly useful for interpolation or short-range extrapolation. That is, it all has to be done manually with the graphics. Furthermore, it does not provide a quantitative estimate of the goodness-of-fit for purposes of comparing models or supporting any claims of utility.
Therefore, I’d suggest adding, as appropriate, function fits, from a statistics package, to your figures. Either fit all the data, or your Lowess fit. That way, you can claim how well your hypothesis is explained by your independent variables. For example, you might get by with a 3rd-order polynomial fit for Fig. 2, and Fig. 6 looks like it might be fit well with a logarithmic or 2nd-order polynomial.
Obvious but important point.
The predictions are supported by evidence. But you do not discuss the counter-evidence.
Even if the discussion is a single sentence of “As yet there are no observations that contradict this interpretation”, there ought to be some consideration of the alternative.
This is a discussion of the issue not an article intended to sway opinion.
Great effort, Willis. My only contribution from experience is to eliminate any qualitative descriptors and ensure that you have a ‘complete’ literature search.
I think LOWESS (LOcally WEighted Scatter-plot Smoother) should be caps like CERES.
Willis, don’t feel bad if you paper doesn’t make Nature. They cater to the university academia Ph.D track who have spent such big taxpayer $ on test gear that they essentially HAVE to publish in Nature. There are many good journals in the meteorological realm.
Global warming is mostly about polar amplification.
So it seems global warming or cooling is mostly the tilt of Earth’s axis.
And since our axis tilt is reducing, long term, we heading towards, global cooling.
So we have recovered or are recovering from Little Ice Age and within few centuries or
less, we could expect a return to something like the Little Ice Age.
And a continuation of our 5000 year tread of cooling.
I agree. Global warming during Ice Age Terminations is extremely rapid compared with cooling during Ice Age onset. I believe this is due to the exponential growth of melt ponds at high northern latitudes when absorption of solar radiation by water surfaces exceeds a specific threshold determined by solar elevation angle. It is a good predictor, see: http://blackjay.net.au/wp-content/uploads/2020/04/IceAges-1.pdf
High rates of precipitation occur at any time over the warm pools. They are triggered by convective instability and that is not linked to daily cycle. It takes about 30 hours to recharge the CAPE.
Attached was observed at the moored buoy at 0N 156E when it was in a warm pool. The heaviest rainfall occurred on the evening of day 3. Also heavy falls early morning on day 7.
Willis has the advantage of having lived in the tropics, as did my father who suggested that in Singapore you could set your watch by the timing of the afternoon thunderstorms. Obviously, this is a general statement and there are a variety of features that can create heavy rain in the tropics.
Also of note, is that precipitation rates in tropical systems like hurricanes often increase overnight. Curious.
Land is a different situation to open water. The land is much more responsive to sunlight and clouds than the ocean.
You can go and look at the buoy data yourself to see the big downpours occur at any time. It is reasonably well known in the literature as well.
True, Rick. In the warm pool there are lots of thunderstorms that occur on a much more random basis than occurs in much of the rest of the tropics.
w.
Willis,
Not bad, but can you explain why you mixed CERES with Berkeley, when CERES has its own temperature (skin_temp, adj_skin_temp)?
Hey, Zoe, good to hear from you. I used the Berkeley Earth and Reynolds OI data because the CERES surface data is not part of the EBAF 4.1 dataset, which is stated to be “suitable for analysis of variability at the intra-seasonal, inter-annual, and longer time scales”.
The datasets you reference are from:
or
Neither of these say that they are suitable for the kind of comparisons I’m making. One is for “regional and diurnal process studies”, and the other is for “comparison with other same orbit sensors.”
My best regards to you,
w.
Oh, this dataset has skin_temp:
https://opendap.larc.nasa.gov/opendap/hyrax/CERES/SYN1deg-Month/Terra-Aqua-MODIS_Edition4A/
This is actually EBAF4.2, I think.
Thanks, Zoe, but AFAIK that’s actually part of the SYN dataset I referenced above. Also, I’ve not seen anything about and EBAF4.2. Link?
w.
w. ==> Figures 2 and 3 both scatter-plots, show classic signs of non-linearity — with fractal-like banding. There are two potential causes of this: 1) The physical phenomena themselves are non-linear and have fractal-like expressions in the real world or 2) the fractal-like numerical results are a outgrowth of the non-linear mathematical expressions.
Some explanation has to be advanced for this obvious feature in the plots.
Kip,
Possibly rounding of values contributes some pattern (if they are actually rounded). I do not know, just theorising. Geoff S
Geoff and Kip, from what I’ve seen the banding is a function of the fact that these are averaged into 1° latitude and longitude bands. Particularly with latitude, the variables being measured are often changing rapidly N/S and slowly E/W, and thus form individual line-like patterns in the scatterplots.
Likely something worth mentioning somewhere in the paper.
w.
w. ==> Lat/Long might produce a regular banding, but I think not the distinctive “strange attractor-like” patterned banding showing in your two figures. I’m going to try to find and read Rud’s fractal productivity paper in which he finds the “same result”.
Kip, what makes the pattern is that the variables are generally changing very rapidly with latitude and very slowly with longitude. This leads to “chains” of results with the patterns you see. Consider a simplified example:

I’ve used gridcell area because it’s a proxy for the cosine of the latitude. The banding is vertical because, for a given latitude, the gridcell area is the same at every point of longitude.
Now, consider using a variable in place of gridcell area which changes slowly with longitude, and then returns to its original value. Those vertical lines will become the curious looping patterns you see in my graphs.
Best regards,
w.
Kip, a comment from someone who actually published major peer reviewed on fractal implications long ago. See https/doi.org/10/002/smj.4250130705/
or search Istvan, fractal productivity. Same result.
Rud ==> I’d love to read it but none of my usual ten ways of finding an paper that is “in hiding” have turned it up, including a doi search. If you have a direct link, can you please post it here?
Rud ==> I haven’t been able to locate your paper, but I suspect that “same result” in your comment implies that there are some fractal-like non-linearities in the real world function being measured?
I have seen this fracticality time and again in the oddest natural phenomena — larval instars in flour beetles, cloud production, etc.
Germaine, I suppose, but small potatoes:
1) “Here is Reis and Bejan’s description” This should be followed by a colon.
2) “I will define emergent climate phenomena functionally and by example.” Needs a colon there instead of a period; and, would be better as “…climate functionally (in bold) and by example:”
Very best wishes to you on this!
Done.
w.
Willis, you heretic! (I mean that as a compliment).
Apart from the nit-pick that Benard either has an accent or doesn’t, what stood out for me
was some strange things I saw in your scatterplots.
Now, you have plotted 1×1 degree grid cells, over 20 years. And it seems (but your
words do not confirm) that you have plotted each individual grid cell for each
individual month as a separate point. That’s over 15 million data points. I
usually only do scatterplots over a few dozen, or at most a few hundred data
points. And my experience is, that even if there’s a trend line or curve, the
deviations from that trend don’t have any particular structure. They are pretty
much random. I wouldn’t expect that to change if you up the number of data
points. Unless there are secondary effects that you aren’t accounting for.
But your scatterplots show an internal structure, even well away from the LOWESS smooth line! Your Figure 2 (which I call the “Swan’s Neck”) has some really strange patterns below the line. Like several of what look like bridges, reaching out towards what look like islands. Reminiscent of the Mandelbrot set. Could we have a new discovery here, the “Eschenbach pattern?” Well, I count ten of those bridges, and some dubious ones either side; so, it may merely be that it wasn’t the right thing to do to plot individual months. It might have been better to average over the years first. If, when you do that, the odd-looking details disappear, that would tell us something.
There’s a similar internal structure in Figure 3 – there’s a duck in there somewhere – and Figure 6, “the Eel.” So, my best guess is that you’re probably not plotting the data in quite the right way.
Neil ==> Yes, I noticed the same. The question with the fractal/chaotic/non-linear banding “Is it it the real world or in the maths?”
Neil, I see I need to clear up the descriptions. They are scatterplots of the averages of the 20 years of data. They’re 180 latitude by 360 longitude, so each one has 64,800 data points. As to the lines, my sense is that they are an artifact of the collection of the data into 1°x1°gridcells. That will leave gaps between each line of latitude, where the values are changing quickly.
w.
I thought Figure 3 looked like the skeleton of the Loch Ness monster.
One of the consequences of water vapour responding to surface temperature is that there is persistent high level cloud at lower latitudes in the Southern Hemisphere when the water vapour peaks.
I prefer real heat fluxes at the top of the atmosphere rather than non-physical downwelling longwave but the sum of reflected SWR and OLR at the ToA show a high positive correlation with moisture. It also shows the uptick at the high end over the warm pools. The slope for a year is up but there are three months when the slope is negative – the cold surface months. So water vapour itself has an overall regulating role.
The other thing to note is that there is an upward trend in the area of warm pools this century.
I have named the gradient of the regression line for the ToA heat loss v TPW as the Atmospheric Water Cooling Coefficient.
The attached chart shows how the slope changes with sea surface temperature. As noted above there are three of the twelve months when it is negative. It is highly responsive to sea surface temperature. The annual average AWCC for the year considered was 1.4W/sq.m/cm.
Willis:
Another example of a discussion of emergent phenomena:
https://judithcurry.com/2015/05/26/observational-support-for-lindzens-iris-hypothesis/
Slides:
https://curryja.files.wordpress.com/2015/05/lindzen-iris.pdf
Lindzen’s point is that there is a powerful emergent phenomenon that is temperature caused and correlated.
As I understand it, your major point is that the reason the phenomenon is temperature-related is that the “forcing factor” – which is to say base to final temperature – is correlated with the initial temperature. By that is meant “the Climate Sensitivity” which is another way of saying the GHG-based warming to be expected from an increase concentration. Is that a fair characterization?
The trouble you may get into with reviewers is that the phenomenon you describe would emerge without any GHG’s at all. If you double the CO2 concentration in your graphical representation, exactly the same emergence would be seen, and the result would – I wager – be essentially identical. The reason the CO2 concentration would make no difference is a) water vapour swamps any feeble GHG effect, b) there isn’t much CO2, c) CO2 doesn’t form clouds when it rises.
Strictly speaking, I don’t think you can argue that the effect of temperature is a “climate sensitivity” because CS is defined as a temperature variation with respect to GHG concentration (factored to CO2e) provided in units of “feedback Watts per sq M”.
You have shown (quite well) that there is a correlation between the starting temperature and the (permitted) rise in degrees before powerful shading and reflecting is invoked. The upper limit on temperature is capped.
GHG warming theory says that if you were to plot such “capping” lines as you have in hand, increasing the concentration of GHG’s will lift all points of the whole line, (unequally, it is admitted, but everything will go up, they say). GHG forcing is the same as increasing the radiative power at source.
But that is not what is happening. Whatever the starting temperature, the upper limit is fixed by a combination of water vapour properties, air pressure and the fraction of the Earth that is covered by water. It is inherent in the construct.
If you were to produce the same final chart showing the slope of the curve is related to the starting temperature, but bin the CO2 concentration data by date, you might be able to show there is a correlated <i>changing peak temperature</i>. One chart for 350 ppm, one for 375 and another for 400 might show “something”. Or not. If there is no correlation between the position of that line and the CO2 concentration, you have an publication that extends your Thunderstorm Hypothesis paper showing not only a correlation of clouding-over-time with morning sea surface temperature, but that the phenomenon works over an large range of initial values.
If you were to combine this (which is essentially a heat rejecting mechanism) with Lindzen’s Iris (which is essentially a heat venting mechanism) you can account for heat gain or loss and terminal temperature whether it is cloudy or not.
Best regards
Crispin
An excellent study Willis, ahead of its time – emergent phenomena is where climate research is needed.
Here’s another interesting study from 2016 that you might consider a brief mention:
https://direct.mit.edu/isal/proceedings/alif2016/28/608/99454
They show a model system where temperature regulation again emerges spontaneously.
We demonstrate the emergence of spontaneous temperature regulation by the combined action of two sets of dissipative structures. Our model system comprised an incompressible, non-isothermal fluid in which two sets of Gray-Scott reaction diffusion systems were embedded. We show that with a temperature dependent rate constant, self-reproducing spot patterns are extremely sensitive to temperature variations. Furthermore, if only one reaction is exothermic or endothermic while the second reaction has zero enthalpy, the system shows either runaway positive feedback, or the patterns inhibit themselves. However, a symbiotic system, in which one of the two reactions is exothermic and the other is endothermic, shows striking resilience to imposed temperature variations. Not only does the system maintain its emergent patterns, but it is seen to effectively regulate its internal temperature, no matter whether the boundary temperature is warmer or cooler than optimal growth conditions. This thermal homeostasis is a completely emergent feature.
Looks interesting, Hatter, I’ll give it a look when I get time.
w.
Willis, thunderstorms are evidence of how clouds shutter the light from the surface and are the result of evaporation, for sure. But every day https://epic.gsfc.nasa.gov/ shows us pics that the major cloud producers are advective weather fronts, not mostly convective thunderstorms. I think that with clear blue sky the sunlight mostly sees an ocean Albedo of .06. Then the sunlight heats the ocean surface until enough water vapor forms .8 Albedo clouds, driving the planetary albedo to 0.3 again. It does this over and over in randomly shaped patches of the Earth’s surface the size of Europe moving over the surface by Coriolis forces. The net result is an average between ocean Albedo of .06 and Cloud Albedo of .8 and cloud cover of 60%, all varying accoding to Clausius Clapeyron…
DMK, did you analyze it quantitatively? Please share your results.
George, you can do your own little spreadsheet….
So start with the usual Te= [ So/4(1- albedo)/5.67e-8]^0.25 add 33 degrees average lapse rate, not quite technically correct but we’re trying to get a feel for reality here. You should get around 255 C plus 33 gets you 288 C average surface temp.
Now do the same calculation as if the Earth was a water world, albedo say 0.1, and again as cloud covered world, say albedo = 0.8. See the temperature difference.
Temperature controls how much water evaporates off the wet parts of the planet to make the clouds that changes the planetary albedo….and so albedo of about .3 and 65% cloud cover ends up being the balance point.
I would argue that while most of the earth is indeed a fairly random chaotic mess of advection and storm systems, these all “wash out” on average. Storm systems do follow a semi-regular pattern (see Lezac’s Recurring Cycle), and while some areas are cloudy, others are clear. The total Albedo averages out to be fairly constant. However, the ITCZ’s, on the other hand, where the most direct insolation occurs, are regular. So, you have subtropics to polar where there is no thermoregulatory effect, but in the tropics you do.
Thanks, D. A couple points about that. First, it’s not just how many clouds there are. It’s also where they are. First, clouds over ice make little difference. Second, the further polewards you go, the weaker the sunlight on average, so the same cloud will make less difference.
Third, we have to look at the net effect. Clouds reduce sunlight as you point out. But they also increase the downwelling radiation. The net of these is called the “Net Cloud Radiative Effect”, and is shown in Figure 2. Short answer is that clouds warm the cold parts and cool the warm parts.
w.
There is also the issue of “how long clouds last”, kind of the back end of the emergent issue, that is probably important for your paper.
Just want to point out that CRE is a measure of how “in balance” or “out of balance” the radiation effect is. Since the calcs are typically done when everything is in balance the calcs only show a couple of watts feedback. But in reality, the difference in Albedo between an ocean surface planet and a full cloud cover planet is a range of 60% of incoming sunlight being reflected back into space or not. That’s huge, not a couple of watts positive as some (not yourself) indicate. You make a good point “clouds over ice make little difference”…yes look at https://epic.gsfc.nasa.gov/ today…clouds over ice, its the ice that makes little difference, quite a normal occurrence, plus being far out on the cosine of the zenith angle of incident sunlight, makes little difference compared to the albedo range anyway.
Figure 3 looks like you found a Loch Ness Monster.
At 94 i usually have difficulty in understanding these submissions.
But yours made sense. Thank you.
VK 5ellmje
The skeleton of a Loch Ness Monster.
Willis,
Don’t let this sidetrack you, you will be busy enough.
Wondering about latitudinal effects. If the processes emerge because the surroundings have become too hot, would there not be a different distribution of those big clouds? Would they not be going flat out all the time in the warmer regions of the globe, but be rare or absent where is it not much cooler?
The basic question is one we have briefly covered before about 5 years back: Regulators typically work by using a comparison. If the measurement departs from the comparison, the mechanism emerges and drives the system back towards the comparator or reference, whatever you like to call it. So, if this is what happens in Nature, what is the reference temperature and how is it created? I have a worry that in your description the reference value perhaps has to change with latitude and with seasons.
Basically, it would be neat if there was an explanation of what is meant by expressions like “when it becomes too warm, clouds appear” becoming “when temperature exceeds the reference value for this location, as determined in the following manner, clouds appear”.
OTOH, maybe you do not need to consider this sort of philosophical point because you are reporting what Nature does, not so much why it does it. The earth has had a long time to settle down to systems that keep it stable. If it had not settled down we mght have had a very different earth and no us. It is fundamentally the inexorable operation of physics, chemistry, biology etc, the hard sciences, that have combined to create what we are able to habitate.
Geoff S
Here you go, Geoff. Cloud top altitude shows the location of deep tropical thunderstorms. We’re a full-service website.
w.

Thank you, provider of full service. Geoff S
“at dawn, the atmosphere is stratified, with the coolest air nearest the surface” … hmmm maybe not because as you rise in altitude it gets colder hence the warmest air is at the surface.
Willis:
For your theory to have any relevance, it needs to be able explain the large temperature swings during, for example, the RWP, the MWP, and the LIA, each of which which lasted for hundreds of years.
And nothing in it makes any predictions as to what we might expect in the future.
An excellent paper but you will find it difficult to impossible to publish however well argued and well documented it may be. The trouble is, it’s physics. In my experience climate science is owned by the modellers who are mathematicians. Any proposal which threatens the dominance of the GCMs is out of bounds. We came up with a statistical technique for forecasting future temperatures based solely on past observations (http://paradigm2.net.au/). Like you we question the notion of a “Climate Emergency”. Because our arguments are not GCM based, journal editors are way out of their depth and our paper never makes it to peer review.
The high priests of emergent phenomena have a church in common at the Santa Fé Institute, despite often radically different background disciplines. You may find this piece useful as a support for your motivation:
https://medium.com/sfi-30-foundations-frontiers/emergence-a-unifying-theme-for-21st-century-science-4324ac0f951e
The opening couple of paragraphs:
These persons may be of interest:
https://www.santafe.edu/people/profile/marten-scheffer
https://www.santafe.edu/people/profile/joshua-garland
Of course back in the day they pushed the idea of the weather and climate as a complex chaotic system, highlighting the butterfly effect. These days it seems that openness of thought has disappeared otherwise you might find willing collaborators there. I did unearth this, from the days when Murray Gell Mann was still an influence:
https://oxford.universitypressscholarship.com/view/10.1093/oso/9780195159769.001.0001/isbn-9780195159769-book-part-17
It might be fun to cite some of the early work
Willis, I think that your data supports the thesis that in the tropics, thunderstorms are a significant contributor to constraining temperatures to below 30°C, over water. But what if anything does that say about the rest of the world? According to some reports, the world’s average temperature is about 15-16°C, and thunderstorms are a very rare phenomenon globally. Please explain the mechanisms at say a latitude of 40°. What drives the formation of clouds and how do they act as an effective thermostat to stop further warming?
Willis, write it in a way that aims to enhance knowledge around climate change and not challenge it. Focus on the CERES data and less on how remarkably stable the climate is. That might be a red flag to some, even if true!
E.g. given the importance of accurately predicting anthropogenic climate change, reducing uncertainty is key to better forecast outcomes. To do this we have examined CERES data to better quantify the observed relationships between temperature and feedback. Our results indicate that the feedback parameter is not linear as conventionally assumed, but a function of temperature governed by emergent weather phenomena such as thunderstorm activity at the equator. Application of these relationships could narrow uncertainty and more accurately quantify the effects of climate change at a regional and global level.
I’m late to this party but – – –
Dust Devils occur in abundance on the dry farms in Eastern Washington State. Interstate 90 west of Ritzville is native territory.
The parts that can be seen are small (relative to a thunderstorm) while many of them will turn the sky brown. Massive rolling clouds of dust are rare, relatively. Insofar as this region is Damn Near Idaho (DNI) I suspect the forests of Northern Idaho are the recipient of this soil.
This phenomenon is interesting but I agree inclusion likely distracts from your main arguments.
If one searches up – dust devils Ritzville WA – using “images” there are many photos and a few videos.
“Peer review” is fake! A ‘siren song’ of Marxists at the A.G.U. et al. and their beloved Fake Science. “Peer review” of the A.G.U. did not exist when Einstein sent his four papers (the second an addendum to the first) on General Relativity for publishing, November 1915. And about a year after their publishing, a ‘committee’ of more than 100 “pissed off” German physicists sent a “Consensus” letter to the journal, demanding withdrawal. Einstein replied to the journal editor saying, [paraphrased] “They don’t need 100 arguments of why I am wrong, just 1 … that is correct! And on that, they can’t even come to a … ‘Consensus’!”
Best.
Ref.: https://en.wikipedia.org/wiki/The_Sirens_and_Ulysses
I agree Reginald. It’s Pal Review, not Peer Review, and it’s crap (a formal engineering term).
I prefer the rough-and-tumble of internet review, even though one is sometimes subjected to trolls and imbeciles.
Regards, Allan
Published circa 2010, possibly by me (not sure, but I agree with every world):
It is a year since the so-called Climategate e-mails were leaked. Since then, we have had freezing winters in Europe and the US, and revelations of gross misrepresentations from the Intergovernmental Panel on Climate Change (IPCC). The lasting impression is of massive corruption of science.
Leaked from the Climate Research Unit in England, the e-mails showed the scientists behind the climate scare plotting to: hide, delete and manipulate data; to denigrate scientists presenting different views; to force journals to publish only papers promoting climate alarm; to subvert “peer review” into “pal review”; and make the reports of the IPCC nothing but alarmist propaganda. The corruption spread through governments, universities, scientific societies and journals. You have to look back to the Lysenko episode in the Soviet Union in the 1940s (when a crank persuaded the Soviet establishment that agriculture did not follow Darwinian evolution) to find such perversion of science.
The worst nonsense after the scandal was this: “Well, some climate scientists committed a few minor transgressions but the basic science is sound.” In fact, the basic science is nonexistent.
There is no evidence that mankind is changing the climate in a dangerous way. The slight warming of the past 150 years is no different from previous natural warming periods, such as the worldwide medieval warm period from about 900 to 1200AD. Global warming and cooling are closely correlated to variations in the sun, especially in its emission of charged particles. Carbon dioxide (CO² ), a harmless, natural gas upon which green plants depend, is a feeble greenhouse gas. Its only significant absorption band (15 micron) is saturated, so adding more to the atmosphere has a small and diminishing effect.
Continued at
http://thegwpf.org/opinion-pros-a-cons/1959-andrew-kenny-a-year-after-climategate-the-corruption-of-science-persists.html This link no longer works.
Willis,
As a researcher in and reviewer of journals I highly recommend you lose/re-word all statements that directly attack the people, efforts, costs, etc in the past. Albeit true, it has no bearing on the main points (scientifically speaking) you are trying to make (and good ones at that). Scrub the paper and reword/remove those like the one below. Let your scientific based method and analysis speak for itself. Also, most journals prefer third person … stay away from I, we, etc. Once you have your target journal … check its style).
“This is indicated by the inability of researchers to narrow the uncertainty of the central value of the paradigm, “climate sensitivity”, despite forty years of investigations, millions of dollars, billions of computer cycles, and millions of work-hours being thrown at the problem.”
Thanks, Doc, will do. Always good to hear from someone who actually has been there and done that.
w.
Doc Walt
What do you think about the term “climate sensitivity”? A reviewer might well ask: transient or equilibrium? While the observation that the ECS is uncertain the phenomenon is not discussed in terms of ECS or TCS and as I noted above, the paper is about regulation, not climate sensitivity. Willis notes that the number of degrees of rise before thermoregulation caps the temperature varies with the initial value – not a big surprise really. I was going to suggest picking ECS or TCS and drop CS, but a reviewer will balk at the dissonance between thermoregulation and ECS before getting to the term itself.
Willis gives a clear demonstration that if the energy input to the earth increases (for any reason like distance to the sun in winter and summer) the area moderated under the temperature cap increases, the temperature does not rise above the cap.
Now, the average temperature does, because the poles warm more than the temperate zones. GHG proponents noticed that and claimed it is a proof of GHG’s in action. To me, it is an indication that Willis is correct, and that it is not related to any standard definition of ECS or TCS.
In short, when the poles warm and the tropics don’t, it is proof of global warming, but not proof that it is caused by GHG’s.
It is rather, proof of thermoregulation which has two components: Shading and Lindzen’s Iris Effect. There are two subclasses – one for each: Svensmark for his well-known shading and Prof Lu (Waterloo Univ) for the lesser known ozone iris over Antarctica, also mediated by GCR’s and oceanic bromine (etc).
Interestingly both Svensmark and Lu have demonstrated their respective effects at lab scale. Both have supporting satellite data. Willis and Lindzen have demonstrated their mechanisms using measurement sets and analysis. It looks as if the GHG signal is lost in the noise of larger effects.
Hi Crispin and Willis,
Prediction 4. The “climate sensitivity”, far from being a constant, will be found to be a function of temperature.
I don’t think that Climate Sensitivity (CS, ECS or TCS) even exists in practical reality. Atmospheric CO2 changes lag temperature changes at all measured time scales. (MacRae, 2008). Humlum et al (2013) confirmed this conclusion.
Kuo et al (1990) and Keeling (1995) made similar observations in the journal Nature, but have been studiously ignored by global warming propagandists.
CS is a fiction. “The future cannot cause the past.” Here is the proof:
https://www.woodfortrees.org/plot/esrl-co2/from:1979/mean:12/derivative/plot/uah6/from:1979/scale:0.18/offset:0.17
Regards, Allan
Thoughts from 2013:
https://wattsupwiththat.com/2013/10/10/the-sun-does-it-now-go-figure-out-how/#comment-1121415
[excerpt]
The popular debate in climate science suggests that this science is in its infancy. I further suggest that the majority of climate science has taken a giant step backwards in recent decades due to egregious political interference and scientific misbehaviour.
Notwithstanding all the wonderful data available especially since ~1979, we have an “ECS mainstream debate” that ASSUMES THAT CO2 SIGNIFICANTLY DRIVES TEMPERATURE and centres on the question of “climate sensitivity to atmospheric CO2” (“ECS”) that questions whether ECS is greater or less than 1 (that is, are there positive or negative feedbacks to increasing atmospheric CO2).
Since CO2 clearly LAGS temperature at all measured time scales, this ECS mainstream debate requires that, in total, “the future is causing the past”, which I suggest is demonstrably false.
To be clear, I suggest that atmospheric CO2 does NOT significantly drive Earth temperatures, and Earth temperatures clearly drive atmospheric CO2.
This does not preclude the possibility that the observed increase in atmospheric CO2 is primarily caused by some factors (natural and/or humanmade) other than temperatures, but such increase in CO2 is insignificant to Earths’ temperatures.
In summary, in climate science we do not even agree on what drives what, and it is probable that the majority, who reside on BOTH sides of the ECS mainstream debate, are BOTH WRONG.
It is also possible that I am wrong on this point ( possible, but not probable :-} ).
Regards to all, Allan
Thoughts from 2012:
https://wattsupwiththat.com/2012/09/16/onset-of-the-next-glaciation/#comment-899050
johnpetroff says: September 16, 2012 at 9:37 pm
“There will be no “next glaciation” as long as modern man dominates the Earth. While we can debate the onset of the next cooling cycle, the planet is current warming and warming rapidly.”
I disagree John. The satellite record, which is the only reliable scientific record of current global temperature, shows no net warming for 10-15 years.
To be clear, I think Earth is at the end of a natural cyclical warming period and is about to enter a cooling period, which could be moderate or severe. This cooling will be apparent by 2020-2030 (or sooner) and could be as severe as the Dalton Minimum circa 1800 or the Maunder Minimum circa 1700. I’d rather be wrong about this prediction.
Since there is no evidence that atmospheric CO2 has any significant impact on global warming, I do not see that mankind’s current fossil fuel burning activities have any significant impact on climate, either for better or worse. The only apparent impact of increasing atmospheric CO2 is to make little flowers happy.
I’m not convinced that whatever we do regarding methane will make any difference either. If running around shoving corks up the backsides of bovines is someone’s cup of tea, then let them proceed, but at their sole risk. Just do not expect it to have any impact on climate, and don’t send me the bill. 🙂
Allan,
On CO2 lags temperature,it is widely acknowledged that the ice records show the lag of up to 800 years plus but the attempted rebuttal is Shakun et al 2012.
It claims in a study of the emergence from the Ice Age 20,000 years ago that while orbital changes triggered the initial warming, overall more than 90% of the glacial/interglacial warming occurred after that atmospheric CO2 increase.
As ocean temperature rose,the oceans released more CO2 into the atmosphere.
In turn this release amplified the warming trend leading to more CO2 being released.
Thus it is claimed increasing CO2 became both the cause and effect of further warming.
This positive feedback was said to be necessary to trigger the change between glacials and interglacials because the effect of orbital changes was insufficient to cause the variation.
I have always struggled with this paper and its explanation.
Thank you Herbert,
It sounds interesting, but I won’t promise to read Shakun. I’ve wasted too much of my life reading warmist nonsense that turned out to be false and fraudulent.
Excerpt from my paper
CLIMATE CHANGE, COVID-19, AND THE GREAT RESET Update 1d
“Rode and Fischbeck, professor of Social & Decision Sciences and Engineering & Public Policy, collected 79 predictions of climate-caused apocalypse going back to the first Earth Day in 1970. With the passage of time, many of these forecasts have since expired; the dates have come and gone uneventfully. In fact, 48 (61%) of the predictions have already expired as of the end of 2020.”
Climate doomsters have a perfect NEGATIVE predictive track record – every very-scary climate prediction, of the ~80 they have made since 1970, has FAILED TO HAPPEN.
Fully 48 of these predictions expired at the end of 2020. Never happened! Never will!
What are the odds at 50:50 per prediction?
3.6*10^-15 = 0.0000000000000036
So the climate doomsters were wrong in their very-scary climate predictions 48 times in a row – at 50:50 odds that’s like flipping a coin 48 times and losing every time! The odds against that being mere random stupidity are a gazillion to 1. It’s not just scientists being stupid.
No, these climate doomsters were not telling the truth – they displayed a dishonest bias in their analyses that caused these extremely improbable errors – they knew they were lying.
There is a powerful logic that says no rational person or group could be this wrong for this long; they followed a corrupt agenda, and they lied again and again.
The ability to predict is the best objective means of assessing scientific competence, and the global warming alarmists have NO predictive track record – they have been 100% wrong about everything and nobody should believe these fraudsters – about anything!
I published this new Law in early 2020. Edit: Please delete the word “Virtually”.
“MACRAE’S MAXIM”:
“VIRTUALLY EVERY SCARY PREDICTION BY GLOBAL WARMING ALARMISTS IS FALSE.”
Best regards, Allan
Hi again Herbert,
This just arrived from my friend Cap Allon in Europe:
UNPRECEDENTED COLD INVADES EUROPE: “EYELID FREEZING NIGHT BREAKS RECORDS”
April 29, 2021 Cap Allon
https://electroverse.net/unprecedented-cold-invades-europe/
This year’s punishing winter has shown few signs of abating, even as May fast-approaches.
Across the European continent, the majority of nations are suffering their coldest April’s in decades–in around 100 years in Germany and the UK. This climatic reality (aka cooling) is in response to the historically low solar activity we’re been experiencing, as a decrease in output from the Sun weakens Earth’s jet streams and increases their tenancy to flow in more of a weak and wavy manor — this “meridional” flow, as it’s known, increases the prevalence of Arctic outbreaks and “blocking” phenomenons.
And it’s not over yet – brace for the cold May2021 forecast:
EUROPE BRACES FOR EXTREME MAY FREEZE April 27, 2021 Cap Allon
https://electroverse.net/europe-braces-for-extreme-may-freeze/
The models are in, and the models are grim: the majority of Europe is set on for an extreme May freeze with heavy snow forecast for Scandinavia, the Alps, Germany, and even the UK.
I accurately predicted this cooling two decades ago, in 2002 and again accurately to the month in mid-to-late-2020 – see my 2021 paper for details.
The ability to predict is the best objective measure of scientific and technical competence – that’s the acid test.
If the global warming alarmists were auto mechanics, you would have taken your car to their garage 48 times, and it still would not start.
Where to begin? I suggest you get a good editor with experience in journal submission as I can see, unless the journal is atypical or for hire, a whole lot of issues. I’ll give you an example using the abstract.
Remove all words before, “Here I propose”. They go in the introduction and are not abstracting the new work you are detailing. You then need to rewrite the final bit (obviously since it is written to follow the first bit.) Including a reference in the abstract is unusual. The abstract should not need references.
Some other things – the headings and the liberal use of bolding. Including a description of a graph within the graph is not something I’ve seen tolerated, nor are headings above and below figures.
and so on…
Example 543
“4) My theory is that the thermoregulation is provided by a host of interacting emergent phenomena.”
“my theory” yuck – instant rejection.
“A host” and “phenomena” unnecessary tautology
Rewrite-
It is proposed that thermoregulation is provided by interacting phenomena.
Nice. Done.
w.
Thanks, Gee. Excellent suggestions.
Do you, or anyone with experience, want to work with me to edit the document and submit it? Author credit for that of course, since most of the writing would likely be yours …
w.
HI Willis,
I’ll stay out of the minutiae, but thanks.
Seriously there is a lot of stuff to fix – tense, phraseology, use of undefined terms, too many words. I am not trying to cut you down but I am urging you to hold back from submitting until you’ve had independent and experienced assistance.
You have a lot of fans here which is good in one sense but, and there is evidence in these comments, this also means you get overly positive comments. People are urging you to publish because they agree with what you write (possibly regardless) and not because they know it is up to scratch for peer review. So you need someone hard-nosed.
I just saw Doc Walt’s comment – spot on (maybe twist his arm for help)
Gee, thanks for your help and your straight talk. I’ve not felt once in what you wrote that you were trying to “cut me down”. You were just talking straight, which is why I posted this.
I’ll ask again if there’s someone knowledgeable and willing to take this on with me. Doc Walt? Anyone?
Let me further extend the offer to anyone interested in writing up any of my other 900+ posts, or a combination of them, in exchange for author credit.
Anyone?
And thanks again, Gee, honesty is always welcome.
w.
willis,
To get it out there you might like to try this Institute of Physics
conference on Planetary Atmospheres?
https://www.iopconferences.org/iop/frontend/reg/thome.csp?pageID=1037531&eventID=1673&traceRedir=2
Re the IOP conference, Short notice is to be expected when papers contradicting cherished hypotheses could be presented. You have till 12 May to submit abstracts and until 7 June to register for an IOP Conference with the above title. The meeting itself is scheduled for 9 June and will be virtual with no charges but registration beforehand is required. See:
https://www.iopconferences.org/iop/frontend/reg/thome.csp?pageID=1037531&eventID=1673
Well, for a while I had 110 or 120 comments in the email queue, and then I’d answer twenty of them. And when I looked up again I had 110 or 120 comments in the email queue … having finally gotten them down to zero and it being past midnight, a few thoughts are in order.
First, my thanks to everyone who contributed. It has confirmed my view of the denizens of this site as being one of the most knowledgeable and responsive audiences imaginable. My thanks to you all. In particular, I want to thank those who didn’t mince words, those who said they were “brutally honest”, those who spoke out clearly and strongly about the flaws of the paper.
Look, at 74, at this point I’m in my middle youth. And if you want to aggravate my blood, telling me the truth about problems with what I’ve written won’t even begin to do that. Seen too much, done too much, for honesty to bother me.
[I will confess, however, I don’t take kindly to being called a liar or accused of misrepresenting or shading facts … that does indeed angrify my molecules. I tell the truth as best I know it and I admit my mistakes loud and clear when they are pointed out. I was brought up under what in my family was called “The Captain’s Code”.
“The Captain” was my great-grandfather, an 1800’s riverboat captain on the Mississippi and in the Gulf. One part of The Captain’s Code was:
Now, I’m not an 1800’s guy, so I don’t kill people for false accusations of me lying, although family legend has it that The Captain once might have … but I must confess, being called a liar definitely makes me say bad words and invite my accuser to engage in an anatomically improbable act of sexual self-congress.
But on the other hand, honesty, even of the most brutal kind? Honesty I welcome—my thanks to those of you who told the unvarnished truth, and particularly those of you who don’t seem to even know what varnish is. But I digress mightily …]
Second, it’s clear that I could greatly benefit from having someone partner with me to turn this into a real journal paper. I partnered on a paper once before, with Craig Loehle, who has my eternal gratitude for all that he did. That paper, “Historical bird and terrestrial mammal extinction rates and causes“, was our (mostly his) transformation of my post entitled “Where Are The Corpses” … and it has garnered over 100 citations in the journals.
So if there is anyone out there with experience and knowledge who is willing to take on the most charming task of re-writing my first draft and submitting it to a journal, all I can offer is credit as the co-author … plus lots of work.
I would also extend the same offer regarding any of my 900+ posts on a host of subjects. Some of these are preliminary investigations, some are not far from complete journal articles, but all of them are written in my most idiosyncratic style which is nothing like the big-paragraph, thick turgid third-person prose favored by the journals.
Onwards, the hour is late, more tomorrow. My best regards to all,
w.
Willis –
Nitpick yes : A challengeable statement in your intro-
“The stability cannot be from simple thermal inertia, because the hemispheric land temperatures vary by ~ 20K over the year, and hemispheric sea temperatures vary by ~ 5K.”
That’s sea surface temperatures. Thermal inertia of the great oceans cannot be dismissed quite so lightly, even if on timescale that is tangential to the argument you present.
—
I agree with the various commenters who have proposed that you deal with prior work on thermoregulation in the body of your argument, rather than merely as references. That is what many reviewers will expect, and will be offended if you don’t.
I also think getting a couple of people to go through the paper and mark up suggested changes in the language, which you might then consider, would be a good idea. A sort of ‘proof read’ by knowledgeable folk who know what journals will look for, even if they themselves don’t know much about the subject of your work.
Good luck with this – I’m in awe of your grasp of issues, and your work rate!
Very nice theory which also really makes sense.
May I comment on “prediction 3”:
Prediction 3. Transient decreases in solar forcing such as those from eruptions will be counteracted by increased sunshine from tropical cumulus forming later in the day and less frequently…
I would replace the underlined phrase with something along these lines:
counteracted by increased sunshine due to the tropical cumulus forming later in the day…
(otherwise one could interpret it as though tropical cumulus leads directly to increased sunshine using the verb “from”)
Willis just stick to the numbers and graphs of your study. Then at end draw conclusions from the study. You want to report the data, and leave it for others to draw conclusions. At end you can add your own possible conclusions that the data might suggest.
There are mainly 2 steps
– report the data in a very and graphs in very mathematical way
– draw possible conclusions from data
Willis, I can just about follow the science, and you write very well. Thank you, as always.
A suggestion – I have done a good deal of manuscript editing of various kinds, and I have become used to having page numbers (at least) to allow me to find my way round. There aren’t any here. Would it make sense to number the paragraphs in the document, so that for the purpose of making comments, people could point to what they are talking about? I don’t know if this is possible with the software.
One point. After figure 1, in the paragraph beginning ‘this area-wide shift to an organised circulation pattern’, there is a sentence:
In addition, note that there are actually two distinct emergent phenomena in Panel 2—the Rayleigh-Bénard circulation which emerges prior to the cumulus formation, and which is enhanced and strengthened by the totally separate emergence of the clouds.
On first reading, it is not clear that the part of the sentence, after Panel 2 -, is about the two distinct emergent phenomena; the last half of the sentence, beginning ‘and which is…’ sounds like an elaboration of the first phenomenon, rather than the second phenomenon. I had to go back and reread to make sense of what I had read. Suggest a rewrite, something like:
the first of these is the Rayleigh-Benard circulation, which emerges prior to the cumulus formation; the second is the totally separate emergence of the clouds, which enhances and strengthens the first.
Best wishes for the submission, and the vagaries of peer-review in these times.
w – A brilliant paper, so I fear that you will have great difficulty publishing. Here’s a mixture of comments,in no particular sequence, for you to use or ignore as you wish. Apologies if I’m duplicating comments already made,
PS. Where I say that Ellis and Palmer “hint at the existence of your Emergent Thermostat”, it may be worth noting that this is both global and longer timescale. I suspect that rejection attempts will be based on the local (tropics) nature of most of your material and its very short timescales.
“nothing more solid than clouds” Don’t know if you have changed this; suggest “fluid phenomena” You will probably be tasked for the claim that includes “Nothing”, which is an absolute. There may be other absolute claims (all, no, none, everything, etc.) that should be changed.
After reading the comments, I hope you will repost with numbered paragraphs and pages, as suggested. I think the results of the comments will be a much improved read.
Minor point to consider.
In the overview section Willis says “This is a variation of +/- 0.2%.”
In my view this reads a bit disingenuous as 0 kelvin is an arbitrary baseline (if i understood the 0.2% correctly), and practically speaking not a temperature the earths surface will experience anytime soon. If you would like to present a percentage as context for 1 kelvin variation over the 20th century, then perhaps express it relative to the range of temperatures earth has experienced in relatively modern times, geologically speaking. Perhaps comparing to the temperature range from the paleocene-ecoene thermal maximum and pleistocene ice ages?
Sorry, MJB, but when you are dealing with thermodynamic phenomena and heat engines like the climate, 0 kelvin is a required baseline set by physical laws, and not “arbitrary” in any sense. None of the physical laws governing such heat engines work with any other baseline.
w.
Most excellent work! The work is clear, concise and with supporting real world data.
I am not adept at commenting on the protocols and vagaries of publishing to journals or peer review, however I would like to point out the following:
Just as you successfully argue that “emergent” processes appear to rule the physical realm, I would argue the whole purpose behind the Climate Change Cult as it stands now, also succumbed to “emergence”! (from a bad seed it has grown into a humongous hydra headed serpent, who regrows a new head each time you cut one off)
The origins of this “man caused” apocalypse, had nothing to do with the Climate per se. Rather it was a means to scare, convince or brainwash the masses towards an agenda which they otherwise would not accept.
There are countless examples of those who started this hoax, and those who champion it now, admitting it never was about the Climate or Environment, but rather about power, control and some misguided notion of ushering in some socialist/Marxist utopia. And with that main dish, a generous helping of population reduction as a side dish.
But those original goals – generated their own “emergent” processes. So for example the paradigm is so deeply ingrained and critical thinking so seriously eroded in so many minds that rational persons cannot accept anything which challenges that paradigm.
The “entity” of the cult of thermageddon, created mechanisms to thwart any challenges to the central ideas – like smart people knowing their livelihoods depend on towing the party line. I could go on, but I’m sure you get the idea.
You may want to consider this built in emergent resistance to challenges – in how you approach the dissemination of this excellent work! (just publishing a paper showing the paradigm is wrong won’t change it in the current intellectual climate – find ways to open a crack in the many emergent defense mechanisms the present paradigm has evolved to block any common sense or empirical challenges)
My diatribe may be misplaced – your work surely could serve to crack the thick heads of holders to the existing paradigm and plant a seed. Perhaps be more gentle denouncing the flawed existing paradigm, while planting your seed of reality/truth…. enhancing the chance it may breach the emergent defenses already in place and grow.
Looks pretty good overall, subject to the prior-literature searches suggested by others that may take a bit of the wind out of your sails, so to speak. Overall I think the analysis is spot-on.
However, I do, as you might expect, take issues with statements like these based on the CERES calculated (not measured) data: “The sun plus GHG radiation combine to heat the surface”. Here is a more precise phrasing for you: “plus maybe GHG radiation, which no one has been able to measure, but we assume it must be there, because we can’t make our equations work without it, since we don’t want to include other effects we’ve been told about but don’t believe in, such as the gravito-thermal effect – and in our defense, physicists have a long tradition of inventing imaginary matter and forces to fill in gaps in their knowledge, such as aether, and dark matter”. FIFY.
(You should probably suspect that there’s something wrong with your theory when the only way to “determine” the hypothetical DWLWIR is to measure something else from space, and infer the quantity you want at ground level. However, in your favour, I would speculate that not too many people in the broader community will complain when you use NASA’s calculated datasets, since they are NASA, even though around here we know that NASA’s climate division is not that infallible, as it turns out. So you might just be able to get away with it. Best of luck!)
Willis,
I don’t really have the technical depth for much comment, but from all the discussions here about “climate vs. weather” I would say I have a problem with your use of the term “climate sensitivity”, i.e. “In the early morning, climate sensitivity is high” – At this point, you’re talking about a transient phenomenon that changes, as you state, later in the day (“In the late morning, a regime change occurs to a situation with much lower climate sensitivity.”). I don’t think that “climate” is the right term for something changing that rapidly.
Elsewhere, you refer to the more “classic” usage of climate sensitivity “the uncertainty of the value of climate sensitivity has only increased.” – which I think can create some confusion. Perhaps this is due to ignorance on my part of the normal usage of the term, but I’ve always seen it to refer to the longer-term, not to something that may change that rapidly.
Sorry, I don’t really have a suggestion for a better term. Perhaps “transient climate sensitivity” or “daily sensitivity”? Something to distinguish the daily sensitivity from the long-term. Or maybe just some definitions to help those of us with somewhat less understanding of the technical details?
I hope that isn’t coming across as too dense – if my criticism is lacking hopefully you can enlighten me.
After reading through the comments and rereading the article, it almost seems to me that you are suggesting that the very concept of a “constant” for climate sensitivity is incorrect, and that it would actually be variable dependent on conditions.
Hi Willis,
I couldn’t be much help so I thought I’d let the experts weigh in first.
I do wonder about the dust devils though (we called the whirlwinds) and about the dust they raise.
In southern New Mexico the dust seems to dissipate somewhere as they move along. I saw one in the Texas Panhandle, though, going across a freshly disked field and it raised quite a cloud of dirt above it. There were a few little puffy clouds around and when the dust moved into one of them, both the cloud and dirt cloud disappeared. I suppose the wet dirt fell to the ground.
I’ve wondered if the general dust in the air affected weather in the area or if it even got high enough in the atmosphere to matter..
Hi Willis,
I think it may be better to talk about potential temperatures rather than actual temperatures (taking into account adiabatic cooling) when you discuss convective stability in the troposphere. Except very close to the surface, the actual temperature drops with altitude, even when the potential temperature is rising with altitude.
I like figure 1. Think it would be good to include some comments about were rising CO2 (and other IR emitting gases) will influence the described processes. For example, during the night when tropospheric convection has subsided, the rate of cooling of the ocean surface will be reduced somewhat with higher CO2 (narrowing of the IR window to space). This will influence the timing of emergent processes the next day.
I think your chance of getting published would be improved by pointing out that while rising GHG’s may increase average surface temperature, the extent of that increase will be diminished by the emergent processes you describe. The deficiencies of GCMs are almost certainly due in large part to the inability of the models to capture the emergent processes you are describing; adopting “parameterized” descriptions of those processes is a major cause for the uncertainty (and likely exaggeration) in their predictions of sensitivity to GHG concentrations.
Finally, it would be helpful to contrast emergent processes over land versus over the ocean. Graphics like figures 2 and 3 for land only would be informative in drawing that contrast.
Graphs showing the slope of fig 6 and the category sums of fig 7 would be most helpfull. Fig 6 is your money plot and deserves further analysis.
Fig 7 is hard to see in b&w. A histogram showing the total area by category would serve what the eye cannot.
Great article Willis,
“However, over large areas of the tropical ocean, the temperature and downwelling surface radiation are negatively correlated. Since decreasing downwelling radiation cannot increase the surface temperature, the only possible conclusion is that in these areas, the increasing temperature modifies the number and nature of the overlying clouds in such a way to decrease the downwelling radiation.”
It is not the only posible conclusion, the decrese in downwelling radiation could cause some other variable to change which in turn causes the temperatures to increase. I agree that it is compelling evidence for the reverse causality since there is a proposed mechanism for it, but maybe some other phrasing will be better.
Willis, I am going to e-mail Charles to see if this post couldn’t stay at the top of the list for a few days as it is going to get buried in time.
I looked through your paper last night. Things will occur to me over time, as I read multiple times, and after reading what others post, so my questions and comments are going to come in no particular order. Usually I have about a month for a peer review.
Current comment/question #1: Figures 2,3 are very good, but they come with limited discussion. They certainly suggest self-organization, but what happens? Is this like the transition in rayleigh-benard — i.e. we pass a point were a most unstable mode of motion grows exponentially? Figure 4 and 5 are new to me. They are very interesting. Are you saying that in contradiction to what Soden et al claim that the anomalies are not related to Pinatubo; they actually are verified, real, and related to some emergent phenomenon initiated by Pinatubo? As you claim a later in the day development what evidence can you provide about timing of cumulus appearance and growth? Figure 6 presents a concern. How does BEST go about finding surface temperatures, and does this constitute truly independent data? If the surface temperatures are actually derived from satellite data by means of some algorithm, as CERES skin temperatures are derived from GOES data, then there is the potential for some circular reasoning here,a and the relationship observed is actually the GOES temperature algorithm.
That’s all I have for now.
Thanks for the good suggestions about the paper, Kevin.
Charles the Moderator texted me to ask about pinning it. Right now it’s all I can do to keep up with the comments, so I’d like it to remain just an ordinary post. I do appreciate the thought.
w.
Willis, some suggestions due to figure text (mainly that y-data are plotted versus x-data) :
A:
”Figure 2. Scatterplot, sea surface temperature (SST) versus surface cloud radiative effect.”
suggested to be replaced by :
“Figure 2. Surface cloud radiative effect versus sea surface (SST).”
The word “Scatterplot” can be excluded.
The wording “Surface cloud …” also to be rephrased.
B:
“Figure 6. Scatterplot, CERES net downwelling surface radiation (net shortwave plus longwave) versus Berkeley Earth global surface temperature…… (W/M2)”
suggested to be replaced by (also valid for the text (could be excluded) just above the graph) :
“….. Berkeley Earth global surface temperature versus CERES net downwelling surface radiation (net shortwave plus longwave) ….. (W/m2).”
Note “W/m2”.
The word “Scatterplot” can be excluded.
LOWESS smoothing in capital letters or/and to be explained/referenced.
C:
“Figure 7. Correlation …..”
What sort of correlation is meant, linear, correlation coefficient squared or what?
Kind regards
Anders Rasmusson
Anders, good to hear from you as always. Noted.
w.
It will be good to see this as a science paper.
But you will need many more references.
For example…
Thunderstorms emerge earlier when it is warm…
Who said that? In what science paper? Date and DOI index number?
Thunderstorms are heat pipes…
Who said that? In what science paper? Date and DOI index number?
Cumulus decay earlier…
Who said that? In what science paper? Date and DOI index number?
etc: etc: all the way through.
And references should be taken from science papers, not books or articles.
Then choose your publication journal wisely. I discovered that the Western education establishment will do anything to delay a paper that does not agree with the consensus – by just sitting on it. And you can only apply to one journal at a time.
That is why I went to Geoscience Frontiers in Beijing, because they were open to alternate views. And then the Western education establishment said: “but they are not a real science journal, because they are just Chine…. oh, wait a minute, we cannot say that anymore….”.
Geoscience Frontiers also paid for publication, while Western publication can cost from $6,000 to $16,000, depending upon the number of diagrams, and if you want colour.
The other problem was the quality of Western peer reviewers, which was woeful. I think they skim through them, without having any depth of knowledge.
a. One reviewer read ‘insolation’ as ‘insulation’ throughout the entire paper, so could not understand it at all and failed it.
b. Another reviewer said that CO2 remains at the same proportion (say 240 ppm) throughout the entire depth of the atmosphere, so there is no reason for plants to be starved of CO2 at high altitude. Again, he-she failed the paper.
c. Another reviewer could not tell the difference between glaciogenic dust and CO2-induced dust from the Gobi desert, so failed the paper as not being novel.
(Note: The paper has to include novelty to be published, so you need to emphasise areas where your paper differs from other climate theories and papers. Because a paper on glaciogenic dust had already been published by Ganopolski – and the reviewer could not differentiate glaciogenic dust from CO2-induced dust from the Gobi – he-she said my theory was not novel and failed it.)
Ralph Ellis
Regards atmospheric stability, you might mention Dansgaard-Oeschger events during the last ice age.
These rapid warming events might suggest that the thunderstorm thermostat system has limits, outside which the temperature can increase exponentially.
But you would have to be careful not to invalidate your own theory.
https://en.wikipedia.org/wiki/Dansgaard–Oeschger_event
The reason for D-O events is open to speculation. There is a paper that suggests they are all linked to combustion product events, presumably continental-sized forest fires. Which might suggest a polar-ice albedo mechanism.
Ralph
Ralph, thanks for the excellent critique and info about publishing. Noted.
w.
Willis,
My only nit would be in your conclusions. I think it would be more accurate to say that billions have been spent and trillions of computer cycles wasted.
Don’t use the term “billions of computer cycles”. A gigaflop is a billion floating point operations per SECOND, so billions of computer cycles, even trillions, seems silly. To put it into context, there have probably been millions of computing hours spent on modeling in the last 30 or so years without closing in on a better number for ECS…
Also, re: the discussion above on ECS going to 0. Willis, please avoid the temptation to cut the graphic below ECS values of 1 to “hide the decline”. 🙂
The emerging phenomena are supported theoretically by RC Dewars maximum entropy production principle, MEP, derived from fundamental physical laws and valid even for nonlinear phenomena. Nature creates new dissipative phenomena when needed. I think this is beautifully shown in the many graphs here based on observations. The principle is brought in from meteorological reasoning but solidly derived theoretically by Dewar. One might make a reference to some of his papers.
I am not immediately convinced by your point 5, in particular where you say “However, over large areas of the tropical ocean, the temperature and downwelling surface radiation are negatively correlated. Since decreasing downwelling radiation cannot increase the surface temperature, the only possible conclusion is that in these areas, the increasing temperature modifies the number and nature of the overlying clouds in such a way to decrease the downwelling radiation.” Causality need not be in one of two directions, and correlation does not always imply causation. Are the data hourly or daily? Are temperature changes and downwelling radiation changes here smaller than in the rest of the world, and if so, are other seasonal effects (with causes beyond immediate local temperature and local downwelling radiation) dominating the apparent relationship in these places.
Hi Willis
Thank you for the tremendous effort to articulate your interesting and compelling Tstorm/Tstat theory/hypothesis. As you note, using WUWT for your initial “pal” review (smiley face!) is an excellent first step.
I have three general comments. (I have just been travelling the Covid Contaminated World, so have not had time to work on details…I will try).
1) Overall writing style: As many reviewers have noted, you mix styles quite a bit. Informal to formal, etc. I would recommend you pick a good paper (published) that your really like and respect and “copy” that style. For example, I prefer a very dry, logical, to the point style with references and foot notes for everything. Any assertive statement should have a foot note, or at least a parenthetical reference. Your foot notes and references could be almost as long as the paper….I would highly recommend that you end up with zero unreferenced assertions. Anecdotes and opinions have no place in the paper (unless part of a referenced assertion).
2) What are you really trying to communicate? Are you merely attempting to provide a plausible alternate to run of the mill “C02 Bad”, or are you trying to present a rigorous argument that your theory has demonstrable effect on the earths climate vis a vis global temperature regulation?. I will admit that this draft paper in unsure of which direction…hence comment 3)
3) So What? Whenever I read/hear or am introduced to some idea (new or not), my first internal question is “so what”?. In this case,let me explain my first reaction to your paper: I think you provide an excellent primer as to the general “reasons” why thunderstorms form. Succinctly: Its hot. I see little in the paper that would be argued by anyone. Your basic underlying theory is that thunderstorms have a significant net cooling (or at least significant amelioration to warming) feedback on a global scale. I do not see where your paper makes any real attempt to show that thunderstorms have significant negative feedback to global temperatures. In short, I read the paper as making a good case that thunderstorms form in equatorial regions in response to locally rising temperatures, and as a result, local temperatures fall. Not to be rude, but “so what”?, we all have seen this. I think you need to build on the good foundations that thunderstorms act locally as a “thermostat” and extend to how they have a large enough effect to significantly affect global temperature. In short, you provide excellent analysis that thunderstorms CAN do this, but you do not show that they actually do affect global temperatures.
I would suggest you choose a subset of wuwt denizens as an initial editorial/content “committee”. Do this privately. Then periodically expose the next draft result to the fire hose of full wuwt. I hope you can find a single co author or so. You have a lot of great potential candidates here, and I imagine your travels have filled your “contact” list with many more.
Best Regards,
Ethan Brand
It’s taking me too much time to individually thank people for comments that I use … but know that I read all comments and use many of them. My thanks to all.
w.
I learned a lot from you paper. I personally liked how you started with the lowly dust devil and worked up from there.
As far as large scale Emergent processes, would you consider the slowing down of the Gulf Stream to be one ?
Less salty water (from polar ice melt runoff) in the artic is not sinking and then returning to the equator as a bottom level southern current to replace the surface current water heading north. Result is colder weather in France and Germany, and eventually the polar regions too.
I personally think this is a natural negative feedback process, although the main thoughts I have read seem to point it out to be another pending disaster.
Yes, for a time there is a greater and greater heat imbalance between the Northern regions that enjoyed the stream’s warmth and the buildup of heat in the central Atlantic from not being able to ship hot surface water anywhere, but then thunderstorms will increase to cap surface water temperatures to ~ 30 deg, the Northern regions will get colder, the Northernmost waters will eventually get saltier as meltwater volumes decrease, and the Gulf Stream current will start flowing again.
“5) This implies that temperatures are unlikely to vary greatly from their current state because of variations in CO2, volcanoes, or other changing forcings. The thresholds for the various phenomena are temperature-based, not forcing-based. So variations in forcing will not affect them much. However, it also opens up a new question—what causes slow thermal drift in thermoregulated systems?”
Northern Annular Mode anomalies are forcing-based, so ENSO and the AMO are also forcing-based. During centennial solar minima, El Nino conditions increase and the AMO is warmer. Because of weaker solar wind states causing increased negative NAM anomalies. The warmer SST’s then reduce low cloud cover and increase lower-mid troposphere water vapour, so they are self amplifying negative feedbacks. A cold or a warm AMO phase gets locked in for decades, that’s not simply thermoregulatory.The point is that the global mean temperature changes inversely to changes in forcing at inter-decadal scales, and that post 1995 warming is a negative feedback.
This paper does not contain a single math equation. In atmospheric & climate science, one cannot prove/advance a new concept without using proper math.
The empirical correlations between near-surface temperature and satellite-observed SW & LW fluxes cannot be understood in physical terms without physics-based mathematical analysis of temperature drivers. We have already conducted such an analysis, and the results were presented at the 101st Annual Meeting of the American Meteorological Society last January. Here is the video presentation that explains some of the empirical correlations shown by Eschenbach:
Role of Albedo in Planetary Climates: New Insights from a Semi-empirical Global Surface Temperature Model
https://www.youtube.com/watch?v=Gv66_mpJz-c
I don’t think this paper could be published in a peer-reviewed journal in its present form as Mr. Eschenbach hopes!
I showed this paper to an ocean scientist, a former student of mine. While she could not conclude it was right or wrong, she did say there was not one equation in it.
This is work in progress, putting equations in before you have understanding is not helping. When people put equations in climate science, the equations have always been static equations with the final answer working toward a stable climate temperature. The climate system is dynamic with alternating warm and cold phases. There have been no papers that included that.
One of my best friends in college figured that out. He said, you write a bunch of equations, you intergrade or take derivatives and come up with the equation they asked you to derive. You just present back what that they told you. They did not understand it and you do not need to understand it, you just need to present what they presented. When papers have a lot of equations in them, many of them are there because papers with more equations, even when they mean noting, are published just because more equations are there, and they know that will help them get their next paper published.
Ned
The phenomenon of emergent temperature homeostasis is established, so Willis’ proposition is a reasonable one. Emergent nonlinear phenomena and attractor landscapes don’t follow the same rules as the arithmetic of “La La Linearland” that is not really relevant to climate. To the extent that maths is applicable, it’s of a different kind.
Here’s a study from 2016 describing emergent homeostasis:
https://direct.mit.edu/isal/proceedings/alif2016/28/608/99454
We demonstrate the emergence of spontaneous temperature regulation by the combined action of two sets of dissipative structures. Our model system comprised an incompressible, non-isothermal fluid in which two sets of Gray-Scott reaction diffusion systems were embedded. We show that with a temperature dependent rate constant, self-reproducing spot patterns are extremely sensitive to temperature variations. Furthermore, if only one reaction is exothermic or endothermic while the second reaction has zero enthalpy, the system shows either runaway positive feedback, or the patterns inhibit themselves. However, a symbiotic system, in which one of the two reactions is exothermic and the other is endothermic, shows striking resilience to imposed temperature variations. Not only does the system maintain its emergent patterns, but it is seen to effectively regulate its internal temperature, no matter whether the boundary temperature is warmer or cooler than optimal growth conditions. This thermal homeostasis is a completely emergent feature.
Maths is the study of patterns. Equations are only one way of describing them. Equations are not mandatory. But where has Willis claimed that it is a maths paper?
Ned,
I agree that Willis may have problems publishing in a peer-reviewed journal but not for the same reasons you offered.
He will have trouble because he disagrees with consensus.
The math equations in many peer reviewed papers are not even considered. They put garbage in and get garbage out of their equations, many of which equations are garbage themselves. It the conclusions supports the agendas of the publishers, it gets published. If not, it does not.
You and Karl put one over on them, big time, when you published with your names spelled backwards and you published stuff they did not understand that did disagree with their consensus.
There is enough knowledge about the climate system to better understand the many external and internal factors that work together to make the climate systems cycling in stable, well bounded limits.
There has been no serious effort to pull the knowledge together and form a new consensus based on best evidence using best records of past and present. We have worked separately and only told each other what we disagreed with. All this stuff works together and understanding it together should be a best way forward.
I like my polar ice cycle theory, but it could not work if your pressure theories were wrong and it could not work if Willis’s tropical thunderstorm theory was wrong.
Ned, I have tried to have you, and/or Karl, include internal response of the climate system that includes ice cycles since I listened to you and Karl talk at a conference in London.
I believe a dozen or more of us all had lunch at Shakespeare’s Head on the first day of the Conference.
Interesting ideas, I do not like how you have structured it that much though. I think your predictions are not predictions for example, they are a set of observations that you hope to explain via the emergent phenomena you introduce. If it were a prediction, you would predict, then go and do the measurement to see if you were correct. I do not think you did it that way round, and would advise that you reframe it.
If I were you I would not try to write a paper trying to disprove the global warming paradigm either. Perhaps you could consider writing a paper where you propose the emergent phenomena as an as yet unconsidered effect in models, and try and quantitively come up with how big the effect would be and show evidence for it in the data as you do. You would then be able to build on that going forward.
Note I am not saying you are wrong, but you are putting an enormous scope on the work. If instead you show something new, relevant and get it out there it will be good for your credibility and poke holes in the unassailable edifice you clearly want to assault.
Also, I want to say I enjoy reading your posts, you clearly have a lot of insight and are a natural skeptic, an important trait in science, so keep up the good work.
I learned a lot from you paper. I personally liked how you started with the lowly dust devil and worked up from there.
As far as large scale Emergent processes, would you consider the slowing down of the Gulf Stream to be one ?
Less salty water (from polar ice melt runoff) in the artic is not sinking and then returning to the equator as a bottom level southern current to replace the surface current water heading north. Result is colder weather in France and Germany, and eventually the polar regions too.
I personally think this is a natural negative feedback process, although the main thoughts I have read seem to point it out to be another pending disaster.
Yes, for a time there is a greater and greater heat imbalance between the Northern regions that enjoyed the stream’s warmth and the buildup of heat in the central Atlantic from not being able to ship hot surface water anywhere, but then thunderstorms will increase to cap surface water temperatures to ~ 30 deg, the Northern regions will get colder, the Northernmost waters will eventually get saltier as meltwater volumes decrease, and the Gulf Stream current will start flowing again.
If it were a prediction, you would predict, then go and do the measurement to see if you were correct.
This is about the climate, you check you answer in a hundred years.
If I were you I would not try to write a paper trying to disprove the global warming paradigm either.
The Global Warming Consensus is Wrong. That is the whole point of doing alternate research, the people who are supposed to do the research work for people who do not allow disagreement.
Less salty water (from polar ice melt runoff) in the artic is not sinking and then returning to the equator as a bottom level southern current to replace the surface current water heading north.
Right, the ice being dumped into the arctic chills the saltwater to cold enough to freeze ice cream in an ice cream maker and it is the warm saltwater currents that are chilled and sent back to cool the tropics.
The freshwater evaporates and rebuilds the sequesterd ice or freezes and becomes sea ice.
Northernmost waters will eventually get saltier as meltwater volumes decrease, and the Gulf Stream current will start flowing again.
The Gulf Stream has not stopped flowing, that is the only factor that has ever thawed the Arctic Sea Ice.
Right, I didn’t mean stopped flowing; only that the flow rate varies over time to change the heat distribution. If the Gulf Stream slowed down by a significant enough amount, northern Europe’s snow would reflect energy back into space, the snowpack would increase, and hurricanes would pull heat out of the ocean and to the tops of the atmosphere for additional radiation to space, while its clouds would block the sun in its 1000 mile typical radius. So all these things are negative feedback systems that ’emerge’ to keep things in long term balance. All these things keep us from loosing all the ice at the poles. Its a back and forth, maintaining a balance within the earth’s surface systems and even regulating how much is absorbed from the sun.
Excellent observations. Encourage you on greater descriptive differentiation in the different regimes and their transitions in your predictions. Particularly on how to describe transitions, trends between, and parameters that could make quantitative predictions.
Recommend plotting the SLOPE on the other axis.
Then make initial predictions about transitions between which major emergent phenomena based on breaks in curve, and in steps / transitions in slope. Then how to predict those transition points and the slopes before and after.
Prediction 1. Show 3 regimes with breaks. e.g. A) Declining about linearly. Then transition to B) near horizontal near ocean freezing. Then transition to third C) declining region. at ~ 26C. Predictions on slopes in A and C and near horizontal in B.
Prediction 2 Fig. 3. Major transition between about horizontal up to ~26 C then rapid rise (quadratic?) above.
Prediction 3 Plot the divergence between the two curves. e.g. Onset rise to intermediate difference, then join. (Possibly two oscillations?) Length of time between the divergence and convergence? As a function of magnitude of the eruption?
Prediction 4 Fig 6. Plot the slope – Show three regimes, the breaks between them, and characteristics of each. e.g. Rapid near near linear rise from 100 to 180. Flat above 660. Thus major early & end regimes with a continuous transition between them?
Prediction 5 Fig 7 Two major regimes. What transition between? A function of tropical cumulous clouds? Depth of Cloud? Boundary of change in ocean temperature? vs radiation?
Compliments. Best regards David
Willis See gmail ver C & comments
Could emergent temperature regulation of climate be called “climate emergency”? 😀
How about “climate action”? Eg.
Somehow, Mother Earth, on her own, engages in the most powerful of climate actions.
Listening to DeBussy La Mer while reading this contribution from Willis didn’t necessarily increase my understanding but but the three movements are a good fit for the subject matter. It made reading this even more of a pleasure than it already is.
Nice music. I scraped mine off of an old LP i found at a thrift story, the best version I’ve heard so far: .L’Orchestre des Concerts Colonne/Pierre Dervaus (1961).
I listen to it before bedtime every week or so.
Willis – I’ve seen complaints here that the language isn’t dry enough (that is, not turgid enough to comply with the normal published standard) and that there aren’t enough equations. They might even be correct if it is required to submit it to Nature or suchlike.
However, when it comes to explaining the process itself, and seeing what happens as the water (or damp land) heats up, I’m totally happy with the descriptive methods you use, maybe especially since I do much the same when exploring an idea. The only complaint I’d have was the plots of “lowess smooth” without specifying what that term is, since though it is pretty intuitive that it’s an average of the scatter-plot it’s not obvious what algorithm is used to produce it or why the resultant line should actually be smooth.
The underlying proposal, that as the day progresses the evaporation will cause water to be evaporated, and that if enough water-vapour is in the air then we’ll get clouds that block off the sunshine and thus cool the ground level, should be totally understandable and for a lot of people would be daily experience (if not at home, then for holidays in a hotter place).
Whereas CAGW seems surprised at 1°C rise since 1850, I’m surprised at the constancy of the average temperatures on a long-term basis, which tells me there’s some pretty severe negative feedback in the system. For example the attached plot.
There’s also a fair degree of error involved in taking an average from a set of weather-stations where the locations of those stations have changed, the instruments have changed, and the procedures (time-of-day) are changed over time. Thus a degree difference in 150 years or so is within the error-band, and we can’t assume that it’s a valid number anyway.
I have the same problems in what I write, by explaining why it happens and showing the evidence, so my efforts also wouldn’t be accepted in learned journals. I’ve also shown some pretty basic laws of physics are not always true. I think the problem you’ll face with this is that the people who need to understand are earning their money by not understanding it. They believe that CO2 is causing the weather to get worse, and that reducing it is the only way to stop the sky from falling, and there’s very little evidence against that that will be accepted even if they can see that evidence outside their window or experience it daily. How warm the day is depends very much on how cloudy it is, and so anything that affects the cloudiness will have a major effect that anyone walking around outside can feel.
This article really needs to go to a magazine, since it’s aimed at the moment at people who aren’t thick but haven’t too much science knowledge, but do have common sense (which isn’t actually that common). I don’t see it getting past Nature’s gatekeepers no matter how it’s rewritten.
I’d add a prediction 6, which is that since the poles are warming while the equatorial regions have a hard limit, then the energy available for storms and tornadoes (which is based on the difference between those limits) will on average reduce as CO2 rises. That doesn’t stop weather happening, and the random excursions from historical averages, but will make them less frequent. The variation of the equivalent of ECS with local temperature does have an advantage.
I think the problem you’ll face with this is that the people who need to understand are earning their money by not understanding it.
You nailed that part exactly right
people who aren’t thick but haven’t too much science knowledge, but do have common sense (which isn’t actually that common).
Common Sense is very common, but, unfortunately, it is common sense to not get involved in confrontations with the fanatics, so we don’t hear from most of them. We did hear from many of them when they voted for Donald Trump.
the poles are warming while the equatorial regions have a hard limit,
The poles have a hard limit also, when sea ice is thawed, it snows more until more sequestered ice dumps into the warm ocean currents and forms sea ice again. There have been alternating warmer and colder polar climates for fifty million years.
It seems to me that you have not defined “sensitivity” in any meaningful way, and consequently you can equivocate on that term. Case in point:
This does not match any definition of sensitivity that I’m familiar with. Sensitivity has to do with the expected change in global average surface temperatures when reaching equilibrium with a given change in radiative forcing: dT = λ*dF. ECS is the amount of change in global average surface temperature once temperatures reach equilibrium with a doubling CO2. It’s a specific case of dT in the equation dT = λ*dF where dF is 3.71 W/m^2 (the increase in radiative forcing from a doubling of CO2). Equilibrium temperature changes in proportion to a change in radiative forcing, with a constant of proportionality (sensitivity) of λ.
The example you give doesn’t fit these definitions because at any point in time it is early morning at some part of the globe and it is late morning in another, afternoon in another, and the middle of the night in another. There’s no change in “sensitivity” in your example. GMST hasn’t changed at all.
Perhaps you mean something more like Transient Climate Response but even that strictly speaking refers to the change in GMST over a 70 year period (1% increase in CO2/yr). I can’t think of any way in which your examples would qualify as “sensitivity” in any meaningful sense.
You wrote: you have not defined “sensitivity” in any meaningful way,
I do not know if Willis explained the definition of ‘sensitivity, in a meaningful way.
Willis did explain what he was describing in a very meaningful way.
It gets hotter until thunderstorms are started to reverse the warming.
We have all seen that. I have been caught on lakes on a sailboat when unexpected thunderstorms chilled my day. It is hugely cooler immediately, actually cold with wind and water and wet clothes.
But that isn’t sensitivity in any meaningful sense. What he’s arguing is dependent on temperature isn’t sensitivity. That’s my point.
https://www.researchgate.net/publication/8069906_Stable_sea_surface_temperatures_in_the_Western_Pacific_warm_pool_over_the_past_175_million_years
Willis,
Here are some more thoughts for you to ponder:
I guess what all these suggestions are getting at is tying the argument together more securely, and explaining more about the mechanism in play.
More to come after I think…
You wrote: Do you have, or can you get, data
You could ask Joe Bastardi,
He has a huge storehouse of past climate data and knowledge.
He especially knows past storms. You can find him on twitter
The usual explanation for this difference is that air becomes more water vapor laden and fuels the late storms.
when air cools to the dewpoint, fog or clouds form, more water vapor in, more precipitation out, when conditions are right, I have seen hard rainfall from a clear blue sky, water vapor formed raindrops that fell with no visible cloud. When the solar energy into the clouds is reduced the cloud must turn more water vapor into water or ice to stay in balance. As solar energy in increases, a cloud can accommodate more and more water vapor, when the solar energy decreases after noon and into dark, precipitation takes care to keep the cloud temperature at the dew point.
A proper weather person could explain this better, but this was my understanding.
It is also worth noting that almost nowhere on the planet does the long-term average temperature go above 30°C.
========
Willis, it looks like the ECS goes to zero or perhaps negative in Fig 6 around 27C or 28C. It might be worth mentioning that this is the minimum average temperature that humans can survive without technology. Any lower and we eventually die of exposure. Also 27.5C is the average temp of Earth’s jungles and has not varied much for 4 million years. Strange coincidence or ????
It seems more likely that humans are heat adapted and evolved to survive temperatures much higher than current earth temps. And except for technology almost no place on earth today could support human life.
The tropical jungles are warm enough but without fire to keep the insects away it would be a miserable existence.
I used to have a great book, lost to time. The title was something like ” the little book of english grammar”.
As the title said the book was little. It could fit in your pocket. It covered technical writing along with many other subjects. Well worth reading.
The book did say that the very best writing style duplicates the spoken word. Simple, direct construction.
Flowery language and run on sentences impress the writer more than the reader. Subject verb object is a sentence.
Willis I believe this is the great grammar book I mentioned. I likely had an earlier edition.
Little English Handbook
by Edward P.J. Corbett and Sheryl L. Finkle
$4.19
“the text also serves as a guide to the conventions of research writing and documentation providing coverage of online sources and ACW documentation style for citing those sources as well as coverage of MLA, APA, CBE and CMS documentation systems”
https://www.thriftbooks.com/w/the-little-english-handbook-choices-and-conventions-with-mla-update-8th-edition_sheryl-l-finkle/366836/item/123807/?gclid=Cj0KCQjw1a6EBhC0ARIsAOiTkrHTjcoAaA-B5UuPVItRswbC-3JN6zPYWRZFNcVQkrdiRM5QIN-y33caAutnEALw_wcB#idiq=123807&edition=2265740
Thanks, Ferd, appreciated.
w.
Thanks for posting a draft and asking for comments. As I have experience writing Nature papers, here are a few comments. I would be happy to further advise you one-on-one.
I agree with the various comments that suggest changing the style from more of a blog post to a scientific paper. Your goal should be to write a conventional enough paper with good content so that it will be embarrassing for the scientific establishment to reject it.
It’s great that you wish to change the dominant paradigm, but to do so you should describe your work in a way that is as close as possible to present thinking, to make it easy to change. My idea here is to focus your discussion on well-established data. The work also needs to be semi-quantitative, as others have pointed out. Here are my suggestions for a better flow to the explanation, after an introduction where you motivate a change from the \lambda assumption.
Start with explaining why the sea-surface data, especially at the equator, is critical since it is a main driver of global climate. I assume this is because the equatorial regions have the greatest surface area and highest sun angle, and that long-term the main storage of heat is in the oceans.
Then start describing the CERES data, especially Fig. 6, since this data will be difficult to dispute. You then point out that the surface temperature plateaus at 30C, which is clearly exhibited by both the scatter points and smoothed data. Only then should you start talking about the thunderstorm physics, which explains why the CERES data makes sense and can be trusted. Here you want scientists to accept your premise based on the CERES data, since it is quantitative and will be accepted by the scientific community: as an outsider, scientists will not accept your personal explanation, however true and well written. This reordering and emphasis on data is most important for being persuasive.
Your explanation of the thermostat effect from saturation is reasonable, but being qualitative it is not yet convincing. For me, the big question is whether saturation is already included in present models (you need references) and how big is it (you need math). Fortunately, for a paradigm-shifting paper you don’t need a super detailed model, as that can come later. But you do need a simple model to express the approximate magnitude of the effect, which will convince people this new paradigm is worth considering.
For me, the obvious check is through the climate sensitivity parameter \lambda. Its value from Fig. 4 of your reference 1 is about 2 W/m^2 per C (or a bit lower), whereas the slope below 30C from your Fig. 6 is approximately constant at about 100 W/m^2 per 10C, about 5 times higher. It’s good that these two numbers are within a factor of 10, but they differ because of physics details and the complexity of climate. However, one possible explanation is that the accepted value 2 is lower than 10 because of the effects of saturation, where some kind of averaging when \lambda is 0 or negative lowers its effective magnitude. This of course is the point of your paper. So the important question is whether this effect has already been considered in prior models. You need to fully address this possibility with references and discussion about them.
Since climate models are very complicated, there may be another way to address the importance of saturation. Let’s assume saturation is not in any of the models: is it a big effect? By looking at figure 6, saturation does not seem important since it is only at the upper 5% of the radiative range. But this is a wrong way to look at the data. You need a simple way to explain that most of the solar energy is absorbed at the equator, in this saturated range. One suggestion is to calculate the fraction of the total energy that is absorbed in saturation, and then put this number in Fig 6 so that readers see that this dominates energy absorption, and thus the effective \lambda. (A more precise way would be to plot the surface fraction versus energy in a distribution or a cumulative distribution.)
If this energy fraction is greater than say 50%, readers will start to consider your warning that saturation is something that needs to be modeled carefully. I am sure a better model can be built to simulate the saturation physics in a straightforward way to estimate this even better. The idea here is not to make a precise prediction of \lambda, but to argue that saturation has a significant contribution to any model one might make, and it must be included in better models.
Thanks, John, excellent points all.
w.
Just a thought. Can’t you just model dust devils and thunderstorms like a change in Reynold’s number – i.e. a change from laminar flow to turbulent flow where the dust devils and thunderstorms are the turbulence? This is not meant as a disagreement with your theory – quite the contrary. Just thinking out loud.
Reynolds
This assertion that the stability of the global average surface temperature is “most surprising” seems to be the foundation of your paper. Yet, I don’t see that (in your opening paragraphs) you’ve offered any real justification for this assertion, let alone one that “strongly argues for some global thermoregulatory mechanism.”
You argue that a temperature variation of ± 0.2% is surprising because “the system rejects a variable amount of incoming energy.”
But, how large is that variation in “incoming energy”?
If the incoming energy varied by ± 10%, then the level of temperature variation you’ve cited would indeed seem most surprising. But, if incoming energy varied by only ± 0.0001%, then it would perhaps be the lack of stability in temperature that would be more surprising. In the absence of quantitative information about variations in energy input, the assertion that one ought to be “surprised” by temperature stability seems to be entirely unfounded.
How much does “incoming energy” vary?
According to one reconstruction of TSI (Total Solar Irradiance), the 11-year running mean of reconstructed TSI has varied over a range of about ± 0.033% over the 20th Century (see Fig. 5). Within an 11-year solar cycle, TSI varies by perhaps ± 0.1%.
Given the simple energy balance relationship (1/4)(1-A)S = 𝜀σT⁴ where S is TSI, A is albedo, and T is temperature (which holds in a naive global temperature calculation), one would predict ∆T/T = (1/4)(∆S/S). (This results from S being proportional to T⁴; none of the proportionality constants matter, except to the extent that those too are varying.) So, if the 11-year-running-average TSI varies by ± 0.033%, one might predict that the 11-year-running-average T would vary by ± 0.008%. If one takes into account the much larger ± 0.1% TSI variations over an 11-year solar cycle, perhaps T would be expected to vary by around ± 0.025%.
So, far from it being the case that there are large variations in incoming energy which need to be compensated for, it would seem as if the variations in incoming energy are insufficient to easily explain the (arguably) surprisingly large variations in average global surface temperature.
In light of this comparatively high degree of stability in solar insolation (and the modest first-order sensitivity of temperature to variations in insolation), why would a temperature variation of ± 0.2% constitute a “most surprising” degree of stability?
In the absence of some explanation of this, your paper seems to start of rather weakly.
If I’m missing something, I’d be happy to have that be pointed out.
Thanks, Bob. My apologies for the lack of clarity. By “incoming energy” I meant the amount of energy that actually enters the system, not the total available energy at the top of the atmosphere (TSI). At any given instant at a given point on the globe, the total amount of solar energy entering the system at that point can vary from zero W/m2 to 1360 W/m2 …
On average, about 30% of that incoming energy is reflected back to space … but this also varies widely in space and time. And the variations in that value are mostly controlled by nothing more stable or permanent than clouds …
So yes, given that system, stability to ±0.2% is indeed surprising.
My best to you,
w.
Regarding dust devils, you write:
Regarding “tropical cumulus fields and the ensuing tropical thunderstorms, particularly over the ocean” you write:
In both the illustrative example of dust devils and the more central example of tropical cloud formation and thunderstorms, you refer to the existence of a temperature-based threshold for these phenomena emerging.
This seems to beg a critical question: is the threshold related to absolute temperature or relative temperature?
If the threshold were related to absolute temperature (e.g., surface temperature reaches X Kelvins), then that could bolster an argument that the phenomenon in question could help regulate the absolute global temperature.
However, to me, it seems far more likely that the emergences of these phenomena are determined by relative temperatures, i.e., the temperature difference between the surface and some relevant portion of the atmosphere. It’s that temperature difference that drives convection.
To the extent that these phenomena are triggered when temperature differences cross a threshold (and not by any effect dependent on absolute temperature), this would seem to greatly weaken the argument that such effects could help regulate absolute planetary temperature.
After all, if the ocean surface and the entire troposphere were both 3℃ warmer, would there be any significant difference in the timing or intensity of cloud formation and thunderstorm activity? I’d guess these would not change much (to first-order, anyway) if both surface and atmosphere warmed. And if these phenomena are insensitive to such an overall temperature change, how could these phenomena help regulate absolute temperature?
Your discussion of the dynamics of tropical cloud formation and storm activity make a strong case for these phenomena helping to regulate the temperature differences between the surface and the troposphere (and also, regulating the average rate at which sunlight can warm the ocean surface on a given day).
However, as yet, I’m not seeing that you’ve made a case for these phenomena contributing to stabilizing absolute planetary temperature.
Am I missing something?
Bob, you say:
Heres a movie. Thunderstorms are the major temperature regulating phenomenon. Colors represent thunderstorms by cloud top altitude. Contour lines are SSTs. Looks like absolute temperature to me …
w.
Thanks.
I want to check if I understand why you believe the movie (and perhaps also your Figure 3) indicate a dependence on absolute temperature… I’m guessing you’re see that the areas of high thunderstorm activity (as evidenced by the cloud height proxy) match the areas outlined by a particular ocean surface temperature contour? You’re seeing that when temperature is above 26°C – 27°C, there is generally a lot of thunderstorm activity? And you’re taking that as evidence of dependence on absolute, rather than relative, temperature?
Have I got it?
If so, then I’m afraid I don’t agree that you’ve made a case for an absolute, as opposed to relative, temperature threshold.
Consider two possible hypotheses, about the threshold for tropical thunderstorm activity:
Hypothesis A involves an absolute temperature threshold. Hypothesis R involves a relative temperature threshold.
I see nothing in your movie, or in your Figure 3, which offers an indication that Hypothesis A is correct and Hypothesis R is incorrect. These two hypotheses make identical predictions with regard to your data sets. Yet, they have totally different implications, with regard to the ability of tropical thunderstorms to stabilize global temperature.
I don’t know for certain which hypothesis will eventually prove to be closer to being correct.
However, some theoretical arguments lead me to believe that Hypothesis R is far more likely to be valid than Hypothesis A:
Just looking at what I understand of the physics of thunderstorms, I see nothing to justify the possibility of there being an emergent absolute temperature threshold.
The only place in the global climate system where I see any plausible basis for a dependency on absolute temperature is at the poles, insofar as the melting point of ice depends on absolute temperature. It seems to me to be a real stretch to construct a scenario in which that could lead to an absolute temperature threshold for thunderstorms in the tropics. Yet, it is enough of an anchor to absolute temperature that I can’t completely rule out Hypothesis A as a possibility.
But, I don’t find it a compelling argument in favor or hypothesis A. On a theoretical basis, Hypothesis R (or something in its neighborhood) seems to me more likely to be true.
Bottom line: I don’t see any evidence favoring an absolute temperature threshold over a relative temperature threshold, and I see theoretical arguments as lending more credibility to the idea of the the threshold being in some way relative.
And, if the threshold is relative, that would seem to undermine your core thesis that tropical cloud formation and thunderstorms act as a thermostat to help regulate average global temperature.
I’m very interested in your core thesis. But, I don’t yet perceive you as having made your case.
Do you see anything wrong with the analysis I’ve offered?
(I do want to spend some time thinking about the other evidence you offer in your essay.)
Thanks, Bob. You say:
I’m confused. For this to be true, thunderstorms would have to be responding in some fashion to the global average near-surface air temperature.
The global average near-surface air temperature is a mathematical construct. It doesn’t exist in the real world. How can thunderstorms respond to something that only exists in the minds of mankind?
Thunderstorms can only respond to local phenomena, not global phenomena, and certainly not to mathematical constructs.
As a separate piece of evidence, consider the fact that nowhere in the open ocean does the average SST go above 30°C. The nearest is in the Pacific Warm Pool, which is the area north of Australia where you see the mass of thunderstorms capping the temperature.
Evidence supporting my theory is that this temperature maximum in the Pacific Warm Pool is absolute rather than relative is given in the paper “Stable sea surface temperatures in the western Pacific warm pool over the past 1.75 million years”
Best regards,
w.
Thanks for naming the way that this hypothesis doesn’t seem to make sense.
I agree that thunderstorms respond to local phenomena. Yet, it’s also the case that local phenomena are influenced by more global phenomena.
The physics of convection suggests that strong convection ought to arise when the environmental lapse rate, 𝚪ₑ, reflects the surface temperature being sufficiently warm relative to the temperature of the upper troposphere. One can see in data about the atmosphere (see PT Figure 4) that the tropics is where the atmosphere is unstable because the environmental lapse rate closely matches the moist adiabatic lapse rate.
The temperature in the upper troposphere, and at the tropopause, is not a purely regional phenomenon. It is affected by global circulation patterns, and these in turn are affected by temperature distributions around the globe. There are cooler parts of the planet to which hot air can circulate, and this allows the air high above the tropics to remain cool enough to allow convection to continue. The temperature of the tropopause (which doesn’t vary greatly with latitude, cf., PT Figure 1) seems to be an emergent phenomenon of the global climate system.
Hence, it seems plausible, even likely, that the threshold for initiation of thunderstorms would be relative to a temperature which is a reflection of global temperature patterns.
* * *
I could express this more formally, which may or may not be helpful. It’s ok to skip this part, if it’s not.
My Hypothesis R (let’s call the initial formulation R₀) was a proxy for a variety of more nuanced hypotheses.
Here’s some more detailed logic to support other versions of Hypothesis R:
This sort of rough logic might justify a Hypothesis R₁ that thunderstorms happen when Tₛ – Tₜ exceeds some threshold, or a Hypothesis R₂ that thunderstorms happen when Tₛ – Tₐ exceeds some threshold.
I’m not suggesting that thunderstorms respond to mathematical constructs. But, mathematical constructs may offer approximations to aspects of the local conditions that affect thunderstorm initiation. And local conditions are not independent of global conditions.
* * *
So, those are some detailed arguments which support the idea that Hypothesis R might be physically plausible.
But, I don’t want to lose track of the fact that some of your evidence (e.g., the movie and your Figure 3) doesn’t offer any way to differentiate between Hypothesis A and Hypothesis R; they confirm or invalidate both hypotheses equally.
And, I’d like for there to not be a double-standard in thinking about the physical plausibility of the hypotheses.
So, if one is going to quickly reject Hypothesis A on the basis of lack of a theoretical foundation, in the absence of a double standard, I would think one would need to be at least as skeptical about Hypothesis A.
* * *
I’m not writing any of this to “rain on your parade” (so to speak). I’m imagining that you’d like whatever you present to be both (a) as scientifically correct as it can be, and (b) capable of standing up to critical scrutiny.
I’m hoping that by my articulating this issue (and possibly other issues I might get around to naming), this might help you to clarify your thinking so that your theory becomes more scientifically accurate and/or you become more able to present your theory in a way that skeptics will find compelling.
* * *
Thanks for the pointer to Stable sea surface temperatures in the western Pacific warm pool over the past 1.75 million years.
I agree that the relatively stable SST in the Western Pacitic Warm Pool with a temperature range near your proposed absolute threshold offers some intriguing evidence that could support your hypothesis.
It’s interesting insofar as this temperature stability was maintained during a period when the mean global temperature dipped by around 6℃. Unlike the data we talked about previously, this data differentiates between Hypothesis A and Hypothesis R, and the data are suggestive of favoring Hypothesis A.
The lack of a theoretical basis for Hypothesis A remains worrisome. In the absence of any theoretical foundation, it seems like an extraordinary claim requiring extraordinary evidence.
In this, and other references to “climate sensitivity” you are using the term in a non-standard way which I expect has the potential to generate confusion, resistance, and unproductive discussion.
What you are talking about is something that one could argue is a proxy for “climate sensitivity”, but which is quite a few steps removed from climate sensitivity as it is conventionally defined.
I think if you were explicit/clear that you are talking about a proxy for climate sensitivity, then this might open the way for much more productive conversation in relation to your ideas.
For clarity, it would help to give what you’re talking about a distinct name:
I’d like to name some of the differences between Climate Sensitivity (CS) and your Climate Sensitivity Proxies (CSP) :
Each of these differences has the potential to be very significant. Because of these differences, CS and CSP are not the same thing. Yet, perhaps, as you’re implicitly suggesting, they are related in a way that matters.
Maybe studying CSP can offer powerful insights into the behavior of CS.
But, this is not a forgone conclusion. I think you need to make a case for why and how and why you would expect the behavior of CSP to be predictive of the behavior of CS.
I feel hopeful that being explicit about CS and CSP being distinct concepts, and unpacking the relationship between them, could contribute to everyone’s clarity and to the general quality of thinking about these subjects.
I hope this suggestion is helpful.
I think there is a question mark regarding the downwelling radiation. You say that the data is from CERES.
My understanding is that CERES LW-downwelling data is an estimate based on clear-sky. Not a measurement.
The model is that the cloudy sky downwelling is proportional to the clear sky downwelling multiplied with a cloud correction factor.
If this estimate is erroneous it may have some impact on your analysis (e.g. if the LW-downwelling for cloudy sky is less than the CERES estimate).
CERES provides both clear-sky and all-sky datasets. I’ve used the all-sky data, which includes both clear and cloudy skies. Details of the CERES datasets are at the CERES link given above.
w.