Fast Fourier Transforms. Spectrum Analyzers. Waterfall displays. Not long ago, such terms were reserved for high end test gear. But oh, how things have changed! It’s no surprise to many Hackaday readers that modern microcontrollers have transformed the scene as they become more powerful and as a result are endowed with more and more powerful software libraries. [mircemk] has used such a library along with other open source software combined with mostly off the shelf hardware to create what he calls the DIY FFT Spectrum Analyzer. Rather than being a piece of test gear, this artful project aims to please the eye.
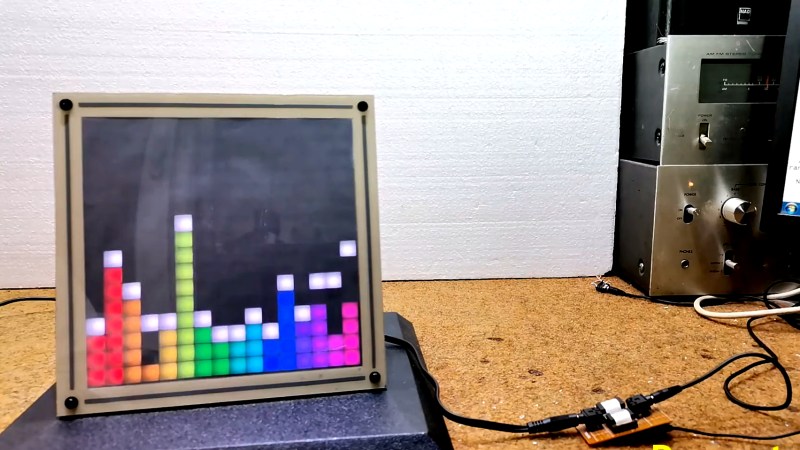
The overall build is relatively simple. Audio is acquired via a line-in jack or a microphone, and then piped into an ESP32. The ESP32 runs the audio through the FFT routine, sampling, slicing, and dicing the audio into 16 individual bands. The visual output is displayed on a 16 x 16 WS2812 Led Matrix. [mircemk] wrote several routines for displaying the incoming audio, with a waterfall, a graph, and other visualizations that are quit aesthetically pleasing. Some of them are downright mesmerizing! You can see the results in the video below the break.
Of course the build doesn’t stop with slapping some hardware and a few passive components together. To really be finished, it needs to be encased in something worth displaying. [mircemk] does not disappoint, as a beautiful 3D-printed enclosure wraps it all up nicely.
We think that the final product is great, and it reminds us of some of the very things that inspired us early on in our hacking careers. We would love to see this project integrated with an Interactive Musical Art Installation of any kind, the more esoteric the better. Perhaps a 555 timer synth could fit the bill? Be sure to share your own hacks with us via the Tip Line!


It needs 2 or 3 more buttons and a Tetris easter egg…
One suggestion I’d make is to consider adjusting for hearing sensitivity. We tend to perceive sound above 1Khz way louder than they are signal wise which is reflected in our recordings. In a visualizer with a flat response this tends to result in the low-middle seeing all the actions while the higher bands do little even when putting out a deafening sound.
Otherwise it is neat. Visualizers are in the same category as clocks. Plenty have made them, yet it rarely gets tiring when one sees them