
The graph above shows mid July to mid August daily ice extents for 2021 compared to 14 year averages, and some years of note.
The black line shows during this period on average Arctic ice extents decline from ~8.3M km2 down to ~5.9M km2. The 2021 cyan MASIE line started ~400k km2 below average but as of yesterday was slightly surplus. The Sea Ice Index in orange (SII from NOAA) started with a deficit to MASIE (in cyan) of ~300M km2. August 14 saw the two indices mid August close together, close to average and surplus to 2007.
Why is this important? All the claims of global climate emergency depend on dangerously higher temperatures, lower sea ice, and rising sea levels. The lack of additional warming is documented in a post Adios, Global Warming
The lack of acceleration in sea levels along coastlines has been discussed also. See USCS Warnings of Coastal Flooding
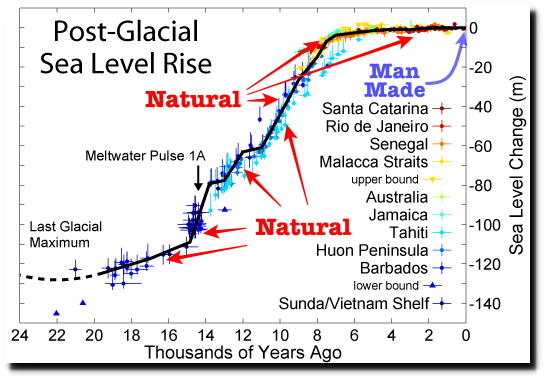
Also, a longer term perspective is informative:
 The table below shows the distribution of Sea Ice across the Arctic Regions, on average, this year and 2007.
| Region | 2021226 | Day 226 Average | 2021-Ave. | 2007226 | 2021-2007 |
| (0) Northern_Hemisphere | 6066634 | 5889687 | 176947 | 5727937 | 338697 |
| (1) Beaufort_Sea | 915133 | 688804 | 226329 | 777766 | 137366 |
| (2) Chukchi_Sea | 572339 | 404505 | 167834 | 260048 | 312290 |
| (3) East_Siberian_Sea | 624917 | 556990 | 67927 | 196982 | 427934 |
| (4) Laptev_Sea | 52213 | 252434 | -200221 | 316363 | -264150 |
| (5) Kara_Sea | 173342 | 88626 | 84716 | 201115 | -27772 |
| (6) Barents_Sea | 5256 | 29027 | -23771 | 17324 | -12068 |
| (7) Greenland_Sea | 118995 | 224977 | -105982 | 316155 | -197160 |
| (8) Baffin_Bay_Gulf_of_St._Lawrence | 23528 | 59670 | -36142 | 86165 | -62637 |
| (9) Canadian_Archipelago | 465880 | 420722 | 45157 | 375241 | 90638 |
| (10) Hudson_Bay | 83051 | 74370 | 8681 | 91653 | -8603 |
| (11) Central_Arctic | 3031058 | 3088557 | -57499 | 3087868 | -56810 |
The overall surplus to average is 177k km2, (3%). Note large surpluses of ice in BCE (Beaufort, Chukchi and East Siberian seas). Meanwhile Laptev on the Russian coast melted out early, as has Greenland Sea. Kara and CAA (Canadian Arctic Archipelago) are holding considerable ice. We are about a month away from the annual minimum mid September, but at this point it does not appear it will be out of the ordinary.


Illustration by Eleanor Lutz shows Earth’s seasonal climate changes. If played in full screen, the four corners present views from top, bottom and sides. It is a visual representation of scientific datasets measuring Arctic ice extents.

Reblogged this on Climate Collections.
LikeLike