There is not much point in announcing new investment when it can’t be connected. Despite the release of the 2nd Integrated System Plan, transmission development is still in a relatively bad place, although it will improve. The RIT-T (regulatory investment test) definition, requirements and process still result in development that is too slow by far.
The evidence is that it has already taken seven months for Project EnergyConnect – the proposed new link from South Australia to NSW – to move from RIT-T approval to getting into the relevant revenue allowances for Transgrid and the main proponent Electranet. That’s seven months and counting. It would be faster in China, or Singapore.
There is not enough revenue on the table to get enough supply built ahead of not only Liddell – due to close in 2023 – but also the other coal generation expected to leave the system by the early 2030s. That is a big problem, but there is time to solve it.
Despite all of those issues, more than 2GW of new utility-scale generation has reached the “Go” button this calendar year already and that’s on top of what may be another 2GW of behind the meter (rooftop solar).
2021 may be more problematic but NSW renewable energy zone efforts may already be bearing fruit as the zone is expected to be up and running by 2022. We focus on new announcements but the 2GW committed this year means that there is still 6GW to come properly on line. That’s broadly equivalent to 2GW of coal, quite a lot really. It’s actually more than required to meet the ISP Central Scenario.
The following figure is constructed from the ISP central scenario. As a reminder that scenario doesn’t assume any Federal policy, but only takes the various state policies as gospel and that coal stations close after 50 years or earlier.
Effectively there is a 25% decline in coal generation energy sent out over the next 13 years to 2033 and a more than 80% increase expected from utility wind and solar and also from distributed solar. You can argue that the coal stations won’t close if they don’t have to or if there is enough profit to justify ongoing capex.
Equally, though, if you are focussed on reliability you would like a policy that ensures the new supply is built before the coal stations exit. For instance, as modelled, there is obviously no way all the new wind and solar in 2033 over 2032 is going to be built in a year.
Despite all its sophistication, the ISP is just a scenario model, albeit one used to legally require transmission to be built (sort of).

Looked at over the entire 12 years, only 1.1GW per year of new wind and solar combined is required. And, in fact, AEMO’s modelled output only has very modest increases over the next five years and then a big rush at the end. But that’s not the way it will or should be done.

Bottom line. In the Central Scenario, and despite the pain, system development is on track. In the bigger picture, the Central Scenario has thermal generation still holding a 43% share of NEM output in 2033. That’s obviously not enough to stay at a 2°C scenario, assuming every other country and every other sector is also doing its bit.
But it is a relatively fast rate of change for the electricity system, taking into account all the issues besides just building wind and solar. Fast but more than doable.
There is investment mainly from the Queensland government
There are plenty of hurdles to new VRE investment. Despite that, and thanks to Queensland, 2.3GW has been committed this year. Not that I am cynical, but if I was, I might wish for a state election in every state every year.
Only committed stages of various projects are included in Figure 3. Ultimately some will be bigger. In ITK’s most basic modelling, which worked to an assumption of 50% VRE across the NEM by 2030, only about 1.1GW of new utility-scale investment is required on average every single year to 2030. So at the moment, despite all the issues and thanks to the Queensland government, things are on track. 2021 is looking more problematic just at the moment.
However, the NSW government has given a commitment to have the REZ 1 in NSW up and running in 2022 and Transgrid has also received strong expressions of interest for capacity around its proposed transmission upgrade between Gunnedah and Tamworth. So, there remains some reason to think new projects in NSW might become committed next year even if the NSW election is not until 2023.

Let’s now get on with doom and gloom and look at some of the very real problems.
Not enough revenue
Electricity prices and green certificate prices are much lower in the spot market than a couple of years ago. Remember when LGCs were $80 and spot prices were also $100/MWh? No, neither can I. But apparently it was as recent as 2016.
Back in those days the theory was you could be the first to build your plant and remove the post PPA equity risk by making your money in the first couple of years. PPA buyers, although they needed convincing were keen because they were seeing a huge amount of electricity bill shock.
Now consumers are actually seeing annual price falls; not much but for conservative management, it takes the pressure off.
The following chart is for Queensland because it’s the most advanced state for utility-scale solar. Pool prices for solar are already at a 20% discount to time-weighted pool prices, a result which will surprise no-one. But $38.5/MWh isn’t a great price for merchant energy.
The rooftop price is notional, of course, but does show how utility-scale farms have been able to use tracking and output management to do
much better than the average household notionally did.

Figure 4 is spot prices, but only very large gen-tailers can really afford exposure to spot prices – the vast majority of other buyers and sellers need contract protection. No bank will finance any project based on pool revenue expectations. Equity may develop without contract cover, but only because they expect to get their contracts post-construction.
So new wind and solar projects have to beat baseload prices and either the buyer or seller has to manage the dispatchability cost on top of that.
Unfortunately, traded futures are a poor guide to medium-term prices because liquidity more than a year or so out is minimal. But both buyers and sellers really need at least 10 years of forecast prices and often 20-30 years.
Of course, you could always buy ITK forecasts, but you might not like the answers. Still using futures as a guide, at least until the closure of Liddell there doesn’t seem to be any rush.

As everyone knows the drivers of lower prices are: (1) flat demand, (2) more supply, which adds to over supply. Oversupply means price competition to discover which generator is the biggest loser, (3) lower gas and coal costs.
Most forecasts have gas and coal prices going back up because they are below the cost of production. Unlike many other products, gas wells show annual production declines each year and so it is virtually certain that if demand is constant or growing that prices will, on average, be at least the cost of producing the next well.
Buyer preference is a positive driver
Various large businesses have commitments to reduce their carbon consumption and or increase renewable energy share of consumption. These goals can be expressed via membership of organisations such as RE100 which in 2019 saw total membership up by one-third, with 40% of the growth coming from Asia Pacific companies.
Of Australian headquartered companies I note ANZ, Macquarie, CBA, NAB, QBE, WBC are all members. Many other renewable energy commitments exist, and employees in most organisations, if asked, would express a preference for renewable energy.
Using data prepared for the BRC, by Energetics, and what a clear chart it is, as much as 5TWh, 2.5% of NEM wide consumption is now tied up in corporate PPAs. Those are volumes that aren’t coming back to big retailers and neither are they available to new developers. These volumes are cumulative as the PPAs will typically extend for a bare minimum of five years and mostly double that or more.

Non performing loans in the sector will make banks more cautious
Today your friendly bank values RECs at essentially zero and forward baseload prices of around $50/MWh barely cover costs, even if there was a whole-of-life PPA, which there isn’t.
Rooftop solar is a bigger and more competitive threat than previously allowed for
Utility solar faces far more competition from rooftop than was ever previously contemplated and this means that solar weighted prices have decoupled from time-weighted prices.
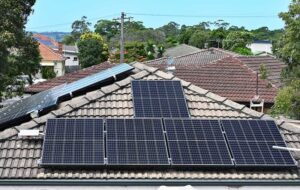
Although the rooftop market is twice as strong as I anticipated a few years ago, all that has done is to bring the lunchtime solar price problem into focus a few years earlier than it otherwise would have done. This is a policy problem, of sorts, because solar has low cost but even lower value. Obviously one answer is to shift it into storage, but in my opinion there are issues with that.
Capital costs falls are slowing
EPC contracts seem to be relatively flat. For solar we do see technology improvements in panels, with 600 watt panels now on the market, up from the 250 watt panels on my roof, and also scale impacts provide benefit, but other factors have offset this in Australia.
Leaving currency to one side, there are at least three factors driving costs in Australia. (i) The cost of capital. This is an either-or situation. If you have a great project in terms of revenue outlook, ie. quality PPA, good MLF, assured connection, you can gear up and get the WACC way down. Everyone else will struggle to get any capital. (ii) Industry learning rate, which predicts the unit cost fall, for a constant cost of capital, that occurs for a doubling in the global installed capacity base.
Using forecasts provided by the European solar association, which in turn takes numbers from solar associations in the main countries, and is therefore always going to be a best-case, and from the Wind Energy Association, you would forecast annual falls in solar of 5% and wind maybe 2%.

In Australia there may be a third driver, assuming away transmission and MLF issues and that is scale. Projects are getting bigger and while around 1GW seems to be a reasonable limit for wind (one turbine takes another’s wind) and we are at that scale, in solar we are not there, and it’s not clear the same limit applies.
The transmission debacle
Even today the RIT-T test, which prevented any new transmission from being built for many years, other than the South Australia/Vic upgrade, remains as a major obstacle.
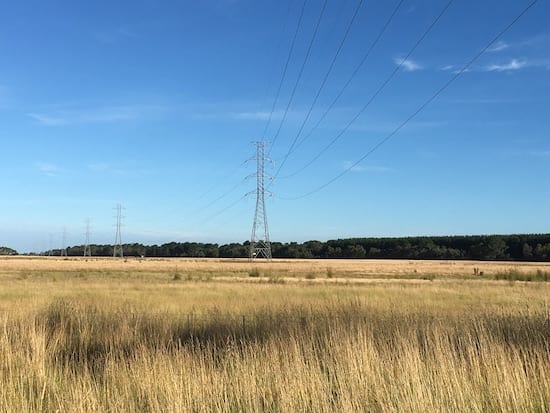
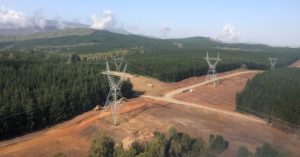
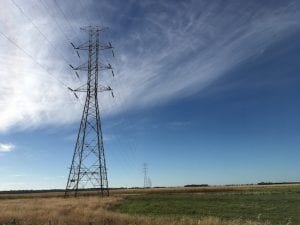
Instead of taking a centrally driven, pre-planned approach as was adopted in Texas, what we have here is a system where transmission investment remains difficult to justify and takes, if not seven years, at least five years to get built.
Transmission will get back, but so slowly it will slow down new generation investment. Project Energyconnect passed the RIT-T test in January 2020. Job done? Not on your Nelly. Now seven, going on eight months later, it still not a confirmed project.
Not only that, but the AER is still turning itself inside out trying to write rules that minimise costs to consumers and still get transmission built. Arguably it’s doing a bad job of it.
As of this minute, very little transmission construction is happening. The new innovative ways of funding transmission lift up-front capital costs to developers.
For instance, in Transgrid’s proposed new Northwest Slopes REZ (between Gunnedah and Tamworth) the idea is that transmission rights for the life of the renewable project will be acquired when the project is financed. I guess this could be financed as an annual payment like a lease but it’s still an on-balance-sheet financial liability that will be accounted for in any debt sizing package.
Effectively it raises the costs of new generation relative to the costs of existing thermal generation. That doesn’t seem to have stopped investor interest but perhaps it will slow things.
The federal government could be more proactive in speeding up transmission development, if it so desired. In the alternative, the temptation is to build wind and solar farms where there is transmission access – for instance, in the Latrobe Valley, Victoria.
In my view, though, you end up with a lesser long-term outcome than will be achieved by reconfiguring transmission properly.
Signalling matters, but so does the cost of capital
The response by the private sector to NSW government policy has made it clear that clear signalling is greatly valued. In NSW it only required the energy minister, Matt Kean, to announce that NSW will proceed with whatever is required to set up two renewable energy zones.
This resulted in $17 bn of investment expressions of interest. No revenue guarantee, or reverse auction was announced. Nor was there really any great announcement about carbon targets other than some words about expectations.
There is no material financial commitment other than in a relatively minor financial cost of pre-funding, to overcome the significant intra- and inter-state transmission challenges in NSW. But developers love the message and the body language and likely the implicit support of the Premier who appointed Matt Kean.
That said, indications of interest don’t always translate into investment dollars and we continue to argue that NSW consumers would benefit from the NSW low cost of capital being implicitly priced into NSW renewable projects via a NSW reverse auction for some variable renewable energy.
Equally, a properly run tender for a modest amount of dispatchable energy, given the long lead times, etc, may also be useful. NSW could show the federal government how to do it properly, in a fair, transparent manner with clear success criteria. As opposed to the UNGI scheme.
Negative signalling at federal government level a necessity for the PM
Federally, there is no policy, no plan for a policy, and no decent process for policy development. Neither is there that much support for all the work everyone else does.
Here’s a couple of extracts from Angus Taylor’s press release when the ISP was released, a couple of weeks back:
“The Morrison Government is supporting a number of projects identified in the ISP including HumeLink and MarinusLink…. The Government is also continuing positive discussions with the Victorian and South Australian governments on their actionable ISP projects.
“Any transmission project that is developed must provide value to consumers. It is critical to avoid over-investment and ‘gold plating’ of the network
“The government also strongly believes gas will play an important role in balancing the NEM. The government is committed to keeping the lights on.”
Gas may play an important role in balancing the NEM, or not. But in the AEMO model it doesn’t provide much energy and therefore doesn’t require much gas. Gas provides power but not much energy in most models.

