Reposted from Dr. Roy Spencer’s Blog
May 2nd, 2021 by Roy W. Spencer, Ph. D.
The Version 6.0 global average lower tropospheric temperature (LT) anomaly for April, 2021 was -0.05 deg. C, down from the March, 2021 value of -0.01 deg. C.

REMINDER: We have changed the 30-year averaging period from which we compute anomalies to 1991-2020, from the old period 1981-2010. This change does not affect the temperature trends.
The global cooling impact of the current La Nina is being fully realized now in global tropospheric temperatures.
The linear warming trend since January, 1979 remains at +0.14 C/decade (+0.12 C/decade over the global-averaged oceans, and +0.18 C/decade over global-averaged land).
Various regional LT departures from the 30-year (1991-2020) average for the last 16 months are:
YEAR MO GLOBE NHEM. SHEM. TROPIC USA48 ARCTIC AUST
2020 01  0.42  0.44  0.41  0.52  0.57 -0.22  0.41
2020 02  0.59  0.74  0.45  0.63  0.17 -0.27  0.20
2020 03  0.35  0.42  0.28  0.53  0.81 -0.96 -0.04
2020 04  0.26  0.26  0.25  0.35 -0.70  0.63  0.78
2020 05  0.42  0.43  0.41  0.53  0.07  0.83 -0.20
2020 06  0.30  0.29  0.30  0.31  0.26  0.54  0.97
2020 07  0.31  0.31  0.31  0.28  0.44  0.26  0.26
2020 08  0.30  0.34  0.26  0.45  0.35  0.30  0.25
2020 09  0.40  0.41  0.39  0.29  0.69  0.24  0.64
2020 10  0.38  0.53  0.22  0.24  0.86  0.95 -0.01
2020 11  0.40  0.52  0.27  0.17  1.45  1.09  1.28
2020 12  0.15  0.08  0.22 -0.07  0.29  0.43  0.13
2021 01  0.12  0.34 -0.09 -0.08  0.36  0.49 -0.52
2021 02  0.20  0.31  0.08 -0.14 -0.66  0.07 -0.27
2021 03 -0.01  0.12 -0.14 -0.29  0.59 -0.78 -0.79
2021 04 -0.05  0.05 -0.15 -0.28 -0.02  0.02  0.29
The full UAH Global Temperature Report, along with the LT global gridpoint anomaly image for April, 2021 should be available within the next few days here.
The global and regional monthly anomalies for the various atmospheric layers we monitor should be available in the next few days at the following locations:
Lower Troposphere: http://vortex.nsstc.uah.edu/data/msu/v6.0/tlt/uahncdc_lt_6.0.txt
Mid-Troposphere: http://vortex.nsstc.uah.edu/data/msu/v6.0/tmt/uahncdc_mt_6.0.txt
Tropopause: http://vortex.nsstc.uah.edu/data/msu/v6.0/ttp/uahncdc_tp_6.0.txt
Lower Stratosphere: http://vortex.nsstc.uah.edu/data/msu/v6.0/tls/uahncdc_ls_6.0.txt
I just knew it was colder.
LOL! The problem with the UAH data is that it mirrors my everyday experience. It is really hard to get used to. 🙂
you would not have said that living in Wisconsin on March 1, 2019
Just run the latest GFS for UK snow forcast till the middle of the month in northern and western area’s.its going to snow! Its increasingly clear there is no global warming emergency, its also increasingly clear the last year has seen a significant drop in human imissions yet the c02 in the atmosphere has increased, with a decrease in earths temps since 2016 we see that human co2 imissions and natural co2 imissions are playing no part in effecting the weather patterns la nina is a natural event and has not been effected by so called dangerous levels of co2 ,co2 is playing no part in warming or offsetting natural events which if we believe what the climate experts are telling us should be happening. The linear warming we are lead to believe is not happening, except in the climate models ,we are not seeing catastrophic global warming in any shape or form.
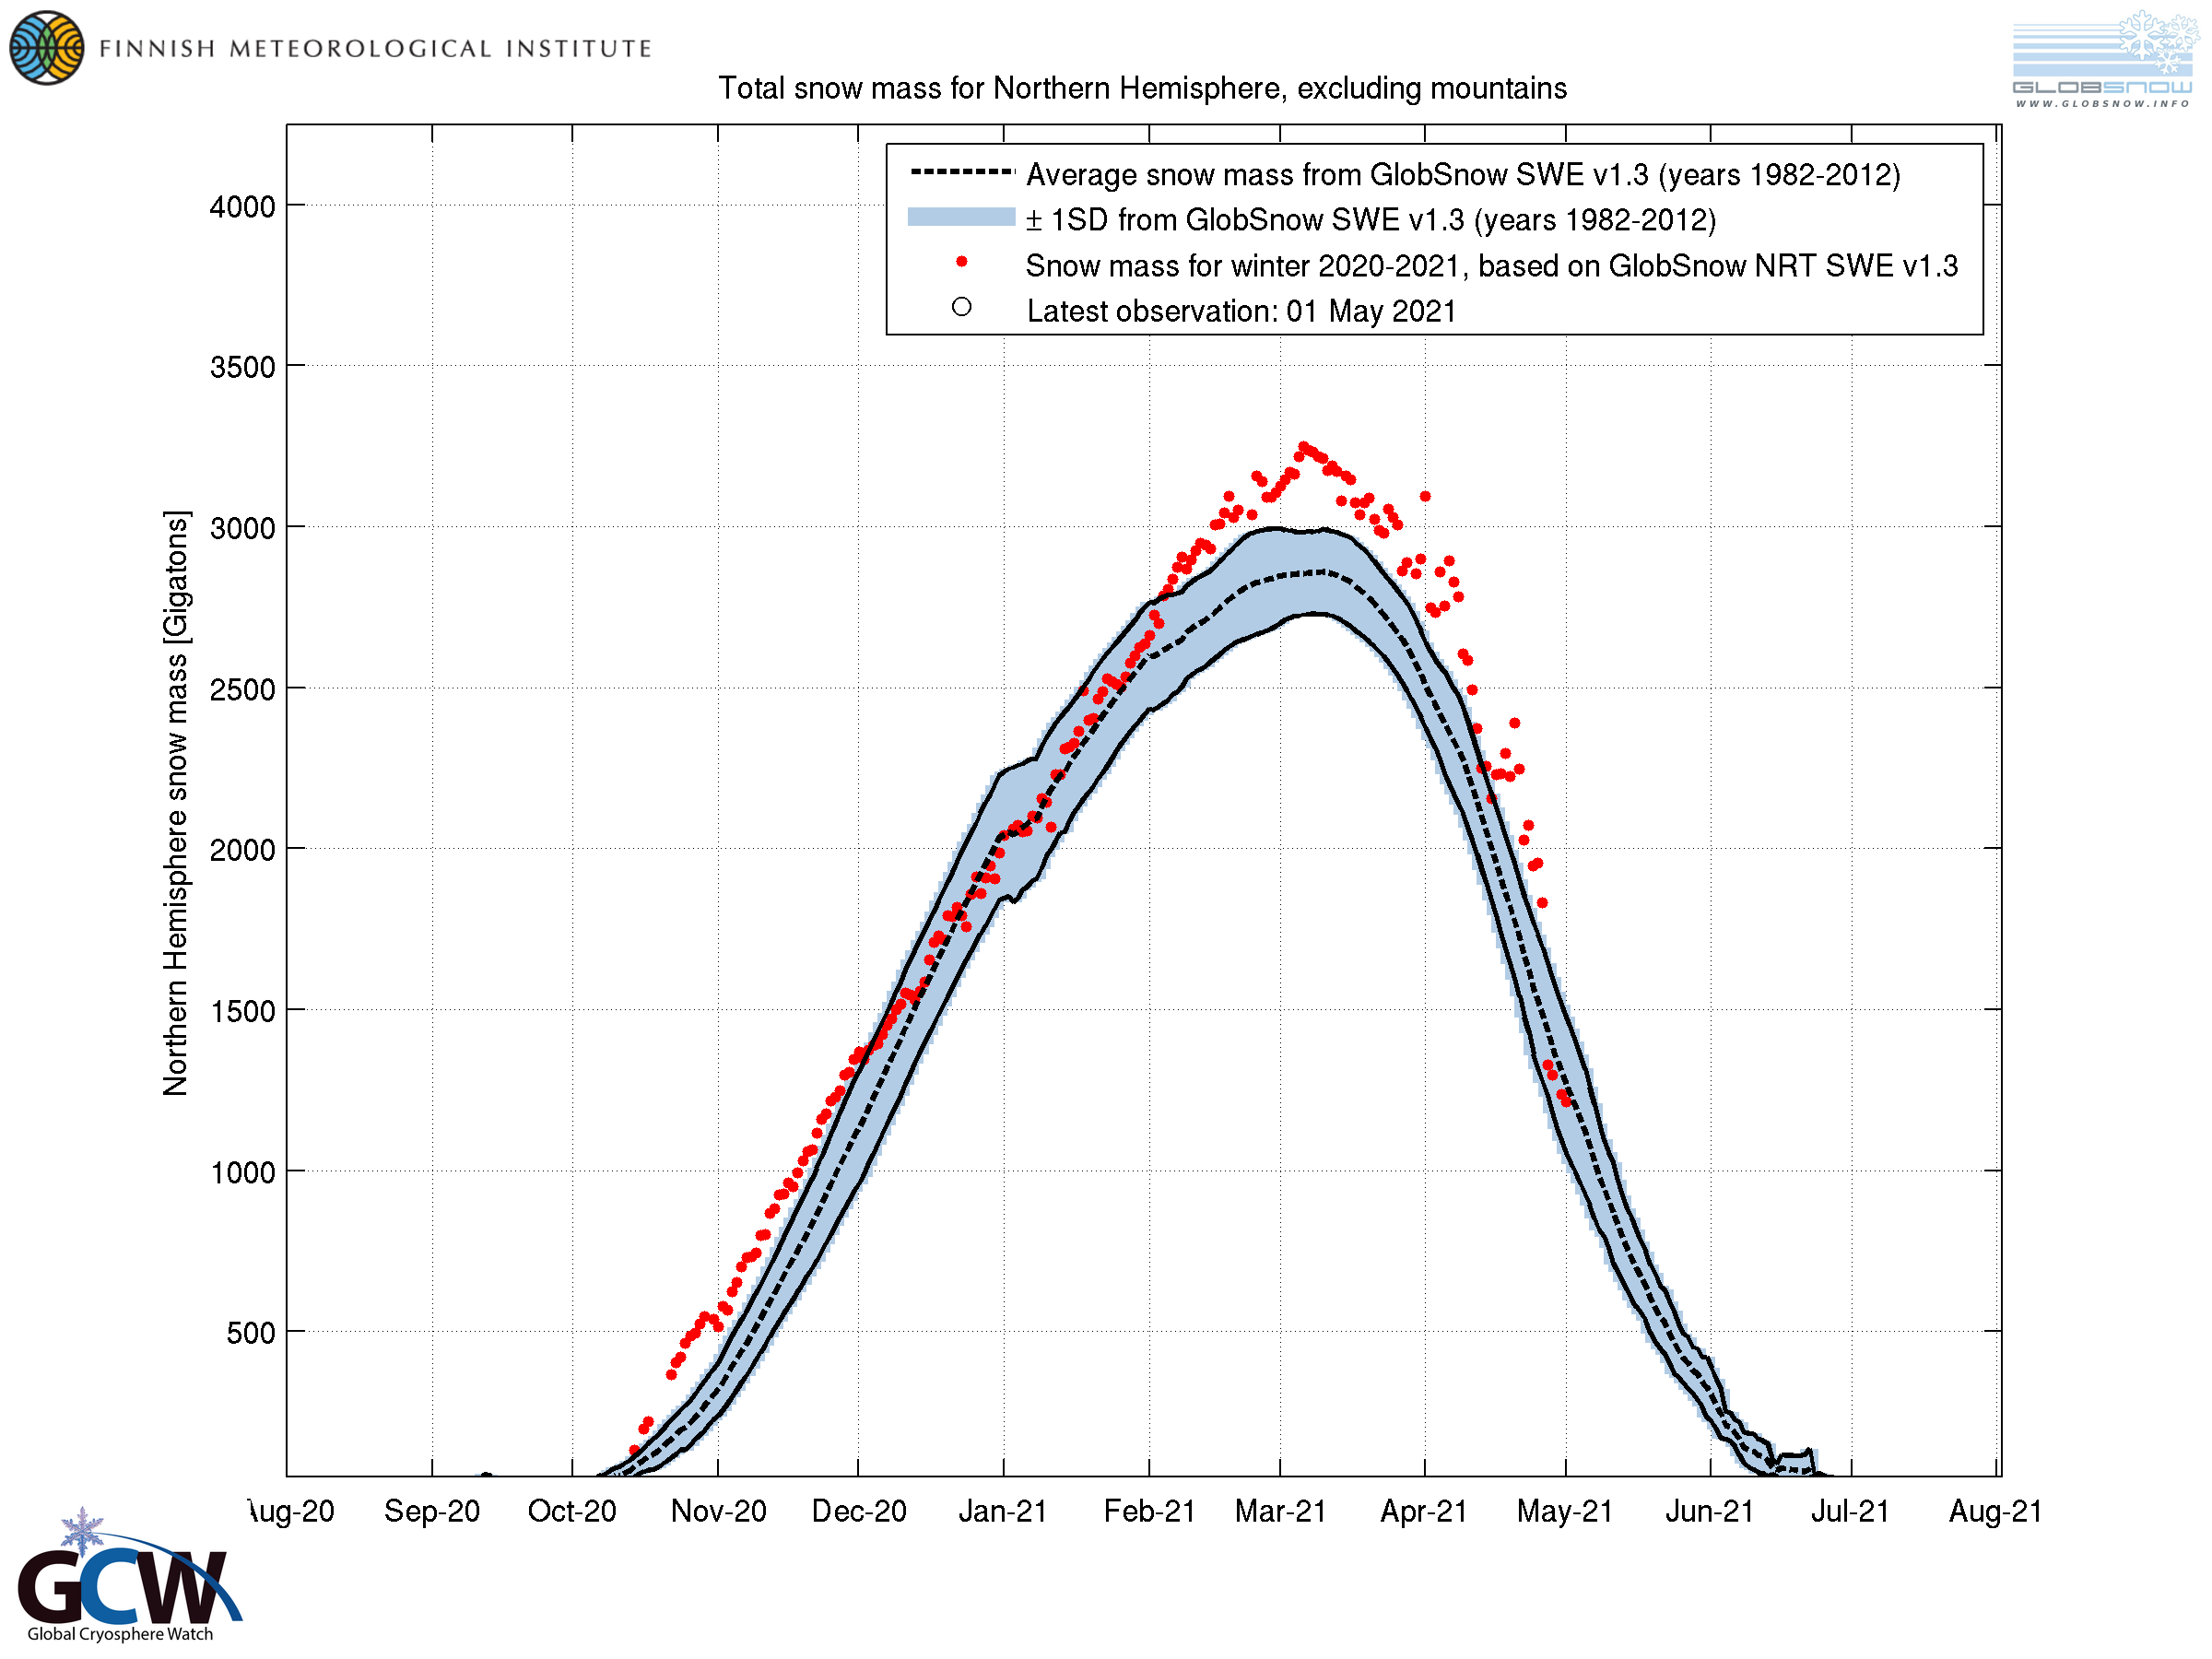
Snow cover in the Northern Hemisphere in Winter 2020-2021 is ~2 or more standard
deviations above the mean of 1998-2011.
Even the warmists at Environment Canada are reporting the reality of a cooling world.
Can I complement your graph with this 9ne
Waking up Environment Canada is more shocking than the snow.
Read the science, Allan…more snow is caused by global warming evaporating more water over the oceans, and causing extreme weather events over land.
Ok, I better put a /sarc tag on this….
Oh, there were lots and lots of colder April anomalies in the UAH data since 1979, here is the top 10 of an ascending sort:
1993 4 -0.46
1982 4 -0.44
1985 4 -0.43
1992 4 -0.39
1997 4 -0.39
1984 4 -0.37
1989 4 -0.32
1986 4 -0.28
1994 4 -0.28
1981 4 -0.25
2021 is at position 22 of 44.
And if Japan’s Met agency has it right with its ENSO prediction, the little La Nina we are currently in won’t live for long anymore:
In comparison with 2012, that is nothing to talk about.
J.-P. D.
What we aren’t seeing is a forecasted El Niño, which is the driver of higher temperatures. It is quite possible for the La Nada to exist through the summer followed by another La Niña which would be something to talk about. Additionally with a La Nada temperatures will not rise overall but trend flat and with the current colder regime we are seeing in both hemispheres certainly isn’t the hotter than Heck, we are all going to die tripe spit out by all the pop climate scientists.
rbabcock
It seems that you have difficulties to interpret even simplest graphs.
Maybe it would have been better for you to go into the deeper material? Here it is:
http://ds.data.jma.go.jp/tcc/tcc/products/elnino/elmonout.html
And concerning the interpretation of ENSO precursor signals, I trust much more these Japanese TCC people than any American institution.
J.-P. D.
Seems your the one who has problems interpreting,your first graph is titled el nino observations ,predictions , the observations are the same track as the current la nina, observed, the predictions only at one point cross into el nino conditions and can not be classed as el nino because they haven’t crossed the 3 month observed or predicted threshold, your clutching at straws , making a appearance when the global warming lie is being exposed.😆
What? 20% El Niño 70% La Nada 10% La Niña going into the fall spells a good chance we stay neutral but from there it is hard to call. The Japanese have their forecast and I actually think they are pretty spot on most of the time, but there is no warm water in the equatorial Pacific depths and even the warm pool typically to the west of the ENSO region is fading.
Looking at that you can see why the forecast is 70% La Nada, but there is a likely chance the Antarctic current that runs north along the South American west coast can strengthen and the upwelling cold water off Peru kicks in the cooling again. You yourself might look a little deeper at how this all fits together.
http://www.bom.gov.au/climate/enso/#tabs=Pacific-Ocean&pacific=Sea-sub%E2%80%93surface
rbabcock
Now I understand you better.
I agree: BoM has a graph fitting a bit better to NOAA’s forecast:
http://www.bom.gov.au/climate/ocean/outlooks/#tabs=Graphs®ion=NINO34
We will see how NINO1+2 develops.
J.-P. D.
The faithful will be eternally waiting for El Ninot, none the less.
http://www.samuel-beckett.net/Waiting_for_Godot_Part1.html
“Nothing to be done”
.
So right on the median of the last 44 years
WHERE IS THE WARMING !!!
Where is the “climate emergency” your fellow leftist scummers keep bleating on about, Bin-Liner ?
Your utter DESPERATION is a comic act within a farce. ! 🙂
Good thing there isn’t accurate temperature data from the 1930s and 40s…..
Your cult-infected mind just couldn’t cope. 😉
Here is the warming Fred, 0.6C of it
.
https://woodfortrees.org/plot/uah6/plot/uah6/trend
Warming of 0.6 degree C in over 40 years isn’t scary at all.
Especially since over a century the warming is even less.
roflmao
Another monkey with a straight edge
Sorry muppet,but the only warming has come from NON-HUMAN CAUSED EL NINOS. !
Looks like its staying low.
Wouldn’t that be a pity for the alarmist scummers. 😉
Ooooh, the little aggressive ankle biter is here again, with his usual ridiculous insults…
But before Ignoramusses like fred250 understand that I haven’t anything in common with Warmistas… Cela peut encore durer longtemps!
*
It’s btw incredibly stoopid to link ‘no warming’ to an anomaly located in the middle of all anomalies of the same month.
And what is really amusing is that while the ‘no warming’ cultists rant all the time against NOAA because of their exaggerated temperature time series, they silently accept NOAA… when it shows a powerful La Nina forecast!!!
Oh Noes. Germans like to name such people ‘Erbsenhirne’.
J.-P. D.
And what is really amusing is that while the ‘no warming’ cultists rant all the time against NOAA because of their exaggerated temperature time series, they silently accept NOAA… when it shows a powerful La Nina forecast!!!”
If a organisation falsifies a temperature set ( noaa) it should be rightly pointed out , if that same organisation predicts and turns out to be true eg la nina ,it should rightly be pointed out.
Of course you could of said ” when it shows a powerful la nina observation, “which is now true . Your playing very obvious mind games with people bin liner , all your post here today are a act of desperation on your part.
B Clarke
Noch so’n Erbsenhirn, was?
J.-P. D.
A idiom from a idiot ,figures.
You can spin it anyway you want. There’s no “catastrophic” there.
Laughable bin-liner gets thrown in the rubbish bin because he is full of GARBAGE.
You ARE a leftist AGW apostle, ..
…obviously living in SELF-DENIAL as well as science-denial.
WHERE IS THE WARMING, bin-liner !!
You make a mockery of yourself with your petty DESPERATION.
You can spin it anyway you want it, but “catastrophic” is off the table.
Bindidon..
Yup I noticed the same pattern. The UAB record shows an extended warming since 1979 of .14 C per decade. When there are sustained anomalies -.2 to -.4 C, below the mid-term average global temperature, then we can talk about a “cooling period”.
posa
Yeah.
That’s of course a good reason for some people to downvote your comment, he he.
J.-P. D.
Assuming the now over 42-year warming trend of 0.14 degrees C per decade continues, in 2101, Earth will be 1.12 C balmier than now. No worries.
For the past five years and two months of cooling, it has been just weather.
Not liking this downward trend
Cold sucks
Miserable here in calgary
Have you thought about moving to Edmonton?
Pardon my Northern Brothers but I could not help but laugh.
Ha ha, me too. Then again maybe he meant Edmonton, London, but I still have a smile on my face, because in the middle of a Post-doc in Edmonton, Alberta, I did fly back into London for Christmas and New Year and felt colder there with the bone-chilling damp.
They are stressed training for the Olympics.
https://m.youtube.com/watch?v=1NhH9B6nVYs
Lived there for a decade
Longest 25 years of my life
God no, never again
Exactly, if your doc gives you six months to live, go live there. You’ll still die in six months, but it will seem longer.
So, colder than in the 1980s and 1990s, but yet we have a global warming “emergency”.
Hmmm. Of what does this alleged “emergency” consist?
Average anomaly during the 1980s and 1990s was -0.21°C, so I’m not sure how -0.05°C is colder.
-0.05C is colder than the prior -0.01C which is colder than the prior +0.20C which was colder than the prior Feb global +0.59C
The Global average temp hasn’t been this cold since the Great Pause
poor bellhop.
COLDER April than 1983 and 1987
Right on the median for Aprils of last 43 years.
Where’s the warming ???
The original comment didn’t mention they were only talking about April anomalies. But you are right, that this was a very middling April, equal 20th.
But that doesn’t make it colder than the 1980s and 1990s. Only 4 out of 20 Aprils during that period where warmer than 2021. Average April temperatures then were -0.19°C. I’d say the fact that an April temperature that would have been one of the warmest during the 80/90s, is now regarded as cold is an indication that warming has ocured.
Gees those El Nino steps stick like a bell on a hotel reception bench, don’t they Bellhop.
Great to see you showing there is NO HUMAN CAUSATION.
You do know the late 1970s was the COLDEST period in 100+ years, don’t you.
Do you LIKE the cold ??
Mr 250, Yes El Niños and La Niñas affect the anomaly for specific years, so why do insist that a single month during a moderate La Niña, being colder than 4 Aprils during the 1980s and 90s, proves there has been no warming?
“Great to see you showing there is NO HUMAN CAUSATION.”
And your evidence that the above graph shows no human causation is?
“You do know the late 1970s was the COLDEST period in 100+ years, don’t you.”
No I don’t know that, mainly because its something you’ve made up.(Now’s your opportunity to provide some genuine evidence to support you claim) But even if it were true, it’s irrelevant to this discussion, which was about comparing 2021 to 1980 – 1999.
So , you continue along the path of ADMITTING there is no evidence of human causation.
You could always try to produce some.. of just keep your mindless yapping.
Also in DENIAL of REAL temperature history.
Are you also in DENIAL of the 1970s Ice Age scare ??
So sad you didn’t know that that the late 1970s was the coldest time in the last 100 years
Seems your IGNORANCE of data matches your ignorance what floor you are on.
No wonder your luggage goes astray all the time.
Your programmers really must try to improve your logic circuits – I hate to think what the previous 249 versions were like.
You claimed there was no human causation, I asked you to provide some evidence of that claim, you say that’s me admitting that there’s no evidence of human causation.
Little mister Belhop is lost for words.
Desperation much.
First the ittle child produces evidence that show conclusively that warming only occurs at El Nino events
Then says I have to produce evidence that there is no human caused warming
….all the while producing. ABSOLUTELY NO EVIDENCE OF HUMAN CAUSATION.. yet again
El Ninos only….
Poor bellhop…..no evidence…an utter and complete FAILURE.
Why should I have to produce evidence to debunk YOUR fairy tale, when you have already done so.
“Why should I have to produce evidence to debunk YOUR fairy tale, when you have already done so.”
Because it’s your claim. You say my graph proves conclusively that all the warming of the last 40 years is caused by El Niño events, but you won’t explain how you come to that conclusion. Then you say none of the warming can be caused by humans, but won’t say how you came to that conclusion.
Meanwhile, the only claim I’ve made in this discussion is that April 2021 was not colder than the 1980s and 1990s. You still won’t say if you think this is true or not.
ROFLMAO
poor bellhop ,
STILL fluffing around avoiding posting his non-existent evidence of human causation in the very slight warming since the COLDEST period in the last 100 years.
Stop digging into your petty little cult-like sewer little child. !
Mean while, back at the ranch. CO2 ppm is still steadily increasing.
Yes, CO2 is Up, and Temperatures are Down.
The Alarmists claim the temperatures should be climbing as CO2 rises. But, it’s not happening in the real world.
The past two months have been colder than many months in the ’80s and ’90s. Under assumed man-made global warming, that shouldn’t happen, given so much more plant food in the air now.
Instead of warming, Earth has been cooling for over five years now. Super El Nino of 2015-16 was only fractionally warmer than that of 1997-98, with flat temperatures in between.
“The past two months have been colder than many months in the ’80s and ’90s.”
Fewer than 20% of the months were warmer than April 2021. It’s a huge stretch to claim that this makes April colder than the 80s and 90s.
“Under assumed man-made global warming, that shouldn’t happen, …”
Why shouldn’t it happen? There’s a lot of variation month to month in UAH, especially during ENSO events. It will have to get a little warmer before we reach the stage when it’s impossible for the coldest present day month to be colder than any month in the last century.
No it shouldn’t happen because the models are linear biased in favour of warming, can you show a climate model that shows this contradiction.
roflmao.
Bellhop can see the planet cooling…..
his petty little AGW cult-religion crashing.
DESPERATE attempts at DENIAL.
So funny to watch such clown like behaviour. 🙂
So do you think April 2021 was colder than the 1980s and 1990s, or not? Or will do you want to go off on another wild goose chase of guessing what I believe.
The “beliefs” of a child-minded low-IQ bellhop who can’t even deliver luggage properly.
….. are totally unimportant and irrelevant to basically everything.
We don’t care what you “believe” idiot !!
Yes, I can really see how little you care. That’s why you respond to every comment so calmly.
And again you fail to answer the simple question – April 2021 colder than the 1980s and 1990s in the UAH data set, yes or no?
April 2021 is cooler than MANY months in that period, Yes. !!
And cooler than the MAJORITY of the months in the period from 2000-2020
Stop digging , you are spraying your BS everywhere, bellhop !!
I think the answer your reaching for is “no”.
April 2021 is not colder than the 1980s and 1990s. I knew we’d get there in the end.
April 2021 is colder than 1983 or 1987 or 1995 or 1998
And colder that 70% of the months this century
WHERE’S THE WARMING, child-mind???
Hidden in one of your lost suitcases ?
It would be a lot easier if you just said “yes” or “no”, but we all know why that would be difficult for you.
So, as we’ve already been over 4 out of 24 Aprils between 1980 and 1999 where warmer than April 2021. Does that mean the 1980s and 1990 were warmer than April 2021?
“WHERE’S THE WARMING, child-mind???”
Three question marks so I suppose you want three answers.
Note, I am not making any claims here about what caused this warming, but suggesting there hasn’t been any warming is absurd.
This alleged emergency consists of anomalies.
“This alleged emergency consists of TINY anomalies.”
Fixed it for you. 🙂
Anomalies that are impossible for humans to physically detect. Especially, on any normal day where normal temperatures fluctuate by at least 15 degrees F.
Before noting that temperature datasets are specifically
cookedadjusted to show higher recent anomalies and colder past anomalies.Before noting that alarmist commenters here are hyper-focused on dismissing recent anomalies as ‘warmer’…
Totally ignoring that CO₂ trends consistently higher yet temperatures are not rising in correlation.
That is, CO₂ temperature causation is totally falsified.
hyper-DESPERATE !!! 😉
No No, we have a climate emergency. Global warming has nothing to do with that.
The climate emergency is bad because CO2 is bad. Anyone can tell that by listening to people who claim its bad. Only trillions of new tax dollars can fix it. There are no other solutions.
“Of what does this alleged [climate] “emergency” consist?”
That’s a good question. It should be asked of everyone who makes the claim that the Earth is experiencing a Climate Emergency.
The alarmists need to get specific and explain themselves when they claim we have a Climate Emergency on our hands. The People should insist the alarmists get specific and explain what they mean by Emergency.
Just trot out Algore and declare a tipping point, again.
God no! Don’t trot out algore. It’s just finally warming up. We don’t need May blizzards from the Gore Effect.
woops, right back to where it was in 1980
And no hockey stick.
One also needs to remember that the satellite record starts at the end of the 1970’s “The next Ice Age is Coming” 1945-1975 cooling. I really doubt if it is really currently warmer than the 1930’s.
Satellite record actually starts in the early seventies. They start the official record in 1979 where the Arctic ice extents are most “convenient”.
The 30s was by far the hottest decade in North America. The highest temperature recorded in Canada remains 114f at Yellowgrass, Saskatchewan in July 1937, my father lived nearby at the time.
It is amazing that NOAA so brazenly doctors the historical record when a simple search of Wikipedia reveals that a plurality of all of the highest temperature recorded in the individual states occurred in the 30s.
The Temperature Data Manipulators haven’t had time to rewrite all the history, like is done in the book titled “1984”, but they are working on it.
As of now though, there are plenty of records to show we are not experiencing unprecedented warming today as the Alarmists claim.
Yes, James Hansen, the guy in charge of NASA’s temperature record at the time, said the year 1934 was the warmest year in the USA and it was 0.5C warmer than 1998.
Somewhere buried in the Climategate emails is a colleague of Hansen’s confirming his claim of 1934 being the hottest year.
Since 1998 and 2016 are statistically tied for the warmest temperatue since 1934, that makes 1934 warmer than 2016 also, and that also means the USA has been in a temperature downtrend since 1934.
Where’s the “hotter and hotter” climate emergency in North America? Answer: It doesn’t exist.
As I predicted last month the “pause” is now 6 years old, now starting in May 2015, 3 months before the end of the last one.
Yes, and I too am looking forward to waking up to Lord Monckton’s post tomorrow morning (or whenever he gets time to do it).
Can someone educate me on this point – it hasn’t exactly been a low temperature La Nina (which I follow in the sidebar on a daily basis). In fact it’s been just outside the actual La Nina definition for a while now. What gives?
Maybe John Kerry, the Climate Czar who makes Albert Gore look like Albert Einstein, can tell us lesser beings that experts say that global warming is well known to cause global cooling.
The ENSO signals take a few months to affect the UAH data. While it’s “lower tropospheric,” It takes a while for La Nina/El Nino to reach the 15,000 foot or so level.
What definition for La Nina are you using? This, from https://www.climate.gov/news-features/blogs/enso/how-will-we-know-when-el-ni%C3%B1o-has-arrived may not be quite right.
My recollection is that El Nino requires three consecutive months of the temperature anomaly of the previous three months being >= 0.5 C° (or <= 0.5 C°) the expected anomaly.
The ENSO meter data comes from http://www.bom.gov.au/climate/enso/nino_3.4.txt , here’s their cold period, lotsa sub -0.5 C° anomalies:
Thanks for the correction Ric. I was just eyeballing the meter in the sidebar here and I guess it isn’t updating daily. Answers my question. Thanks again.
It’s updated weekly, though my script work doesn’t alert me to failures.
Hmm, today’s update suggests the last update was for the week of March 15-21. Interesting, last week’s attempts didn’t let access the page:
–2021-04-26 07:00:01– http://www.bom.gov.au/climate/enso/nino_3.4.txt
Resolving http://www.bom.gov.au (www.bom.gov.au)… 23.52.165.46
Connecting to http://www.bom.gov.au (www.bom.gov.au)|23.52.165.46|:80… connected.
HTTP request sent, awaiting response… 403 Forbidden
2021-04-26 07:00:01 ERROR 403: Forbidden.
Curious, it looks like they changed IP addresses because today’s worked with a new IP address. Sigh, getting failure alerts for this and other pages is pretty high on my queue, but I have a deep queue….
Today’s update:
–2021-05-03 07:00:01– http://www.bom.gov.au/climate/enso/nino_3.4.txt
Resolving http://www.bom.gov.au (www.bom.gov.au)… 96.17.65.143
Connecting to http://www.bom.gov.au (www.bom.gov.au)|96.17.65.143|:80… connected.
HTTP request sent, awaiting response… 200 OK
Length: 5629 (5.5K) [text/plain]
Saving to: ‘nino_3.4.txt’
0K ….. 100% 865M=0s
2021-05-03 07:00:01 (865 MB/s) – ‘nino_3.4.txt’ saved [5629/5629]
Opening nino_3.4.txt
Length of data file 5629, last line:
20210426,20210502,-0.15
file_last 20210315,20210321,-0.38
Last update 20210502
Enso 3.4 -0.15
anomaly -02
BTW, I use https://www.cpc.ncep.noaa.gov/data/indices/wksst8110.for for a while but moved to the AU BOM years ago.
Heh the last update to the NCEP URL was in January of this year. Sigh.
In that case, the two “pauses” are now one long “pause”, ie no warming in this century..
Nope. About 0.25°C difference between the two pauses.
Warming rate this century is currently 0.15 or 0.16°C / decade (depending on when you want the century to start).
Use those El Ninos (NO HUMAN CAUSATION) for all you are worth
(which is basically nothing, btw)
As you have shown above, they are the ONLY cause of any actual warming transients.
No warming without them, not human caused warming.
Great to have you pointing out REALITY., even if by accident.
Thing is , little bellhop.. we are now in La Nina territory.
Will be hilarious to watch your petty antics and desperation. 😉
Do you ever worry that one day you might actually address the point?
You mean the point of ZERO human causation
The FACT that all warming comes from El Ninos.
That point ??
Or the point of your IMAGINARY human causation, of which you have absolutely ZERO evidence.
You are making a laughing stock of yourself, child-mind. !
No, I mean the point that the two so called pauses have not joined up to become one long pause, and there has been warming during the 21st century. That point, the one you’d know if you would just read the comment I’m replying to, instead of reaching for your random insult generator every time I post.
Yep they has been a big EL NINO event
And that is the ONLY WARMING…
As you keep showing everyone.
Absolutely no evidence of human caustaion
You really are getting petty and VERY DESPERATE in your rabid climate denialism, little bellhop.
Can’t even deliver to the right hotel !!
I’m not the one claiming these pauses make any sense. If you start a trend line just before a big EL NINO (sic), you will get a trend line that is a) flat, and b) higher than the preceding trend line. It’s all just a statistical slight of hand. It makes no sense to think the world spontaneously got 0.25°C warmer on May 1st 2015, it’s just the consequence of cherry-picking a start date that will give you the longest flat line you can find.
The temperature is no longer above normal. It’s now below average.
Yes, true.
But… only because UAH switched its baseline from the mean of 1981-2010 up to that of 1991-2020.
Thus each anomaly now is on average 0.14 °C below the old series.
For April, it is 0.12 °C.
J.-P. D.
You do know that the late 1970s was the COLDEST period since the 1940s , don’t you Bin-liner ?
Extreme sea ice extent,
Many alarmists yelping about a coming ice age !!
Bottom of the AMO cycle.
etc etc..
And we are currently a tiny tenth of a degree or so above that coldest of periods in the last 100 years.
Where’s the “climate emergency”, except in the rancid minds of AGW scammers and apostles, like you ???
Fred 250 to me:
“You do know the late 1970s was the COLDEST period in 100+ years, don’t you.”
Fred 250 to Bindidon:
“You do know that the late 1970s was the COLDEST period since the 1940s”
So in Fred’s mind was the 1970s warmer or cooler than the 1940s?
“was the 1970s warmer or cooler than the 1940s?”
Well, in the USA it was about 2.0C cooler in the 1970’s than it was in the 1940’s.
There goes that IGNORANCE of yours again little child.
Desperate DENIAL of actual recorded data only make you look like a arrant, and very desperate CLOWN.
Extreme sea ice extent,
Many alarmists yelping about a coming ice age !!
Bottom of the AMO cycle.
Seem the little Bellhop is a rabid and very desperate CLIMATE CHANGE DENIER>
Thanks for answering my question with your usual level calm and helpful manor.
You still seem to be lacking any evidence that globally the 70s were colder than the 20s.
The first graph seems to be devoted to a few Scandinavian stations, with no attempt to average them. It’s not easy to see in the multicolored spaghetti what the overall temperature was in the 70s.
The second graph specifically says it’s only looking at stations “sheltered and protected against ocean air influences”, and there’s no indication of how these 433 selected stations have been averaged.
Finally you have a newspaper clipping from 1976, which tells us nothing about how the 70s compared with the 20s, and I wouldn’t assume any global temperature reconstruction from the 70s would be as accurate as they are today.
Finally, I’d be careful about using the D word. Personally it doesn’t bother me, but many here claim it’s the most offensive thing you can call someone and anyone who uses it has already lost the argument.
ROFLMAO.. still in deep DENIAL of the 1940-1970 cooling scare
…so funny …. facts are an emema to you aren’t they bellhop.
Next you will be going al manic Mannian and claiming the LIA and MWP didn’t exist.
Climate Change Deniers, like you are child belhop, tend to do that.
https://notrickszone.com/2021/05/03/tree-remains-found-buried-beneath-todays-glaciers-date-to-the-warmer-than-today-medieval-warm-period/
Once again, you seem to think that a crude graph produced in the mid-seventies of Northern Hemisphere temperatures, means the 70s must have been warmer than the 20s. This is tricky given that they don’t know what the temperature will be in the second half of the decade.
Once again, you seem to think that I should care more about temperature reconstructions made 50 years ago, than any subsequent data set.
Once again you PROVE you are a DENIER of CLIMATE HISTORY.
You cannot let yourself know the basic facts, because it would destroy your petty little mind.
I’m not sure what part of climate history you imagine I’m denying. The graph you produced is real and is part of the history, I just tend to reject the accuracy of temperature reconstructions made in the 70s in favor of multiple more advanced reconstructions.
Does that mean I assume the modern data sets are infallible and that we can know for certain that the 1970s were warmer than the 1920s? No, and if better reconstructions come along suggesting the 20s were warmer I’ll happily accept them.
But you’re making a definitive statement that the 70s were absolutely the coldest decade in the last 100 years, which requires you to accept on trust a crude graph cobbled together from two separate sources as if it were infallible. The science was settled at that point and any contrary evidence is blasphemy. That’s not how science works. Science is constantly changing and old data gets rejected when newer and better data comes along. If that makes me a history denier, than so be it.
CLIMATE DENIAL from top to bottom for you , isn’t it little bellhop.
Its your only way of keeping your manic CULT-LIKE anti-science belief going.
You poor pathetic brain-washed twerp.
And yes, we know that in “claimate science” old data keeps getting change.
That is what the “climate” agenda is all about.
That is one of its main memes. DATA ADJUSTMENT to get rid of inconvenient facts.
That is the ONLY WAY they can support their mumbo jumbo.
Not only UAH, it’s the official new baseline.
Only warmistas alalarmists point to the old baselines.
Krishna Goose
” Not only UAH, it’s the official new baseline. ”
Wrong. It will become the official new baseline when WMO says that.
*
” Only warmistas alalarmists point to the old baselines. ”
Was wissen Sie schon über mich, Gänseblümchen!
UAH switched around 2013 to 1981-2010 years before WMO settled it (February 2018, if I do well remember).
And I found that a sound idea, when compared with the previous, deprecated period (1979-1998) which RSS still did not manage to leave.
Try harder, Gänseblümchen, and manage to be less polemic than the ankle biter above.
J.-P. D.
Poor bin-liner..
…still trying desperate to DENY that the late 1970s was the coldest period in 100 years.
.. still trying desperately to back away from the rampant alarmist warmism he has been an apologist for all over the web.
So FUNNY. !!
Next you will be going al manic Mannian and claiming the LIA and MWP didn’t exist.
Climate Change Deniers, like you are Bin-liner, tend to do that.
https://notrickszone.com/2021/05/03/tree-remains-found-buried-beneath-todays-glaciers-date-to-the-warmer-than-today-medieval-warm-period/
I think you missed the joke behind “no longer above normal. It’s now below average.”
It’s a bit forced in this case, it works better for particular temperatures – e.g. a max temperature on some day can be both normal and above average – normal implies a range of temperatures, average specifies a particular number.
It’s very rare to have a day with both low and high temperatures matching the average.
Rick Werme
I would have more appreciated n.n. giving her/himself such a reply: when you reply, we move into guessing about guessing.
J.-P. D.
Run Away! A tenth of a Kelvin, we all gonna die!
Where is the Old-Time Global Warming that we had all come to love?
As I said the other day, Global Warming is what they’ve promised, Global Warming is what they MUST deliver!!! Having said that, I dare say that “they” will claim that the mysterious western economy destroying measures have caused such cooling, utilising a few eyes of Newts, & some hubble bubble toil & trouble spells being cast by the Climate Tsar from the Virginian Colonies 😉 As said above, clearly warming causes cooling & vice-versa. PS, has all the summer Arctic sea-ice gone yet, still waiting?
nicholas tesdorf
I dare to propose that you wake us all up when you see on the right end of the picture
exactly the same as what we see on the left of it…
J.-P. D.
I dare you to explain how an average change of a few tenths of a degree over the course of decades is a threat to anyone, anything, anytime???
It is undetectable by living organisms, well within the bounds of normal climate fluctuations, and most likely within the margin of error.
We have no clear evidence whether it is mostly natural, mostly man-made, or evenly divided. Or even just noise in the systems we are using to try to tease out a signal.
Why does that require us to do anything to prevent more of the same in the future?
Our output of CO2 increased dramatically after the 50’s. If this conjecture held water we would see much less warming before that, and much more warming after that. But all we have seen is a more or less consistant warming since the early 1800’s.
That is the problem. There is no problem, and many people are making their living on a non-problem. And a lot of money and resources have gone into propping up an agenda that is interesting, but not threatening.
Russ R.
” I dare you to explain how an average change of a few tenths of a degree over the course of decades is a threat to anyone, anything, anytime??? ”
Typical Pavlovian reflex.
If you think I’m a Warmista always telling about warming, then you didn’t understand even a bit of what you replied to.
You seem to lack any humor.
J.-P. D.
I think you are a Warmista that wants to walk back all the posts he has made, because he sees no signs of the prophesy coming true, that will smite the deniers of the Holy Climate Models.
I find plenty of humor, in your predict-ament. In fact I am laughing at you right now.
.
Yep, its quite HILARIOUS watching his petty antics, isn’t it.
Yet again you don’t answer the question posed to you, you even quote it.
Are you having a nice day trolling this forum with your nonsensical rubbish.
“with your nonsensical rubbish.”
.
Just a continuation of the Bin-Liner meme
Nothing has changed except his level of desperate self-mockery.
Poor Bin-liner.
KNOWS there is cooling coming..
…. so tries to DENY his constant pushing of the AGW fraud cult religion.
Hilarious.
You’re funny! You seem to be implying that temperatures on the left sink lower and lower forever, as manmade CO2 goes lower and lower.
Lrp
” You seem to be implying… ”
Aha. Thanks for the valuable hint, because I nearly never think about CO2’s influence.
I just wanted to answer to nicholas tesdorf’s question with a nice UAH graph, that’s all.
You are here all quite nervous and aggressive, lack any humor, but that doesn’t disturb me at all.
You can write anything against me, downvote me as often as you want; that doesn’t change my mind concerning a slight warming I don’t know the origin of, let alone would you!
J.-P. D.
“The trend is our friend”—let’s hope.
The trend is our friend until the bend at the end.
If the data; 1981-1990 is legitimate the proper baseline should be to adjust the 30-year averaging period to a 40 year record 1981-2020.
The averaging period can be discussed endlessly. I believe 30 years was chosen because that was the size ledger paper people had on hand.
You don’t want it very long, because then short, cyclic functions get squashed (actually, they should be squashed). You don’t want it short because the signal becomes noisy. The 30 year period is already problematic as it is one half the PDO and AMO periods, and that can lead to selecting periods with positive one or the other and people will get excited about the apparent warming.
I disagree we should start extending the 30 year period unless we adjust all past records too.
It would seem to me that the period should span the average length of every known oscillation. I mean how can we say that there has been a significant change in the climate when the AMO does not have a cycle in the given time span?
And I believe 30 years was picked specifically because at the time it fit right in with the start of the satellite record and conveniently the late 70s were a relatively cold time to start there by serving well as a start point to to show warming.
I could argue for two cycles, and we really should used the least common multiple to get periods that truly repeat. Of course, there are long periods than the apparent 60 year AMO and PDO cycles, with solar cycles of 88, 200, and 2,400 years identified.
Of course, to observe something like anthropogenic warming where population and per capita energy use are not cyclic (yet!?), I argue we need multiple periods of observation.
See https://www.scientificamerican.com/article/the-sunspot-cycle-is-more-intricate-than-previously-thought/ . Google |Wolf Geissberg| for various .pdfs.
Also, I recall seeing 30 year averages back in high school in the 1960s. I stand by my claim, though when I tried to find a reference a few years ago I came up dry.
I know of no data that supports your claim about the 30 year choice.
IPCC Secretly Shifts Goalposts, Redefines ‘Climate’ | Principia Scientific Intl. (principia-scientific.com)
Rob_Dawg
What would you expect from anomalies wrt the monthly means of 1981-2020 to be really so different from anomalies obtained wrt those of 1981-2010 or 1991-2020? The difference hardly could be visible.
Anyway, all this data has ONLY ONE SOURCE: the absolute data out of which any set of anomalies can be constructed (prior to 2013 or so, the baseline was 1979-1998).
Here is that absolute data, reconstructed back out of UAH’s LT anomalies and climatology:
Source
https://www.nsstc.uah.edu/data/msu/v6.0/tlt/
J.-P. D.
And bin-liner DESPERATELY leaves off the cooling at the end a VAIN attempt to DENY the cooling.
STILL hasn’t realised that UAH started at the COLDEST period in the last 100 years.
Extreme sea ice extent,
Many alarmists yelping about a coming ice age !!
Bottom of the AMO cycle.
etc etc..
Again makes a MOCKERY of his own AGW religion.
Yes if he claims this is uah data then the upto data is at the top of the article hes at the very least misrepresenting the current data .
B Clarke
Sorry, but… I didn’t misrepresent anything. What you see is ORIGINAL UAH6.0 LT data.
You are here the problem, because you very probably never had a look at UAH’s absolute data.
No wonder: not only Roy Spencer only shows anomalies. Absolute temperatures are mostly useless.
Please have a look near the left axis of the graph, so you’ll better understand what the plot means; and then click on the directory link.
This is UAH’s 2.5 degree grid data for LT; you find similar files in all atmospheric layers (LT, MT, TP ans LS) they continuously observe.
You see strange files named ‘tltmonamg.1978_6.0’ till ‘tltmonamg.2021_6.0’ (monthly anomalies), and a file named ‘tltmonacg_6.0’ (the baseline average for each cell in each month).
Out of that data, you can then reconstruct absolute values for each layer.
This has been described (in a much less technical form) by Roy Spencer in a thread:
http://www.drroyspencer.com/2016/03/uah-v6-lt-global-temperatures-with-annual-cycle/
There you see a graph quite similar to the one I posted above.
Unluckily I posted a graph with data going only to Dec 2020, what lets some rather aggressive people think I would intentionally hide the cooling in 2021.
I have NO interest in hiding any cooling or warming wherever.
I’ll post the correction including April when Roy Spencer publishes the grid update.
J.-P. D.
Again the PRETENSE that you aren’t a MANIC AGW cultist. Hilariosu.
Sorry, but you are ONLY FOOLING YOURSELF, bin-liner.
The internet shows you are just as twisted as Mann or other AGW apostles.
And yet another graph showing that there has been NO WARMING EXCEPT AT EL NINO EVENTS
No human causation whatsoever….
Thing is, we are now in La Nina territory….
and the warmista PANIC has begun. ! 🙂
Incidentally, in the CET we’ve just broken the record for coldest April Min temperatures.
Is AlGore visiting?
The CET has been in existence since 1559.
Is this said to be the coldest April minimum temperatures ever?
CET records go back to 1659 (not 1559), but Max and Min temperatures are only listed back to 1878.
I’d be surprised if there weren’t colder minimums earlier, and I wouldn’t put too much faith in the accuracy of any of the older values, but the real interest is how cold this April’s night time temperatures were to recent years.
Slightly disingenuous as the full CET goes back much further and there would have been colder April’s. I’ve certainly never noticed as many ground frosts as I have this April and I live on the East coast od England. More than in any Winter month I can recall for that matter
See reply to Herbert above. Mean temperatures where below average, but not exceptional, it’s the low minimum I found interesting.
You’re right about ground frosts, the most on record for England, though these records only go back about 60 years.
Link to frostiest April in 100 years according to the UKMO.
Bellman,
The CET has been in existence since 1659.
Is it claimed that this has been the coldest April minimum temperatures ever?
Forever is a long time…
According to https://www.centralenglandtemperature.co.uk:
“April 2021 with a mean temperature of 6.42°C was the coldest April since 1941 in Central England, with a mean anomaly of -1.47°C which made it the 24th coldest April since 1772.”
Here in North West France it’s been the same, frosts nearly every day. Coldest average since the mid nineties.
Climate believer,
Thanks.
I’ll settle for coldest April since 1941 in Central England, and 24th coldest April since 1772.
That can’t be correct, the BBC hasn’t splashed it all over the news and the tabloids haven’t told us Bradford is colder than Bronnistsy.
Just wait until April is adjusted properly and it will be the hottest evahhhh!
And Germany has its COLDEST April i 40 years
https://notrickszone.com/2021/05/02/europes-frosty-spring-germany-sees-coldest-april-in-40-years-frost-frequency-of-unusual-dimension/
ps.. I bet those solar panels are working well 😉
Actually Fred solar has been working quite well, as well as solar does anyway.
It’s been a very cool April, but very sunny. The frosts melt very quickly in the sun.
What has suffered are the windmills, with these long periods of high pressure the wind has been very weak or non existant.
Wind..
Solar and wind are stupid.
Lol…
What percentage of installed capacity is that ?
Total installed is around 56-60 GW isn’t it, so for a LARGE percentage of the time, its far less than 50% of capacity, and at least HALF the time it is ZERO.
Some people might say that is functional…….
….. but not when you actually NEED electricity to cook an evening meal, or have a morning shower.
Wind capacity is 62.6GW and solar 54.5GW.
For April the share of electricity production:
wind was 23.30%, and solar was 14.80%
This is what last years unreliable production looked like. (click graph)
In Germany it’s old solar with early adopter costs and declining performance annually.
Given it was the 2nd sunniest April over at least the past 100 years, I imagine solar panels were working quite well.
ZERO for more than 50% of the time.
and well less than 50% of capacity for a very LARGE proportion of the time.
…. perfect fit for a bellhop..
Imagine having 54.5GW of coal power plant capacitY!
.
Yep, that is all a bellhop can do.. imagine what he,she,it could have been.
Certainly the way it approaches science and data..
Thank you Roy Spencer for the monthly update.
Proof that Johnny Swift Boat Kerry is effectively reducing global temperature, despite all of his hot air.
Go Johnny Go!!! Lead us into the next glacial period.
Not sure which is going to overtake Kerry first–declining temps in a stacked cycle climate world or Biden headed rapidly into other spending sprees and causes.
So after 40 years of catastrophic global meltdown warming, it is like I moved 20 miles South. Stayed there a while and then moved another 20 miles South. And I regularly go back and forth between where I was and where I now live.
Kind of anti-climactic. I have done some similar commuting North and South of similar distances. There is no noticeable difference. A smart person would say we should monitor this and not take drastic, EXPENSIVE action. In the modern world it is hard to sell advertising on the word of smart people.
If the truth is boring, it doesn’t push the dancing cats off the front page.
Maybe it is just my eyes but the area between the x-axis and the part of the curve below the x-axis appears to be greater than the area between the x-axis and the part of the curve above the x-axis.
Should these not be roughly equal?
Edit: problem solved because the x-axis runs from 1979 and not 1991.
I’m sure we’ll get media alarmism about having gone through the COLDEST MONTH SINCE 2014! There are 6 year-old children who HAVE NEVER EXPERIENCED such frigid cold on this planet like last month. The horror and shock!
Right?
Commiserations to you Canadians and Americans but here in Australia we are back to a balmy anomaly of +0.29C.
Incidentally we have moved from an anomaly +1.28C in November last to -.79C last month to +0.29C this month.
Seems to move around a lot in the Antipodes.
Can I announce a new theory that there is no world climate but dozens of regional and local climates?
As a corollary, that there is no Australian Climate but many local climates in this country.
Oh,you mean these theories are not original…….
Herbert,
Maybe not original; but, man, are they logical!
The reason for the significant temperature drop is in the shortwave radiation anomaly change. Since October 2010, the temperature has dropped from 0.4 °C in October to 0.15 °C in December, to 0.12 °C in January, to -0.01 °C in March, and to -0.05 °C in April. This is in line with the SW radiation changes. The latest CERES values are from February 2021. The text and figures illustrating these changes can be found in my own blog story: https://www.climatexam.com/single-post/global-temperature-of-april-2021-dropped-below-the-pause-level-of-the-early-2000s.
Skeptical/contrarian scientists have now a very strong argument against human induces climate change. During the period from January 1997 to December 2020, the emissions of carbon dioxide were 205 gigatons carbon (GtC) being 44% of the total emissions of 462 GtC after 1750, but the greenhouse (GH) gases were not able to increase the temperature.
Hi Antero,
please dont shoot a critic..
Where does the data form the 2nd figure 2 (the real figure 2?) come from?
While I understand that these are selected years, it seems that the all end in December at roughly 243 W per m, but start at 246 in January, a very suspicious jump!
But I like the fact that you are trying to answer my question, what is the effect behind these sharp changes of temperature.
Another observation from the first figure 2:
You show temperature and ENSO, but the peaks in the curves show different widths.
I think it is unlikely, that these sharp temperature peaks are caused directly by the braoder ENSO peaks, there is a correlation between them, but the data looks more like there might be a common reason behind both effects.
Cheers,
LoN
I have no doubt that this will still turn out to be the hottest year since records began, even if it means they have to start a new record to prove it..
It’s pleasing to see that our sacrifices during Earth Hour are bearing fruit. Mustn’t overdo it now folks. Maybe we make it Earth Half Hour next year (26 March 2022 at 8.30 pm local time)?
Slid off the plate!
Yep, Australia has had a glorious April Autumn.
….. particularly after the manic rain a month or so ago.
CO2 + water + mild warmth = nice green lush feed for farm animals.
Fred I thought global warming, climate change or climate extinction or climate emergency is causing fires?
I guess we just need to wait for catastrophic fires 😉
Does that imply a return to GBR scare stories, deep ocean warmth, and other misdirection plays?
And May is starting out pretty cool for most of the US. The lore here in central Indiana is don’t plant before Mothers day (May 9th) but we’ll be holding off on our planting longer than that. Forecast for the next 10 days is for it to be colder and wetter than average here, and the same for almost all of the central and eastern US. People in higher elevations in the east even down to WV will have a good chance of seeing some snow!
Friday we had a frost. Low of 33 deg. F. Nipped the tulips and blossoms on the Dogwoods. Apple trees haven’t bloomed yet but I guess we’ll wait and see.
Garden is tilled and ready. Just waiting on Mother Nature to give the go ahead.
On the bright side, the cold has put a damper on the tornado season. Though Mississippi got hit pretty badly last night, over all, April saw historically low tornadic activity and we are running well below average this year so far.
But despite the lack of thunderstorms up here in Indiana it has been the windiest spring I can remember here. So windy that I haven’t been able to burn off the 6 foot high pile of dead fall and trimmings I’ve had in my 8 foot diameter fire ring since cleaning up after that heavy wet snow we had week before last that practically destroyed my largest willow tree and brought down some other pretty good sized branches from a couple other trees on my acre.
I appreciate all the hard work that goes into to creating this data. However, the use of an arbitrary 30 year period to create “anomalies” just makes no sense to me. Why not just de-seasonalize the data by taking appropriate differences (12th difference for monthly, 365th for daily, etc) This is one of the first things you learn in Time Series Analysis. Yes, you lose a year of data on the front end, but you don’t ever have to switch normalizing periods. Stationary is really what people want to know about temperatures. I’m not sure why unit root tests aren’t the right way to go to address this issue. THe ad hoc way data is handled in climate science doesn’t inspire much faith.
Nelson
Every statistician would tell you that building departures from a mean leads to biases when based on first difference techniques. I personally can’t say anything about that.
Moreover, you need common reference periods when comparing different data, beginning with temperatures measured in the lower troposphere to be compared with those at the surface, or with those in the lower stratosphere.
https://drive.google.com/file/d/1ChYZ8-Ffk5t_F9hmMw-rC24RztMcizsp/view
https://drive.google.com/file/d/1_ecu50TZYPYfr57XIWZ_rcu9p2trm2hy/view
J.-P. D.
Choosing a period just after the COLDEST years in 100 years is not a good place to set as a reference.
Wouldn’t you agree, Bin-liner !
And yes we know that UAH matches the ONLY pristine surface data in the world, and that CONUS has been FORCED to stop its manic adjustments and to match REALITY.
How DUMB would the “official” surface data look if it diverged greatly from USCRN. 😉
USCRN and UAH have brought the pre-1979 US temperature FAKERY of USHCN et-al under control.
Makes you wonder why “reference ” networks haven’t been set up around the world..
But that would happen IFF the alarmist scummers actually wanted the truth.
“And yes we know that UAH matches the ONLY pristine surface data in the world”
When you say UAH matches USCRN, so you mean global UAH or just the USA part of UAH?
Looking at the trends from 2005 to March 2021, I get
USCRN = 0.32°C / decade
UAH Globe = 0.24°C / decade
UAH USA48 = 0.28°C / decade
GISTEMP Globe = 0.26°C / decade
ROFLMAO
Please STOP displaying your ignorance, Bellhop.
The ONLY reason USCRN has a slightly different trend is because it responded more during the 2015-2017 El nino big blob
With a few months of cooling coming, that will be back down to a ZERO TREND like they both were before the 2015 event.
Then we can watch your petty desperation with even more hilarity !!
Finally you manage to answer the question, you are comparing USCRN with UAH USA48.
You don’t need to be so defensive about the different trends. They’re not significantly different over such a short period, especially considering they are measuring different things.
Poor bellhop, mathematic understanding is a anathema to you isn’t it.
Wrong floor, yet again.. so sad.
Try to LEARN if you are capable.
Will be hilarious to watch your petty antics as the ZERO trend re-establishes itself 😉
This is hilarious. What exactly do you think was wrong with me pointing out the difference between the two trends not being significant do you think I got wrong? And what does it then say about your claim that the two data sets match?
ZERO TREND coming soon, petal..
NO WARMING… so.
NO HUMAN CAUSED WARMING
get over it.!
Find a new job, you are a failure even as a bellhop.
Lets hope so.
Poor Bellman remains EVIDENCE FREE for human causation.
So sadly pathetic
Just “imagine” little child.. its all you have.
And of course a protracted COOLING spell is the VERY LAST THING the planet needs at the moments
Even the slight dip is causing frosts and crop failures in many areas.
Sigh. You didn’t say cooling, you said zero-trend.
Run and hide little bellhop.. squirm and wriggle
Poor Bellman remains EVIDENCE FREE for human causation.
Essentially ADMITTING that the very slight rise in temperature since the COLDEST period in 10,000 years, is TOTALLY NATURAL
Just the NORMAL ebb and flow of climate.
Ankle biter
If you think you can impress me with your aggressive wording, then you are totally wrong.
Here is a comparison of all CRN stations with all GHCN daily stations and UAH 48:
https://drive.google.com/file/d/1yeAaITxUWgH2LpIwbvMwGWstVLMdzRhA/view
When you will become able to do such things, knock at my door, ankle biter.
Until then, you are nothing more than an incompetent, stubborn ideologue who does exactly what he accuses others of doing here all the time.
I use to say: “Warmistas aren’t good for us, but Coolistas are even worse. ”
J.-P. D.
ROFLMAO you poor petty and desperate warmista…..
Thanks for CONFIRMING that USCRN is now controlling the CORNUS and USHCN “adjustments”
Do you really, even in your most IGNORANT alarmist stance, think this happens just “accidentally.
No, you poor petty alarmist moron.. it is “adjusted to match” !!!
Ankle biter
The more you write, the more aggressive you behave, and the less you convince.
You did NOTHING by your own.
You did no more than comparing CRN with NClimDiv, what is nothing else than the worldwide CLIMAT record.
And you are absolutely unable to give a proof of your ridiculous “adjusted to match” claim.
If you had any real experience, you wouldn’t insult people and bark like a mad mutt.
Instead, you would produce and show what you are experienced in.
You can insult me as long as you want, little ankle biter.
J.-P. D.
You can continue to DENY your rabid pushing of the AGW scam, bib-liner..
But the internet remembers.
You KNOW that UHA and USCRN have brought an end to the manic “adjustments” of present data in the USA.
Unfortuantely, it will continue elsewhere, because the alarmistas DON’T WANT lots of reliable temperature stations other wisethey would exist
You KNOW that a cooling trend is coming
Its hilarious to watch your childish WARMISTA DENIALIST antics.
At least you didn’t DENY your ignorance of mathematics..
…. .. that would be too funny for words.
Erm, I think we would look better to outsiders if we didn’t have these ad hominem attacks. Keep it polite. Oh , and looking at the UAH graph, global temp is as it used to be in 1991
Am I right? .
1987, actually
Thanks CdL, I was grimacing with each post.
As sgt Friday said once, ‘Just the facts ma’am’
Fred, I enjoy your ripostes, but really I think you should tone it down a bit, even if you feel the target doesn’t deserve it. Presenting your data with respect is much easier to read and serves us not going into the ad hominem space. It comes across much better to at least be respectful in your replies. Makes it harder to shoot you down on the data.
I’m not sure I’m following what you are saying. De-seasonalizing isn’t taking first differences. Once you de-seasonalize you can test for a time trend. If there is a time trend, the data is nonstationary and the mean is not defined.
Nelson
Now, conversely, I’m no longer sure to have understood your ‘de-seasonalizing’.
Do you mean by this to compute, e.g. for a monthly time series, separate monthly departures for each month?
But then: with respect to what?
Could you be a bit more clear?
Suppose I would upload for you the UAH6.0 LT time series in absolute form; would you then compute out of it this ‘de-seasonalized’ data you mention, and explain what you really mean?
J.-P. D.
Introducing honest logic into the climate alarmist workings?
Those reference periods, smoothings, proxy data, dropping inconvenient station data, emphasizing hotter urban temperature stations, adjusting past data repeatedly, etc. are all designed to make current temperatures higher than evah!
Before wondering about the oxymoronic idea that a global temperature average makes any sort of sense.
let’s just state that honest logic and alarmism are not compatible.
At last we can clearly see what the climate alarm is all about. The urgency displayed by the AGW advocates over the past two years can now be explained.
The evidence is starting to pile up. We have an emergency on our hands like never before.
The climate warming is refusing to exhibit itself in everyday weather outcomes.
What will Greta and Sir David and the Guardian do, if this ongoing shyness of Global Warming continues?
It’s an emergency I am telling you. We only have ten years left to save the Earth’s global warming movement.
They face an existential threat, something must be done!
Just a few days after trumpeting rising Global temperatures, The Guardian this year was forced to report that France had experienced the coldest Spring in decades, with huge losses to the grape harvest.
So since 1998 what is the temperature anomaly?
…for global temps?
The current calculated global temperature is about 0.1C BELOW the average 21st century anomaly.
The Pause that refreshes continues then. If Warmunists run true to form, they will first deny that it exists, then as it continues, they will dust off the old dog-ate-my- global warming excuses.
La Nina plus solar minimum plus AMO turn equals a wake up call.
Why do we never see the USCRN temperatures?
E. Martin
I had some idle time, and generated anomalies for UAH CONUS and USCRN data (out of GHCN daily) wrt a common period (2005-2019):
April 2021 for CRN isn’t in yet.
J.-P. D.
Thanks again for showing that UAH and USCRN have brought the pre-1979 (coldest year in 100 years, in case you didn’t know) fabrication and adjustment of US data under control.
Desperate time for rabid warmistas like you, hey bin-liner.. 😉
I wonder if the main stream media will report this?!
Crickets . . .
Since the UAH change from month to month often mirrors the HadSST3 change with a 5-6 month lag, we can expect a high likelihood of additional cooling in May and June. After June we should see a moderation until the next ENSO change occurs. As we can see the SSTs have already started to warm a bit.
https://woodfortrees.org/plot/hadsst3gl/from:2014/to/plot/hadsst3gl/from:2014/to/trend
Most ENSO predictions at this time of year have poor track records. We should know more in a month. If we do fall back into La Nina conditions over the last half of the year, then the Lord Monckton pause will start to get very long. A 10 year pause by the summer of 2022 is a possibility.
Keep in mind that we will not see substantial cooling unless the oceans start to cool. I don’t see that happening soon.
CMIP comparison is just brutal

yikes
TallDave
If I were you, I’d quickly go to KNMI, generate the same stuff with RCP4.5 for the Globe as a whole, and compare again.
Because if even a McKittrick manages to have a rather different picture when comparing models with HadCRUT4
https://www.rossmckitrick.com/uploads/4/8/0/8/4808045/model_obs_comp_nov_2019.pdf
then there might well be something slightly wrong in John Christy’s graph.
J.-P. D.
Bindidon
Thanks for the link.
If I were you, I’d quickly go out and notice the difference between Hadcrut4 data (McKittrick’s graphic) and the satellite and balloon data (Christy’s graphic) as a whole, and compare again.
Frank from NoVA
Thanks for the hint, but… the difference between UAH and HadCRUT visible here among other series
can by no means explain the difference between Christy’s and McKittrick’s graphs.
Best regards
J.-P. D.
Funny that GISS on the web shows up the GISS lies.
Shows several years after 1998 El Nino peak as being warmer than 1998, not in UAH.
…..and a 0.4 – 0.5 C increase from the 1998 El Nino peak to the 2015 peak when UAH shows only 0.08C difference.
And of course , there are the MASSIVE CHANGES to GISS, always cooling the past to increase the trend
Your warmista scummer mates in action. !!
Ankle biter aka fred250
Why are you so aggressive all the time?
Why do you show always one side of the medal?
Did you never observe how bigger the changes between UAH5.6 and UAH 6.0 have been in 2015, in comparison with the ‘huuuuge‘ GISS adjustments?
Why can’t you accept the little ‘warming’ changes made to GISS?
I have NO PROBLEM to accept the big ‘cooling’ changes made to UAH!
https://www.woodfortrees.org/graph/uah6/mean:12/plot/uah5/mean:12
J.-P. D.
ROFLAMO
The rabid alarmista want to compare a non-data fabrication (HadCrud) that has been specifically adjusted to show un-real warming to match the farcical climate models.
And is probably so self-unaware, that he doesn’t notice what sort of clown act that is.
you misread the graph, Bindidon, it’s quite definitely not a global temperature
tropical mid-tropo
the temperatures most sensitive to CO2 forcing
culprit could be Willard’s emergent tropical thunderstorms, but at this point who knows really
TallDave
Correct, my bad.
When I have some more idle time, I’ll try to generate CMIP tropics data in KNMI, and compare that with UAH6.0 and the RATPAC-B Tropics subset.
Thanks for the hint on my mistake.
J.-P. D.
What about the effects the effects of the jet stream producing the colder temperatures this year in the northern hemisphere? When I look at a jet stream map today(Monday) of Edmonton, Calgary and points south it shows that the bulk of the jet stream is south of these locations therefore pulling down the colder northern air. Same for the UK.
https://www.netweather.tv/charts-and-data/global-jetstream#2021/05/03/0000Z/jetstream/surface/level/overlay=jetstream/orthographic=-6.72,57.59,712
Watch for de-fund the satellites in the new meanness and dirty tricks zone.
Global warming isn’t the only thing in decline…..
TV And Online News Audiences Declined During Biden’s First 100 Days: Report (yahoo.com)
I guess the daily pounding of the senses with global warming news is having an impact–unplugging!
I am a glad nature is proving the alarmists wrong but the implications of a significant cooling trend are negative for humanity.
No discernible trend would be just fine by me.
No, the cycles have a statement to make here.