Due primarily to land uplift, markings on “seal rocks” show dramatic declines in relative sea level along Sweden’s coasts in the last 290 years.
The explanation for falling sea levels throughout much of Northern Europe is that the land in this region of the world is rising faster than eustatic sea levels are.
Written records of relative sea levels dated to centuries ago are well described in the use of certain “seal rocks” – rocks that were important for seal hunting (Weisse et al., 2021). Notice the “1731” marking in the image below to detail sea levels that were 2 meters higher at that time.
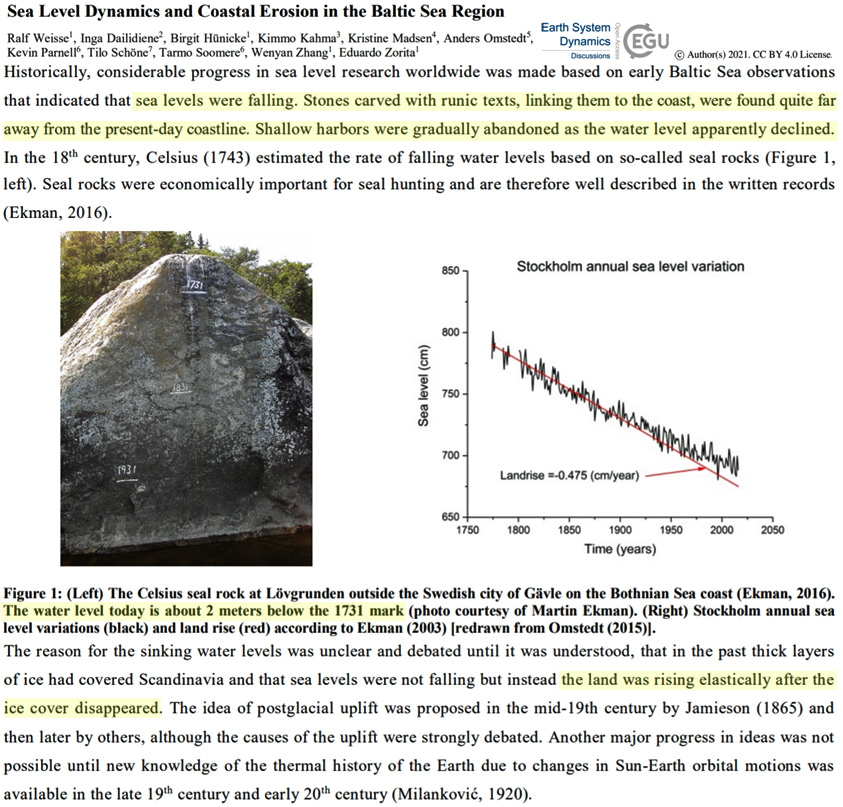
Image Source: Weisse et al., 2021
Tide gauges also show Sweden’s sea levels have consistently been declining – some by nearly -8 mm/yr – along Sweden’s coasts.
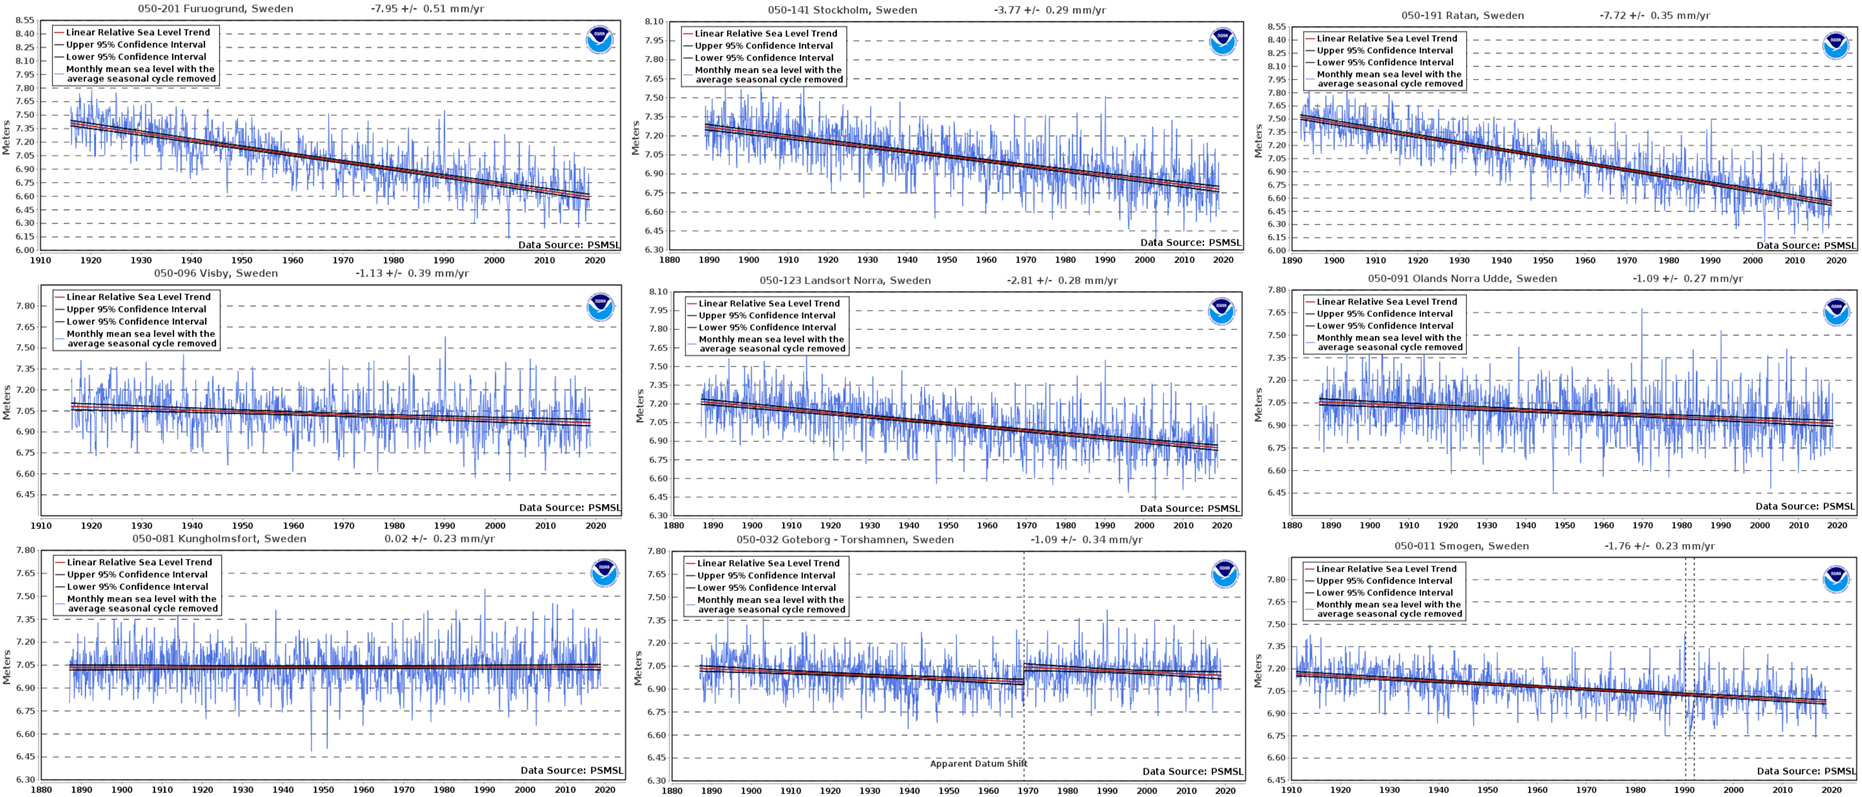
Image Source: NOAA
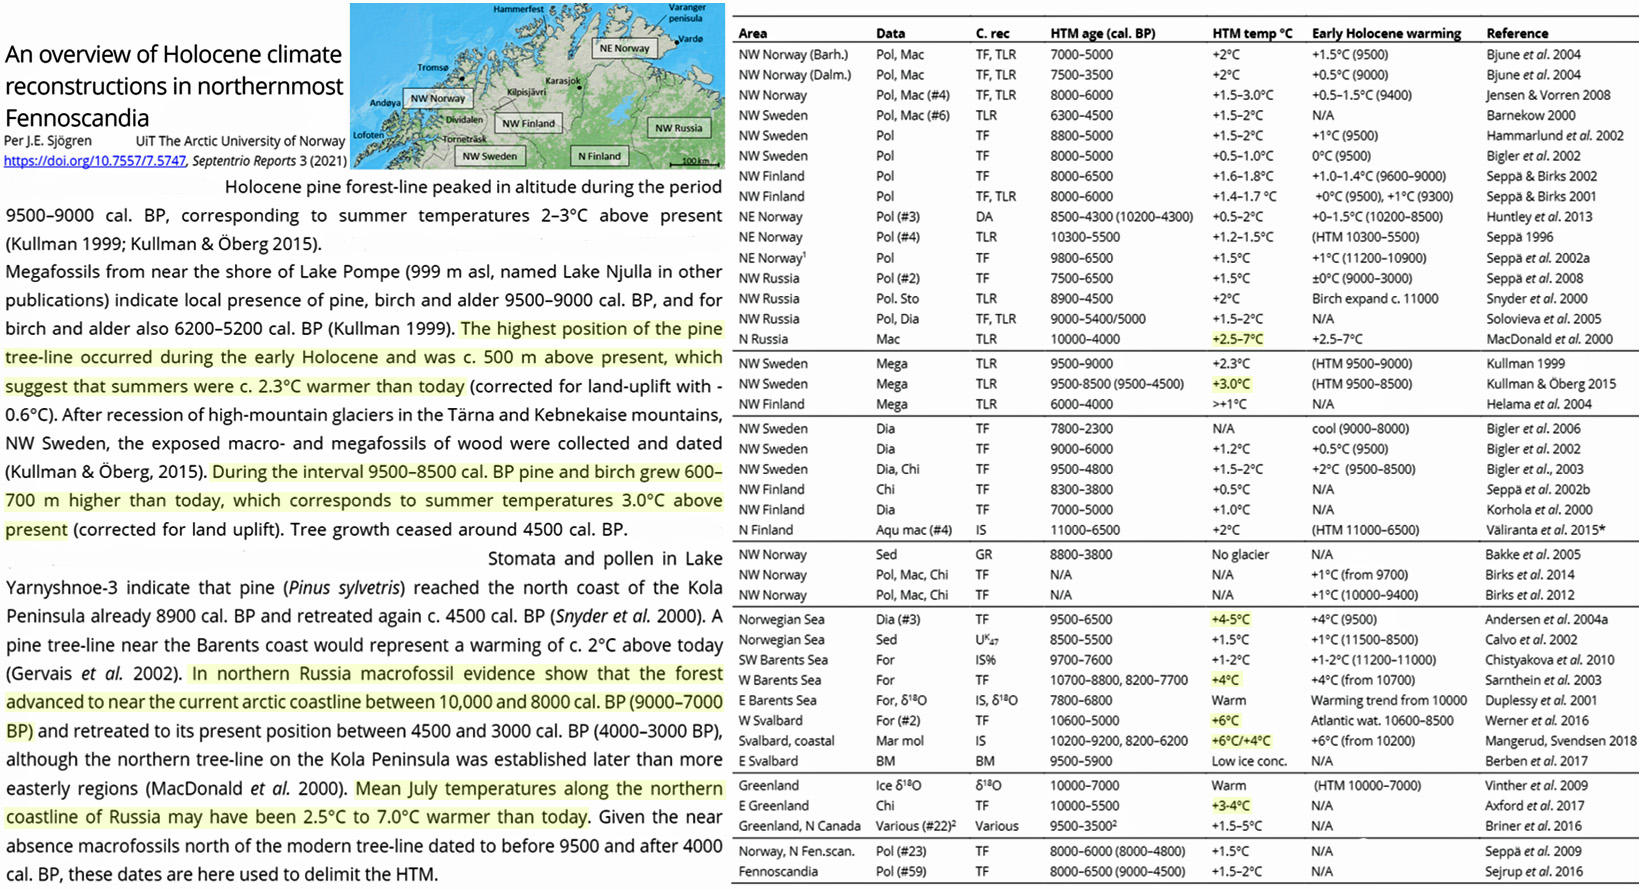
It’s interesting, though, that Sweden not only has experienced falling sea levels in recent centuries, but temperatures there today are about 3°C colder than nearly all of the last 9000 years.
Per another new study (Sjögren, 2021), when CO2 was just 260 ppm (10,000 to 5000 years ago), trees grew at 500-700 m higher altitudes than they do today, forests lined the Arctic Ocean coast, and 40 locations in Norway, Finland, Sweden, Russia, Norwegian/Barents Seas, Svalbard, Greenland…were all 1.5 to 7°C warmer than they are now.


At Stockholm, sea-level has been measured continuously since January, 1889:
https://sealevel.info/MSL_graph.php?id=stockholm
https://sealevel.info/050-141_Stockholm_Sweden_1889-2020_smoothed_vs_CO2_annot1.png
Linear regression yields an average sea-level trend of -3.716 ±0.286 mm/yr.
Quadratic regression yields a tiny & inconsequential (but almost statistically significant) acceleration of 0.01623 ±0.01676 mm/yr².
270 years at -3.716 mm/yr = a decline of 1.003 meters, so if the rate hasn’t changed it is about half the rate at the Celsius seal rock, near Gävle.
Gävle also used to have a tide gauge, but it was apparently decommissioned in 1986. Still, it had 91 years of measurements:
https://sealevel.info/MSL_graph.php?id=gavle
Linear regression of the Gavle measurements yields an average trend of -6.043 ±0.488 mm/year. (Perhaps the ice sheet over Gävle was thicker than the ice sheet over Stockholm, 10K years ago.)
-6.043 mm/yr × 270 years = 1.632 meters, which is slightly slower than the 2 meters from this study, suggesting that either the rate of uplift might have slowed slightly over the last 270 years, or the global sea-level trend might have accelerated slightly over the last 270 years (or both).
Sea Levels are falling all over the world due to the rebounding of the compressed land from the ice age. Here is the evidence.
https://imgur.com/a/siHPINY
As the oceans recede, Swedish beachfront owners complain ”Children won’t know what water is, anymore.”
If the dry land that people walk on has risen due to isostatic rebound then what of the ocean floor that this dry land is connected to? Surely it is rising as well and what happens to the ocean water that is displaced. This could explain the 1mm to 2mm rise in sea level noticed on most tide gauges around the world.
Would not ice-load at place A cause a bulge up at nearby place B where ice is not?
Like pressing on a balloon.
Remove the ice – A rises, B drops.
(discount the land connecting A & B)
It’s a shame we no longer have Nils Acel Mörner to present data in person anymore. Nevertheless, we still have his research, which shows that the claims of catastrophic sea level rise are nonsense.
See figure 4, here, for a graphical tabulation of the spectrum of rates of sea level changes detected by 159 tide gauges.
https://21sci-tech.com/Subscriptions/Winter-2010-ONLINE/Morner.pdf
Rest of that paper is also quite helpful.
Another good reference…
https://www.c3headlines.com/sea-levels.html
Also of note Yonason, is the report at https://www.nature.com/articles/nclimate3111
that says “Earth’s surface gained 115,000 km2 of water and 173,000 km2 of land over the past 30 years, including 20,135 km2 of water and 33,700 km2 of land in coastal areas.
Analyzing Coastal areas, and to the scientists surprise, coastlines had gained more land – 33,700 sq km (13,000 sq miles).
Maybe someone has pulled the plug in the ocean 🙂
Actually, this sea-level fall is clearly and obviously caused by “global warming.”
All you have to do is add something to one of the “models” to account for water contracting when it gets warmer, and there it is.
And that counts as “science,” right?
(Do I really need to do a sarc-off tag here?)
“(Do I really need to do a sarc-off tag here?)” – T.I.S. P.D..
In my experience, it wouldn’t hurt. 🤷♂️
Do not forget that 20000 years ago the scandinavian peninsula was covered with a huge glacier and this ice-cap disappeared until le Holocene warm maximum (6000 years ago). Then the overall weight of this piece of land diminished. By natural hydrostatic phenomenon the whole peninsula is upwelling (if it is appropriate to use this term). I may be wrong because I am not a specialist …
[…] Related: Sea Levels Surrounding Sweden Have Fallen 2 Meters Since 1731 […]
[…] Sea Levels Surrounding Sweden Have Fallen 2 Meters Since 1731 […]
I have just come across this blog post, it’s really awesome just appreciating the time and hours spent writing this post. Thumbs up to the writer