Posted on February 26, 2021 by curryja |
Natural climate variability in the polar regions.
If our planet had been designed with comparative high-latitude studies in mind, it couldn’t have been better arranged than it is.
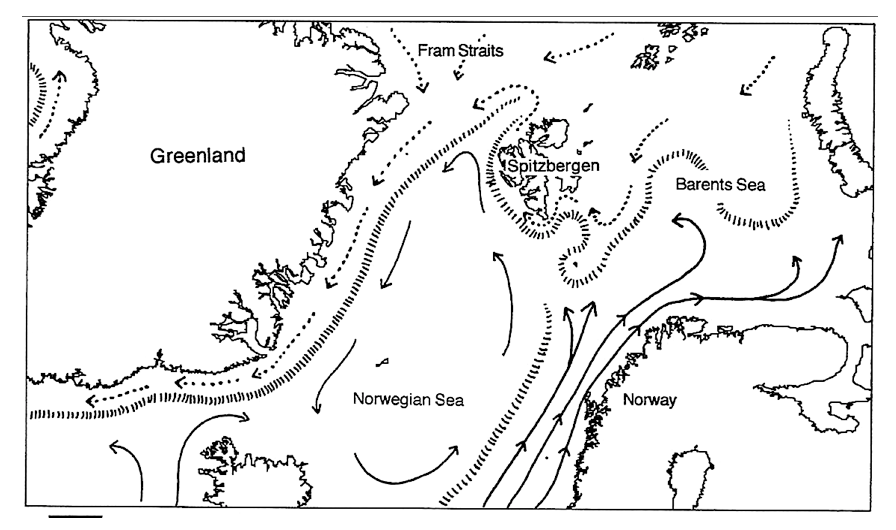
The 700N parallel encloses extensive continental regions that were once ecologically rich forest and grassland but now support agriculture, stock raising and urbanisation. A remnant of the north polar ice-cap of past epochs lies beside a small central ocean having extensive continental shelves; these are wide open to the wind-driven passage of sun-warmed Gulf Stream and North Atlantic water through the Norwegian Sea and to a less important influx of cooler Pacific water through the Bering Straits.

But the 70oS parallel passes closely around an ice-capped continent half the size of Africa that is vegetated in only a few places, mostly by moss and lichens, and is inhabited solely by marine mammals, birds and scientists. It is surrounded by the frigid, windy Southern Ocean that isolates it from the influence of sun-warmed tropical water.
The climate of the Arctic and its small central ocean
An expressed certainty of climate science is that anomalous warming of the Arctic, to beyond historical conditions, is “on track with the Intergovernmental Panel on Climate Change’s worst-case climate warming scenario“.[1] Such comment seems singularly uninformed considering the rich information we have concerning the changes in Arctic climate in the recent and distant past.
The development of a European civilization occurred only because of the massive flow of sun-warmed water from the North Atlantic Current into the eastern Arctic Ocean, and it has survived despite the strong and natural variability of this flow.
The consequences for the people of the northern lands of Europe and North America during future periods of reduced flow through the Norwegian Sea have not been – and will not be – comfortable: recall the call to arms of the scientific community in response to the advancing glaciers in mid-20th century because, after a 20-year progressive cooling in high northern latitudes and significant glacier advances, fears of a new glacial period were widespread.

An article in Science News suggested that ‘The unusually beneficial climate of the past few decades may be degenerating, facing humanity with a new challenge to survival’ recalling the bitter winters at the end of the 18th century, when the icy coastal waters of New York immobilised the British fleet, and the revolutionary army hunkered down in frozen fields in New Jersey.[2] Then, in the early 1980s, glaciers began to retreat again and northern air temperature data suggested that a new warming trend had set in, so we quickly forgot about ice ages and instead stirred ourselves into action to study the potential radiative consequences of CO2 accumulation. Indeed so profound is the loss of memory that a fundamental assumption today is that northern polar regions have warmed substantially since 1900. Extraordinary surface air temperature (SAT) anomalies are reported over the Arctic Ocean of as much as 2.5-3.5oC, compared with a global mean anomaly of only 0.44oC for the same period.
But this result was based on inappropriate homogenised and gridded SAT data from all available land stations, together with surface air temperature data where these exist over the oceans.
The Arctic climate has been characterized by a millennial-scale cooling trend (of order minus 0.22oC/1000 yr) that correlates with a long period of weakening insolation since the end of the Mediaeval Warm Period and which was reinforced by feedback in higher latitudes.[3] The Danes who settled in eastern Greenland, built decent stone houses and churches, but vanished in the 13th century when they could no longer raise crops, were victims of the changing climate which only the indigenous population was able to survive. This long period of weak solar radiation was reversed only in the final decades of the 19th century, with a renewal of warming that continues today despite the brief intermission of the 1940-60s.[4]
It is widely assumed that current reduced ice cover on the Arctic Ocean is a unique event, and perhaps some readers will think that those ships captains reports of “unheard-of temperatures” need not be taken seriously – but Norwegian oceanographers had also reported ice-free water to above 81oN, and that ‘warm Gulf Stream’ water was encountered in their profiles as far north as Spitzbergen: they suggested that this should ensure ice-free conditions there ‘for some time to come’. They also noted that “…at many points where glaciers formerly extended far into the sea they have entirely disappeared“. Mean summer sea surface temperature at Spitzbergen had been around 3oC for 50 years prior to 1917, but by 1922 had risen to 5oC, leaving open water around the island all winter.
This regional climate shift stimulated economic changes in the northern Barents Sea – the open season for shipping coal from Spitzbergen was to lengthen from 3 to 7 months by the late 1930s.[5] Thereafter, cooling again intervened in the Arctic and by the 1950s, very extensive ice was once again developing around Iceland, creating havoc with agriculture. At Franz Josef Land the mean surface air temperature declined during the 1960s by 3-4oC and the winter minima declined by as much as 6-10oC.
The essential Icelandic hay crops once again failed and grain crops were abandoned, while fishing off both Iceland and west Greenland faltered as cod stocks declined or migrated. This cold period in the Nordic and Arctic seas was only reversed during the late 1970s – but this time we heard no satisfaction that the region was becoming again more habitable: instead, concern was expressed that the warming was irreversible, because anthropogenic. [6]
This concern would seem to ignore the clear evidence of warm conditions in the Arctic in the more distant past, especially in the regions to the northeast of Greenland where whaling effort was concentrated in the 19th century. William Scorsby, the whaler, made regular voyages to this region and in 1811 noted that the ice barrier northeast of Greenland was breaking up: ‘I observed on my last voyage about two thousand square leagues (18,000 square miles)…between the parallels 74-80o perfectly void of ice, all of which had disappeared in the last two years’. In 1846, on the Siberian coast, the River Lena was hard to locate in a vast flooded landscape and could be followed only by the ‘rushing of the stream’ which ‘rolled trees, moss and large masses of peat’ against a Russian survey ship, which secured from the flood ‘an elephant’s head’. [7]
It is now abundantly clear that any model of the 21st century Arctic climate must integrate the periods of warming and cooling known to have occurred in the past; it must be compatible with observations of ice cover with the 60-80 year cyclical low atmospheric pressure and warming of the northern North Atlantic (coded as the NAO) and the concurrent increased flow of warm Atlantic water into the Arctic Ocean associated with an atmospheric Low Frequency Oscillation (LFO). This integration has not often been done in recent years, attention having shifted to the possible consequences of the radiative effects of atmospheric carbon dioxide, but the rapid reduction of ice cover in the 1990s was associated with a very active pattern of wind forcing “due to the synchronous actions of the AO and the LFO“.[8]
At millennial time scales, the progress of warm and cool periods in the Arctic can be traced with the use of proxy data. Long ice-cores from two locations on Svalbard, whose chronology can be constrained by radionuclide and oxygen isotope analysis and by sulphate and volcanic dust layers of known date, are remarkable, recording even the minor 1950-1970 cooling period.[9] These and other multi-proxy evidence suggest that although there was a steady increase in ice-cover during the Holocene from a very low to a rather high summer coverage that peaked between 2000 and 4000 years ago, there were periods when there was sufficient open water in summer in the Canadian archipelago for Pacific and Atlantic bowhead whales to mingle, and for the Dorset and Inuit people to migrate eastwards along northern Canada.[10]
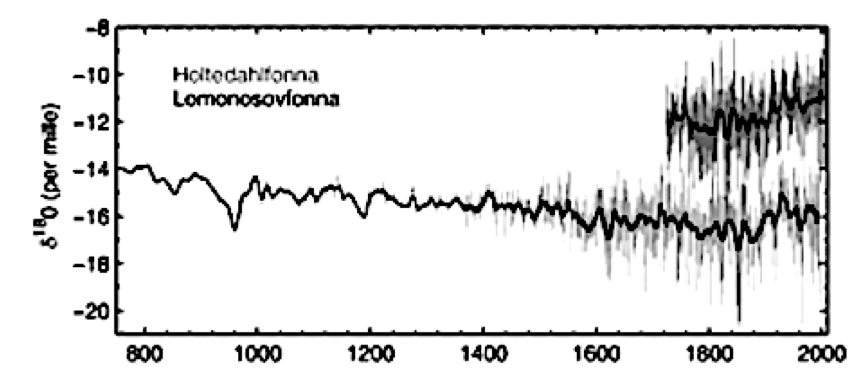
A very long and continuous proxy record from Lomonosovfonna, Svalbard (and a short one from northern Norway) has been used to demonstrate the progression of a winter cooling trend of about 0.3-0.9oC/century during more than a millennium prior to 1850, at which time there was a brief warming followed by stasis.[11]
The study of these cores has been extended using two shorter (1700-1980) ice-cores from Longyearbyen and Vardo on Svalbard whose chronology was constrained by radionuclide and oxygen isotope analysis and by sulphate and volcanic dust layers of known date, instrumental data from Vardo being used for calibration.

The changing distribution of ice cover on the Arctic Ocean during this long period of cooling has been confirmed by other proxies which give generally consistent results: reference horizons and annual-layers of oxygen and hydrogen stable isotopes in the Severnaya Zemlya ice core reveal that the cooling which reached absolute minimum temperatures in the 19th century was associated with a decline in summer insolation, and with concurrent growth of the ice cap from which the core was obtained.[12]
Further evidence is not lacking for this result: analysis of the Lomonosovfonna ice core and of timberline tree ring proxies from northern Scandinavia were used to reconstruct the evolution of ice cover in the western Nordic seas over this very long period.[13] This “successfully explained 59% of the variance in sea ice extent during the calibration period 1864-1997” and identified less persistent periods of low sea ice in the late 13th, the early 15th, and the mid-17th centuries. The record is dominated by decadal-scale change associated with the NAO/Arctic Oscillations but the authors insisted that “the present low sea ice extent is unique” in the record and originated in a decline that started in the late 19th century after the Little Ice Age of the 17th-19th centuries.
These cores suggest that surface temperature responds to some factor that marches in step with secular change in solar intensity: it would be easy to suggest that the connection is one of simple solar warming, but that case is not made here. This long-term cooling appears to have been arctic-wide and independent of any direct consequences of solar radiation (expressed as sunspots or solar flare frequency) which took a generally opposite trend during the same period.

However, during short periods (i.e. rectangle in the sunspot figure) there was a very good match between sunspot numbers and the temperature indicated by the proxies, even though direct and sustained correlation between sun and local surface temperature is not generally to be expected: rather, the sun’s activity cycles usually impose an indirect effect on atmospheric pressure cells and wind regimes resulting in local warming and cooling. Observations of correlation between solar activity and US surface temperature showed this very clearly: west of the continental divide the correlation was negative but, east of the mountains, the correlation was positive and increased towards New England where it was maximal. [14]
This is not a unique case and similar regional relationships lie behind correlations between solar strength and the values of indices such as the North Atlantic Oscillation (NAO). Rather than a simple, CO2-induced warming trend, records of ice-cover in the four seas that lie north of Siberia (Kara, Laptev, East Siberian and Chukchi) follow better the pattern of solar radiation; ice variability in these seas is dominated by a low-frequency oscillation of frequency 60-80 years that – in the authors words – ‘places a strong limitation on our ability to resolve long-term trends’.[15] In any event, a stubborn positive state of the NAO characterized the final decades of the 20th century, associated with a strong pressure difference between the high and low pressure cells reduced ice coverage in the eastern Arctic significantly[16].

The 8.5 Sv of warm (6-8oC), salty, Atlantic water flowing annually through the Barents Sea continues eastward as the Circumpolar Boundary Current and is the main source of the regional surface water mass. As it goes, it is progressively modified by heat flux to the atmosphere, river run-off and melt-water in summer, and by salt-rejection during freezing. Atlantic water carries almost 100 TW heat into the eastern Arctic Ocean annually, while another 10-20 TW passes into the Arctic basin through the Bering Strait in a flow of about 0.8 Sv of Pacific Ocean water.[17]
Since 2002, this process has accelerated due to very thin spring ice and to the ‘memory of the system to the positive winter AO state that characterised the mid-1980s and 1990s’ as Stroeve et al. put it.[18] As well, these authors note that the character of sea ice has also progressively changed after so long a period of positive NAO values, particularly in the progressive loss of multi-year ice. The single, strongly-negative NAO index during the winter of 2009/2010 was not sufficient to reverse the process.
The pulses of warm Pacific water that pass north through the Bering Straits are more variable, but the occurrence of a major incursion was confirmed in the late 1990s by observations of Pacific diatoms (Neodenticulata seminae) in Labrador Current water. This water was transported in the anticyclonic gyral circulation along the Asian continental slope through the Makarov Basin to reach the Canadian Basin as a warm anomaly of about 0.5oC. [19]
Variability in summer ice-cover in the Chukchi Sea, north of Alaska, has been correlated with the values of the AO and the NAO, and hence with the frequency of cyclonic depressions over the Arctic Ocean. During the years 1979-2009 there was an increasing frequency and strength of extreme wind events on the north coast of Alaska during late summer and autumn: mean extreme winds evolved from 7.0 to 10.5 m.sec-1 during this period. Some very strong wind events have been recorded in recent years – the August 2000 cyclone that wrecked the little town of Barrow on the north coast of Alaska included gusts that were reported at about 120 km.hr-1. [20] Such conditions will not only hasten melting of ice formed the previous winter but, independently of that process, will also increase the apparent area of open water by rafting and compacting small, isolated ice floes.
Unfortunately, no contemporary discussion of recent Arctic conditions can ignore the furore occasioned in September 2012 as the press reacted to the news that the area of open sea in the western Arctic Ocean was larger than the previous ice minimum observed a few years earlier. Perhaps this modern record for open water may have been the immediate effect of the passage of an exceedingly deep (970 mb) and rapidly-moving Pacific depression into the western Arctic in early August whose heavy winds fractured and dislodged the ice-pack.
Such consequences of variable wind stress in the central Arctic Ocean have been almost entirely ignored in discussions of ice loss, on the grounds that the evolution of ice cover is controlled almost entirely by air temperature and solar radiation. Satellite imagery show that a quasi-permanent depression may migrate around the central ocean in response to boundary conditions along the Asiatic and American coasts.[21] This depression and its associated cloudiness was prominent in summer 2016 and was perhaps responsible for the fact that ice cover in mid-August of that year was relatively extensive compared with the year of minimal cover, 2012.
NOAA publishes an annual ‘Arctic Report Card’ – described as “a timely and peer-reviewed source for clear, reliable and concise environmental information on the current state of different components of the Arctic environmental system relative to historical records” – that has been astonishingly successful in convincing readers that the Arctic has warmed at almost twice the rate of the rest of the planet and that “Arctic amplification of climate change remains in full swing”. But the Arctic Report Card takes a very generous view of the region, using 60oN as its southern limit. This parallel passes just north of Scotland and includes all of Scandinavia and the entire northern half of Siberia down to the high country of eastern Asia. Some large cities (Bergen, Oslo, Helsinki, St Petersburg and the rest) are therefore included in the instrumental data from this region.
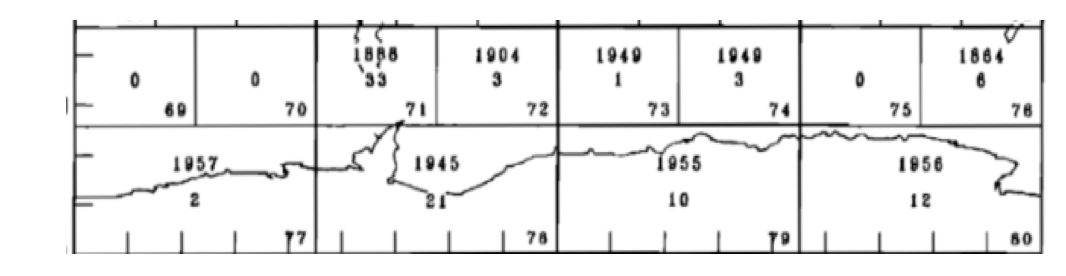
This is an extraordinarily extensive view, extending a full 5o latitude to the south of the Arctic Circle, but NOAA are not alone in their choice: a similar pattern of Arctic temperature evolution is suggested by a Russian compilation of SAT data from almost 1500 northern hemisphere stations gridded in cells of 50 latitude x 100 longitude (left, below).

This study has been cited in an influential review as ‘some of the first evidence of the warming over the Arctic Ocean projected by models’.[22] This conclusion is supported by a more sophisticated study (above, right) of an almost identical region that presents monthly anomaly data from 441 land stations from the Russian archives and reaches the same conclusion, while suggesting that warmer summer temperatures have dominated the change.[23]
However, the most pertinent – but largely neglected – description of how SAT has evolved over the Arctic Ocean is the compilation of Polyakov (of U. Alaska) because only very long coastal stations, mostly extending back to the 1880s, were used.[24]

The selected data represent this region very adequately (although I would have preferred the elimination of the three stations in Finland and Sweden, and of Aberdeen in Scotland); a simple pattern of SAT evolution within the arctic basin is indicated which conforms to this compilation does not support the same pattern of progressive warming as the two studies discussed above. On the contrary, it makes perfectly clear that, on the coasts of the Arctic Ocean, the end of the century was no warmer than during the 1940s; Polyakov attributes the pattern of change to the consequences of the northern hemispheric low-frequency oscillation (LFO) in regional atmospheric pressure.
Yet another compilation of arctic data and proxies took 64oN as the limit of the Arctic region, within which 59 stations were used to analyze the pattern of regional co-variability for SAT anomalies based on PCA techniques.[25] The most important result of this study was obtained by power-spectrum analysis of the proxies that demonstrated quasi-periodicity of 50-80 years in ice cover in the Svalbard region: at least eight previous periods of relatively low ice cover can be identified back to about 1200. This low-frequency oscillation is ubiquitous in many modern time-series of biological data from the ocean.
Collectively, these studies present two critical results. The first is that, around the shores of the Arctic Ocean and Nordic seas, surface temperatures did not reach levels equal to those of the 1930-40s even by the end of the 20th century: if any northern amplification of surface temperature exists, it stops short of the coasts of the Arctic Ocean. The second, and perhaps more important, observation cannot be avoided: that the pattern of temperature change obtained from surface observations in the ‘real’ Arctic very closely conforms to long-term persistent solar forcing. Unfortunately, when cyclical or periodic phenomena such as evident in Arctic temperatures are discussed, a solar cycle influence on surface air temperature is promptly proposed and as promptly rejected.[26]
Most of the concerns expressed concerning Arctic amplification relate to the potential effect of the loss of ice cover on the Arctic Ocean and over the northern Barents Sea so perhaps it would have been better to look first at the evolution of temperature on the ice-fields themselves, and to give less weight to data from urbanized northern parts of Europe and Asia. The data most appropriate for that task are those obtained at the drifting Russian ice-camp on the central Arctic Ocean: these record no progressive change in surface air temperature, annual means range in the rang of -17 to -20oC throughout the observing period, now unfortunately terminated.[27]

This relatively unchanging pattern of the freezing/melting seasons on the central Arctic Ocean has nevertheless been accompanied by a progressive decrease in summer ice cover on marginal Arctic seas in two areas: (i) to the east of Greenland and along the Siberian coast and (ii) north of Alaska and Canada.[28] This has been associated with a long-term decrease in sea ice and bergs that are carried in the Labrador current to the adjacent North Atlantic, far to south of Newfoundland.[29]
In the 1960s, this flux routinely extended as far south as the coast of Nova Scotia at 45oN, was reinforced by regional freezing on the Bay of Fundy as far south as the shores of Maine. But, since the late 1980s, these regions have been ice-free year-round.

While research papers concerning Arctic amplification continue to appear, many do not examine the regional instrumental data directly and critically, but rather base their studies on ERA reanalyses of meteorological data: a recent case is that of the use of regional data from the GMST archive to specify surface temperature in relation to the rate of retreat of ice cover; CMIP and other simulations “are accurate only in runs that have far too much global warming..this implies that the models may be getting the right sea ice retreat for the wrong reasons...”.[30]
Then, a second and perhaps more important observation cannot be avoided: that the pattern of temperature change obtained from surface observations in the ‘real Arctic’ very closely conforms to long-term persistent solar forcing. This is, of course, a direct contradiction of the results of simulation models (e.g. with the Coupled Model Intercomparison Project version 3 of IPCC4) that have been used to affirm that that increased summer ice melt observed today is forced almost directly by surface air temperatures over the ocean: “the current reduction in Arctic ice started in late 19th century consistent with the rapidly warming climate and became very pronounced over the last three decades, unmatched…last few thousand years and unexplainable by any of the known natural variabilities.” [31]
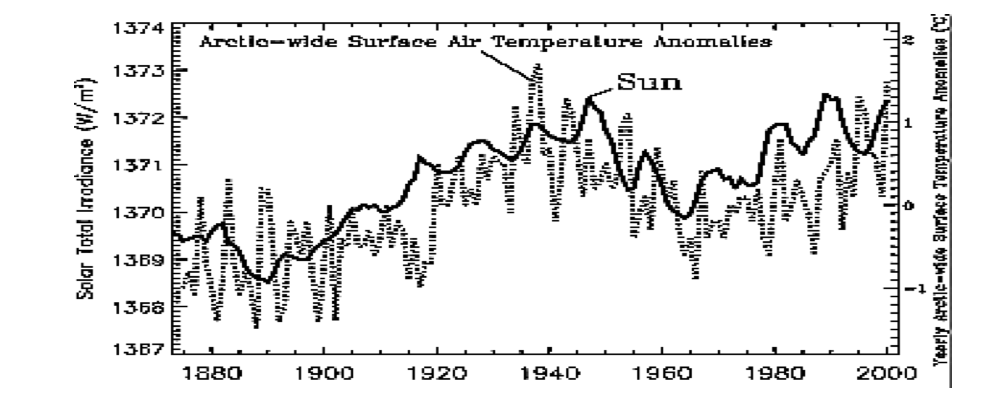
Despite such results, the above plot shows that surface temperature responds to some factor that marches in step with the progressive advance of secular change in solar intensity: it would be easy to suggest that the connection is one of simple solar warming, but that case is not made here. The author of this plot pointed out that one prime consequence of solar forcing – at least in the northern hemisphere – is to control the Equator-to-Pole surface temperature gradient. The Arctic Ocean has a unique role in modulating global climate state because of its open connection with the Atlantic Ocean, and perhaps also because of the consequences of downwelling in the Norwegian and the southern Labrador Seas.[32]
These conclusions are inconsistent with standard assumptions concerning ice loss outlined in the ‘Detection and Attribution’ chapters of IPCC Assessments, which consistently attribute ice loss to increasing air temperatures. But although everyone knows that sea water freezes only at lower temperatures than fresh water, the rather variable salinity of the surface layer of the Arctic Ocean is virtually absent from the IPCC discussion of causal mechanisms.
Seasonal cycles of vertically-integrated heat storage and of energy transport suggest that the net surface flux across the ocean’s surface is the primary driver of seasonal heat change in the Arctic Ocean.. Balance is assumed in July between incoming SW radiation and outgoing LW radiation (each about 230-240 Wm-2), and also lateral atmospheric transport of 91 Wm2. About 120 Wm-2 of SW radiation enters the ocean, which loses 10 Wm-2 of LW radiation back to the atmosphere.[33] A net July flux of 110 Wm-2 is therefore proposed from the atmosphere into the ocean, with which is associated some ice-melt and sensible heat gain, and this is presented as the principal cause of seasonal changes in heat storage in the Arctic Ocean, dominating the 6 Wm2 accumulated from heat exchange divergence (sea/ice) and from sensible heat flux associated with Atlantic and Pacific water passing into the Arctic.
But that model ignores the consequences of incursions of warm North Atlantic water through the Norwegian Sea, well past the Arctic Circle and approaching 80oN and so on into the Barents Sea: it suggests instead that atmospheric processes dominate the heat budget. Calculations such as those of the AR4 of the IPCC fail to answer the question before us: why is the Arctic so variable? Since the model invokes oceanic and atmospheric data only for the period 1979-2001, no data to represent the alternation of episodes of weak and strong Atlantic water influx to the Barents Sea were available to the model. In the end, it is surely misleading to approach the variability of Arctic sea ice by considering only local conditions in the Arctic Basin. Arctic variability can be understood only by emphasising that the Arctic region is wide open to the highly dynamic and variable North Atlantic current system.[34]
Yet this oceanic connection merits only brief comment in AR5: ‘Ocean circulation delivers warm water to ice sheets. Variations in wind pattern associated with the NAO….probable drivers of increasing melt at some ice margins’. This is a weak acknowledgement of the fact that the dynamics of Arctic Ocean sea ice – and so of the variability of the area and thickness of seasonal ice cover – is dominated by oscillations that are ‘associated with decadal components of the NAO/AO and multi-decadal lower frequency oscillations operating at 50-100 year. Sea ice and NAO showed a non-stationary relationship during the observational period’. [35] Models agree that increased cyclonicity is associated with high values of the NAO and favours lighter ice conditions in the Eurasian Basin, as occurred during the period 1940-60 and again at the end of the century.[36]
In fact, observations confirm that variability in the Arctic is very largely associated with the variability in the flows through open passages to both Atlantic and Pacific Oceans, which themselves respond to the different and characteristic variability of their circulation patterns, however forced. Of the two passages, the wide-open Arctic Ocean-Nordic Seas connection is the most important and the oceanography of this region has long been a focus of research and review, so that the dominant processes are now rather well understood and quantified.[37]
Of the 8.5 Sv of warm, salty Atlantic water that passes north across the Greenland-Scotland Ridge annually, about 4.0 ±2.5 Sv passes into the Barents Sea either directly to the north of Norway as a barotropic flow, or along the western coast of Spitzbergen as a baroclinic flow. This warm water (6-8oC) carries almost 100 TW of Atlantic heat into the eastern Arctic Ocean annually, while another 10-20 TW passes into the Arctic basin through the Bering Strait in a flow of about 0.8 ±0.2 Sv of Pacific Ocean water.[38]
Because the incoming and the outgoing flows, warm and cold respectively, lie side-by-side between Greenland and Scandinavia, an asymmetry is induced in the distribution of ice-cover on the Arctic Ocean; this is generally dense to the west of Fram Strait while, to the east of Spitzbergen, much of the Barents Sea – at similar latitudes – remains ice-free even in winter under Atlantic influence. The outgoing flow through Fram Strait and down the eastern coast of Greenland also carries with it large volumes of fresh water as fragmented pack ice, a flow that is strongly episodic at decadal scale and is associated with the series of salinity anomalies observed in the Nordic seas that were discussed earlier.
Variability in Atlantic flow into the Arctic basin is recorded in annual varves in sediment cores from the West Spitzbergen Channel, and these suggest that ‘the early-21st century temperatures of Atlantic water entering the Arctic Ocean are unprecedented over the past 2000 years and are presumably linked to the Arctic amplification of global warming’.This proposal was very influential in moulding opinion concerning the effects of anthropogenic global warming in the Arctic, and was based on the fact that the number of sub-polar species of fossil foraminifera currently being deposited exceeds the number of polar species for the first time in the last two millennia, and that by about double.[39]
The significance of such events continues to be explored: a synthesis of circulation in the Arctic basin has been made from almost 3000 oceanographic profiles obtained in the central Arctic Ocean since the 1890s, which were not previously accessible.[40] This makes it clear to what extent the variability in the inflow of ‘warm and salty‘ North Atlantic water at times of positive values of the NAO by importing ‘vast quantities of heat‘ into the Arctic Ocean to induce core temperatures in the intermediate layer in Nansen Basin that are much warmer than in the Canadian Basin, far downstream. Canada Basin and along the Siberian coastline, where it may survive summer melting.

Transport of warm water on this scale appears to be related to the pattern of low and high pressure cells in the atmosphere. A stubborn positive state of the NAO characterised the final decades of the 20th century, and was associated with significantly reduced ice coverage in the eastern Arctic due to incursions of Atlantic water.
The first evidence that a warm pulse in 1990 had entered the Arctic Ocean was the occurrence of anomalies of order 1oC in the deep water mass of the Nansen Basin. This water was transported in the anticyclonic gyral circulation along the Asian continental slope through the Makarov Basin to reach the Canadian Basin 7 or 8 years later as a warm anomaly of about 0.5oC. A second set of slightly warmer pulses was detected at Fram Strait in 2004 followed the same trajectory as in 1990, and peak warming in the Eurasian Basin occurred in about 2007. [41] The Canadian Larsen-93 survey of the eastern Arctic explored this intrusion of warm Atlantic water whose potential temperature maximum (of 1-2oC) had by then reached far into the Laptev Sea (130oE) passing below areas of permanent polar ice cover: this was qualified as ‘a major thermohaline disturbance…now occurring in the Arctic’ by Eddie Cormack and his co-authors.[42]
Because a <50m layer of low salinity Arctic water lies directly below the ice, these deeper pulses of warm North Atlantic water are not in direct contact with the pack ice itself. But, despite microstructure observations that suggest that mixing is very weak across this halocline, heat budget estimates nevertheless yield significant vertical fluxes. These in turn suggest that decreases in ice thickness of <30 cm may be at least partially attributable to this flux, rather than to the supposed consequence of a warming atmosphere over the Arctic Ocean by the studies of Arctic SAT data that were discussed above.

The pulses of warm Pacific water that pass north through the Bering Straits are also rather variable, and the occurrence of a major incursion was confirmed by observations of Pacific diatoms (Neodenticulata seminae) in Labrador Current water in the late 1990s; following the gyral circulation of the Arctic Ocean, it is presumed that these must have passed eastwards through the Chukchi Sea and along the Canadian coasts.[43] Sea surface temperatures at the source of these fluxes in the Bering Sea have followed the now-familiar pattern of a fin de siècle repetition of the mid-20th century warming, and so they closely match the evolution of the PDO, seen here alongside change in the AMO.[44]
The significance of this observation is that it confirms that the inflow of Pacific summer water (PSW) in the late 1990s through wind forcing of near-surface transport was both unusually warm and unusually strong – as it must have been to transport Pacific organisms unusually far eastwards along the Canadian coastline and then south into the Labrador Sea.
The area of flow through the southern Canadian basin and the Chukchi Sea corresponds with the area of summer ice reduction during the late 1990s. However, increasing Bering Sea temperatures at the end of the 20th century cannot formally be correlated with relative ice loss in the Arctic Ocean, and an alternative mechanism has been proposed: that the warm pulse of PSW retards winter ice formation and so ensures a more efficient transfer of momentum from wind to the coastal water mass which ‘in turn causes an imbalance between ice growth and ice melt’. This feedback mechanism, leading to an abrupt change in coupling efficiency, is unique to ice-covered seas and may possibly dominate processes in the Arctic Ocean. [45]
Variability in summer ice-cover in the Chukchi Sea, north of Alaska, has been correlated with the values of the AO and the NAO, and hence with the frequency of cyclonic depressions over the Arctic Ocean. During the years 1979-2009 there was an increasing frequency and strength of extreme wind events on the north coast of Alaska during late summer and autumn: mean extreme winds evolved from 7.0 to 10.5 m.sec-1 during this period. Some very strong wind events have been recorded in recent years – the August 2000 cyclone that wrecked the little town of Barrow on the north coast of Alaska included gusts that were reported at about 120 km.hr-1. [46] Such conditions will not only hasten melting of ice formed the previous winter but, independently of that process, will also increase the apparent area of open water by rafting and compacting small, isolated ice floes.
Consequences of variable wind stress in the central Arctic Ocean have been almost entirely ignored in discussions of ice loss, on the grounds that the evolution of ice cover is controlled almost entirely by air temperature and solar radiation. Yet informally-reported observations of satellite imagery show that, in at least some years, a quasi-permanent depression lies in the polar region, migrating around the central ocean in response to boundary conditions along the Asiatic and American coasts.[47] This depression and its associated cloudiness was prominent in summer 2016 and was responsible perhaps for the fact that ice cover in mid-August of that year was more extensive compared the same date in the year of minimal cover, 2012.
To summarise the arguments presented so far concerning ice-loss in the Arctic basin, at least five mechanisms must be now recognised in the absence of satisfactory evidence of anomalous warming of the surface air mass above the ice: (i) slowing of winter-ice formation, (ii) upward heat-flux from anomalously warm Atlantic water through the surface low-salinity layer below the ice, (iii) wind patterns that cause the export of anomalous amounts of drift ice through the Fram Straits and disperse pack-ice in the western basin, (iv) cloud cover associated with persistent depressions in the central ocean and (iv) the anomalous flux of warm Bering Sea water into the eastern Arctic of the mid-1990s.
These and other observations have been integrated into an oscillatory model with feedbacks and two unstable end-points that is consistent both with classical studies of past climate states, and also with recent analysis of ice dynamics in the Arctic basin by Zhakarov, whose model identifies feedback between atmosphere and ocean, both positive and negative, that interact in such a manner as to prevent long-term trends in either ice-loss or ice-gain on the Arctic Ocean to proceed to an ultimate state. [48]
The model is conceptually simple: during periods of high precipitation when winter ice forms readily, summer ice cover increases, the atmosphere cools, the Arctic front together with its associated precipitation belt shifts south so that freshwater input to the Arctic Ocean decreases, and winter ice cover is thicker, has a deeper draft, and so survives better in summer. This, in turn, shifts the Arctic front poleward again, warms the atmosphere and so completes the cycle by reinforcing the influence of the halocline of the Arctic Ocean.
This oscillatory mechanism for the control of Arctic summer ice cover, based on the changing freshwater balance of the upper layer of the Arctic Ocean, has been interpreted more recently in terms of a low-frequency climate signal that ‘propagates through a network of synchronised climate indices’ with the familiar 60-80 year Gleissburg frequency. Based entirely on observations, it has been demonstrated that the AMO signal propagates sequentially – with suitable delays – through a suite of other indices of northern climate states, culminating in an opposite-signed hemispheric signal associated with the AMO after about 30 years. This sequence has been presented in the following abbreviated form:
negative AMO→AT→NAO→NINO3.4→NPO→PDO→positive AMO [49]
This matches very closely the sequence observed: a warming regime was initiated around 1918 following a transition of the AMO from cooling to warming. In the early 1920s this was followed by the same transition in the AT and then, in about 1930 in the PDO and finally, at the end of the 1930s, a switch to a cooling regime in the Arctic that introduced a new northern hemisphere state to a warming regime that was once again initiated by a new transition in the AMO. The tempo of this sequence modulates stock-size in some important species of cold-water commercial fish, and hence the ecological state of northern seas.[50]
This sequence is logical and cyclical and appears to lie behind the alternation of bistable, alternating climate states observed in proxies during inter-stadial periods between Quaternary glaciations.

This model is surely correct in its general assessment of the critical importance of the state of the North Atlantic and of the significance of the Barents Sea connection between subtropical and polar regions, even though it has been attacked vigorously. [51] This critical region controls climate states at scales that interest us today, supporting the argument made in the last chapter and we can no longer treat climate change in Arctic regions as a simple and direct response to anthropogenic contamination of the atmosphere, as required the standard model?
But ignoring all this, some agency reports continue to refer to the progressive loss of seasonal ice cover in the Arctic Ocean exclusively as a consequence of anthropogenic warming of the atmosphere. The NASA Goddard report on winter sea ice extent in 2016 was typical: it was ‘another record low’ attributable to record high atmospheric temperatures ‘around the globe and in the Arctic’ and to ‘warming ocean waters’: no mention is made of earlier alternation of cold, heavy-ice and warm, open-water periods.[52] This is in line with NOAA’s annual ‘Arctic Report Card’ – described as “a timely and peer-reviewed source for clear, reliable and concise environmental information on the current state of different components of the Arctic environmental system relative to historical records” – that has been astonishingly successful in convincing readers that “The sustained transformation to a warmer, less frozen and biologically-changed Arctic remains clear“. This document uses language suitable only to a report on the progress of a very sick patient in hospital: the progress of seven ‘Vital signs‘ are tabulated, comparing progress or regress from year to year.[53]
The attitudes of NASA and NOAA are contagious. A press report on climate research on Svalbard and in Norway described interviews with scientists then working at Longyearbyen, who talked of the recent period of sea-ice loss and glacier retreat as if it were a unique and novel event – no mention was made by them of the conditions that so impressed Captain Ingebrigsteen almost a century previously.[54] Such a myopic view of environmental change is unfortunately very common today for reasons only too easily understood.
The continent and oceans at the bottom of the world
The Antarctic is the antithesis of the Arctic, the southern polar region being occupied by a high, continental-sized mass of ice that reaches to 5000m elevation, having depths over terrain of 2-4 kms; this ice flows coastward, especially down the valleys in the fragment of Gondwana that lies below the accumulated ice. The coastal mountain range of western Antarctica is a sector of the volcanic ‘ring-of-fire’ that surrounds the Pacific Ocean, so geothermal activity occurs along this coast and the Peninsula that stems from it.[55]
The opening of the Drake Passage during the Cenozoic isolated Antarctica and created continuity of the Southern Ocean around the bottom of the planet, radically altering ocean circulation in the southern hemisphere.[56] Consequently, the South Atlantic basin is not an inverted mirror-image of the North Atlantic and its form ensures that sun-warmed surface water from tropical regions does not pass down the coast of South America to very high latitudes as Gulf Stream water flows up the coast of North America and on into the Arctic basin. Instead, the warm water of the Brazil Current turns eastward at 60oS within the South Atlantic gyre towards Cape Town and does not penetrate the frigid surface water mass of the Southern Ocean.
Further, some of the warm surface water that is formed in the South Atlantic is lost to that ocean when it flows into the North Atlantic basin in the North Brazil Undercurrent; this flow carries 23 Sv above 1000m “of which 16 Sv are warmer than 7oC and form the source waters of the Florida Current” later to enter the Gulf Stream .[57] This is perfectly clear in Tomczac and Godfrey’s classic figure (below) which also shows that the poleward transport of warm tropical water in the Indian Ocean is curtailed when the Agulhas Current runs out of topography at <40oS before reaching the Cape and turns eastward across the Indian Ocean. Just a few eddies of sun-warmed Aghulas water retroflect into the South Atlantic, eventually dissipating at around 300S off Argentina.

So, although sun-warmed water penetrates so far polewards in the North Atlantic that its variability controls the extent of ice cover on the Arctic Ocean, the Antarctic continent is insulated by the eastward-flowing Southern Ocean from the direct influence of water from tropical seas: nevertheless, even in winter, ice does not cover the entire ocean south of the subpolar front. This paradox has caught the attention of several research groups, which are not unanimous in their explanations: some suggest that the observations require a thermodynamic mechanism based on surface heating, while others offer a simpler explanation based on regional wind-drift of pack ice.[58]

Three ice-shelves extend out to sea from the Antarctic continent and are many times thicker than seasonal pack-ice, standing 25-50m above sea level. At their termination they fracture and release large tabular bergs that infest the Southern Ocean and were noted by the earliest navigators: their evolution is not an anthropogenic anomaly. There has been much recent concern over the fact that the Ronne-Pilchner ice shelf (lying to the east of the Peninsula) is showing signs of break-up at its termination. This ice-shelf attracted the attention of Revelle, who computed a global 70 cm rise in sea level when it disintegrates and melts.
Geothermal heat below some of the glaciers that flow onto the shelf causes intermittent changes in their flow rates, so these ice shelves cannot be entirely stable. A longer view of ice-shelf history (from a British Antarctic Survey group) concluded that regional “warming for several centuries had left ice-shelves on the NE Antarctic peninsula poised for collapse” although the effect is “comparatively modest” over West Antarctica and no significant change has been recorded for the rest of East Antarctica.
Climate of Antarctica
Regional climate conditions over the Southern Ocean are dominated by the consequences of change in the westerly winds that sweep around the continent. Sustained velocities of >14m/sec-1 are typical, so “to reach Antarctica one must cross at least 600 miles of the roughest seas in the world…no land to interfere with the west to east circulation of air…this is therefore the home of the wandering albatross…encircling the Antarctic continent perpetually”.[59]

These winds are induced between the northern side of the polar low pressure vortex and the southern side of the subtropical high pressure cells of the Indian, South Pacific and South Atlantic Oceans. Consequently, westerly wind strength around Antarctica is related to changes in the state of these cells, especially of the South Pacific high pressure cell that lies ‘upwind’ of the Antarctic peninsula. [60]
Changes in the pressure gradient along the southern border of this cell control the location and strength of wind speed around the polar vortex: these changes are coded as Southern Annular Mode (SAM) anomalies and are associated with large changes in the southern hemisphere climates of Patagonia, Australia and New Zealand and with some influence from ENSO states in low Pacific latitudes.[61]
Wind strength has increased around the polar vortex since the 1970s and consequently the SAM anomaly has taken increasingly values – and higher temperatures have been recorded on the Antarctic peninsula.[62]

This observed progression of the SAM is compatible with the consequences of the progressive destruction of stratospheric ozone by some 60-odd variants of molecules of the halocarbon refrigerants, solvents, propellants, and foam-blowing agents that we now find convenient to use. Ozone molecules are ephemeral and the presence of CFCs tips the balance towards their reduction which occurs preferentially within the two polar vortices.
In transient experiments, the evolution of polar stratospheric CFCs is predicted to take the following course in response to CFC-control measures in place or envisioned. [63]

Fortunately, we can monitor this evolution closely, because the Antarctic continent is unique in the confidence that may be placed on surface temperature data: we have direct access to 17 selected monthly mean data sets in the SCAR READER archive, maintained and edited by British Antarctic Survey – and therefore by some of those who made the observations – for research purposes: no homogenisation of the archive, and no gridding has been done. [64]
But it will be useful first to consider how we have had to proceed without this initiative of the SCAR. Our primary resource would then have been the homogenised GISTEMP data from NASA, using data in the grid boxes below. Box 71 includes parts of the Peninsula and also of Tierra del Fuego, so contains data from inhabited places, including small airports having strong terminal warming trends. The GISTEMP gridding procedure requires that stations on the Antarctic peninsula that are within 1200 kms of these places should be homogenised with them.
Small wonder then, that Orcades Base on the South Orkney islands in Box 71 (left, below) has warmed quite strongly following the Patagonian airports. However, in Box 72, on the South Hebrides, Grytviken has perhaps been homogenised with regional SST, as the rules require in the case of isolated islands (right, below).

To add to the confusion in the classical data, note that the UK CRUTEM data for Grytviken have also been homogenised with neighbouring boxes – but in this case so as to give a sustained warming since around 1940.

It is not clear how GISTEMP homogenisation was performed on the twenty or so Antarctic stations in the four grid boxes of the final tier but this must have been done, because the GISTEMP data of each differs strongly from the original observations archived in the GHCN by NOAA. The only possible solution (more or less within the rules) would have been to treat these as islands and homogenise them with adjacent SST.
But, however it was done, this homogenisation is at least partly responsible for the RRR (Recent Regional Rapid) warming described by a team from Goddard and the British Antarctic Survey: “During the last century the temperatures of the Antarctic peninsula have risen rapidly…total increase of around 2.8oC makes this the most rapidly warming region of the Southern Hemisphere…during the past 25 years 25,000 km2 ice has been lost…etc. etc”.[65]
This appears to me to be an overstatement and the present discussion is based on unhomogenised data which are available from two sources, (i) the GHCN-all archive of NOAA and (ii) the READER archive of the Scientific Committee for Antarctic Research (SCAR). Also consulted are data from the networks of automatic weather stations (AWS) that have been deployed in Antarctica to investigate regional climate dynamics.
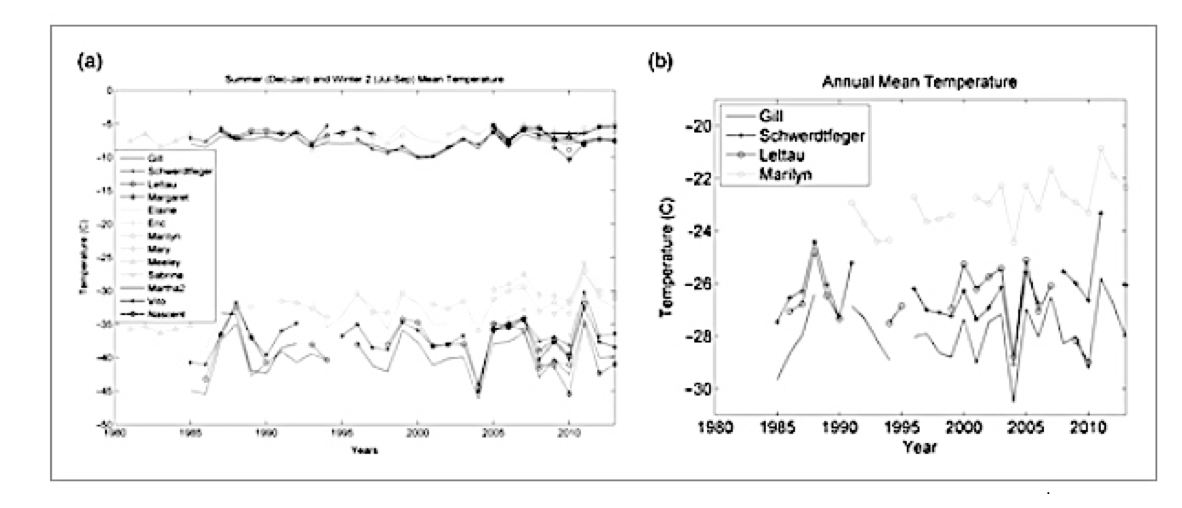
The present discussion is based on the SCAR READER and on the GHCN-all data of NOAA which are very close to the original data prior to inclusion in the GISTEMP archive. Also consulted are data from the networks of automatic weather stations (AWS) that have been deployed in Antarctica to investigate regional climate dynamics. Here are READER observations for 16 stations: 6 on the peninsula, 7 on the north and east coasts, and (c) – 2 plateau stations and 1 on the west coast. Each is plotted below together with the values of the Southern Annular Mode and, as you would expect, it is the Peninsula stations that most closely follow the wind regime in the Southern Ocean: here, the consequences of the evolution of the stratospheric ozone hole are plain for all to see.

Seven stations warmed <0.1oC/yr over a 70 -year period and the greatest warming – at Faraday/Vernadsky – reached <0.5 oC/yr or close to the IPCC estimate of global warming during the 20th century. The only other station with a similar degree of warming was its neighbour, the Rothera station which, in the GHCN-all records, is a transcription of an untidy version of the Faraday/Vernadsky data.
However, warming of the peninsula stations ceased around the turn of the century and they began gently to cool, the only exception being Orcados on the South Orkney Islands; this change of trend has been attributed to strengthened westerly winds on the Weddell Sea and in the mid-latitude jet.[66] Conditions here are very strongly influenced by regional conditions and are consistent with a reduction in the level of stratospheric CFCs discussed above. This may have occurred either as a result of control measures or perhaps naturally by change in the location, pattern and strength of the polar vortex.[67]
Temperatures recorded at Scott Base on the shores of the Ross Sea warmed progressively after the year 2000, following the trend of the two inland, higher altitude stations. But this trend perhaps requires investigation: a different pattern that lacks any progressive warming, is demonstrated by local, electronically-sensed temperature data. Soil temperatures obtained at 15 sites in the hills above Scott Base have exhibited no warming since measurements were undertaken in 1985; the data bundle from these instruments is shown below.[68] They record temperatures on the very edge of viability for microbial soil biota.

In the same region, the surface air temperature on the Ross Ice Shelf has been monitored for 35 years with an array of 13 Automatic Weather Stations. These data describe the climate that characterizes the central and coastal regions of the shelf and that of the Transantarctic Mountains: none shows any sustained trend in surface temperatures.[69]
Nor do the GHCN data for McMurdo, situated on the coast adjoining the Ross Ice shelf, support the warming pattern post-1970 at Scott Base shown by SCAR data, but rather of a shift in conditions near 1970. I can offer no comment except to note that Scott Base is currently under reconstruction.

It will be useful to review some other examples of GHCN data for Antarctica. Below (left) are GHCN data from Belgrano appropriate to the Ronne-Pilchner ice shelf; the break in the data indicates the move of the observatory to more solid ground. Despite this move, the record testifies to 70 years of regional thermal stasis. Similarly, long-term change in GHCN surface temperature at Mawson and Concordia on the east coast, facing Australia, is no more than a very slight cooling trend over a similarly long period.

Russian observations at Vostok, an inland station on the slopes of western Antarctica, suggest that progressive warming has not been observed there since 1950. Rather, these Russian observations from the GHCN-M suggest that mean annual air temperature has cooled progressively recently: the monthly plot (right, below) suggests that, for a period of 20 years, observations at Vostok were problematic, but were taken in hand around 2005: how to connect the early and recent periods is not obvious

Be that as it may, SCAR READER data show both Vostok and the Amundsen-Scott polar station warming in the final years: at the Pole, this trend (which coincided with the opening of the new station building) has been associated with changes in atmospheric circulation pattern at mid-southern latitudes, resulting from a downward shift in the Interdecadal Pacific Oscillation and therefore with increased transport of warm air from the Weddell Sea over the continent.[70]

The most urgent reports of warming come from the Peninsula, where research on the status of ground cover of lichens and moss suggests some regrowth; however, this volcanic area has surface evidence of geothermal heat, which may not to be hoped-for explanation of observations. Such questions are currently examined by data from research stations such as Faraday that was established in the 1940’s, later transferred to the Ukraine and reopened as Vernadsky: it is reported to be one of the fastest-warming stations on Earth with a long-term change of 0.54oC/decade over the year and twice that during winter.[71]
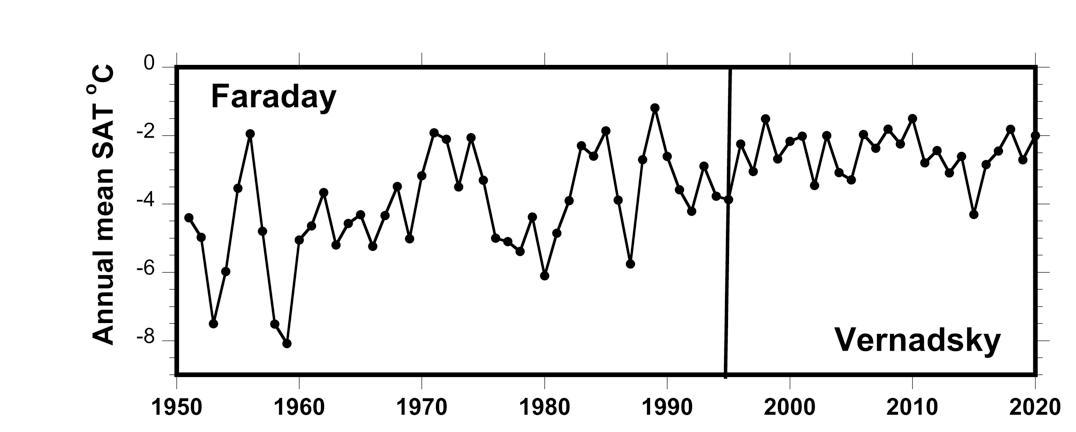
Unfortunately, the reporting and control of the observations at Faraday prior to its transfer left something to be desired: (i) the station was moved in 1954 from the small offshore Winter Island to Galindez, closer to the coast. Here, there were fewer extremely cold winter days after 1979 as ice cover progressively decreased on the Bellingshausen Sea, (ii) the data submitted to WMO contained several short data gaps in early years, and data for 10 years prior to the transfer to Ukraine failed to enter either the GHCN or GISTEMP, but now appear in the READER archive as plotted below, (iii), variability in the observations significantly tightened under Ukrainian management. Indeed, the data from the final 20 years appear not to be a continuation of previous observations – perhaps the instruments were placed differently after the transfer of ownership?
Yet, despite these uncertainties the GHCN archive at Vernadsky was cited in 2005 as “an extreme case, about twice” that of the overall, long-term warming trend on the Peninsula: 0.6oC annually and 1.1oC in winter semesters. This has been associated with appropriate changes in pressure systems and the concurrent trend in the value of the Southern Annular Mode. [72] However, I would prefer not to place much confidence in the data from Vernadsky and this opinion is strengthened by finding that a fractured version of these data appears in the GHCN under the name of nearby Rothera Point.
* * * * * * * * * *
There will be those who complain that the GHCN data used here to support the main arguments of this piece are unhomogenised, are not those used by the IPCC, and therefore that my arguments are unsupported. And, indeed, I would be much more comfortable if we had a set of very reliable, very long-term data from a limited number of locations rationally distributed across all land surfaces and for which one could be absolutely confident that the data correctly represented progressive temperature change: the SCAR READER archive is a superb prototype for what we require.
The USA is a special case, being the largest region for which we have many long, well-managed records, numerically heavily weighted towards rural observations. The data speak for themselves: there has been no progressive warming in the USA during the last 150 years and the evolution of SAT follows very generally that of the Sun.

This demonstration is perfectly clear but almost perfectly ignored even though the patterns that can readily be observed in GHCN data from rural places do not support the standard model of a warming. planet The Antarctic data in the READER archive have the same message for us as the US rural-dominated data – the equilibrium climate sensitivity of CO2 must be at the lower end of the discussed values: this is clear from the observations of thermal stasis except where and when the consequences of Southern Annular Mode anomalies and of stratospheric ozone depletion are significant.
It is not surprising, then, that there has been some quiet grumbling that homogenisation was not useful except for some special purposes, and was not being performed rationally, but this grumbling has been ignored by the IPCC. In his masterly ‘Critical Review of Surface Temperature Data Products‘, Ross McKittrick addressed this issue head-on by comparing all pairs of raw and adjusted GISTEMP data in grid-cells in which both are present; he found that until about 1980, the adjustments resulted in a temperature cooler than the observations, but in later years corrections tended to be in the opposite sense. The consequence is that ‘a portion of the warming trend shown in global records derived from the adjusted GHCN archive results from the adjustments and not from the underlying data’.

The unavoidable consequence is that ‘a portion of the warming trend shown in global records derived from the adjusted GHCN archive results from the adjustments and not from the underlying data’. These adjustments increase the 20th century warming by 0.3-0.40C and this warming is now widely assumed to be real.[73] Others have, of course, investigated this , at least informally, and have come to the opposite conclusion.
In June 2016 the Goddard Station Selector facility was modified so that the individual GHCNv3 data were shown in four states: colour-coded as submitted, as adjusted, as cleaned and as homogenised.[74] For a time, this enabled click-by-click verification of McKittrick’s results (a different colour line for each of 4 steps in the homogenisation), and this abundantly confirmed his results – but now you can click as hard as you like, but only the final homogenised plot is shown. The others sleep soundly, all of them…

So climate change research proceeds profitably using a debased currency managed by two US governments agencies. But there’ll be a bill to be paid for that one day in shuttered university departments and government agencies…..
Alan Longhurst
Cajarc, France
January-February, 2021
[ References ]
Not to quibble, but the images at the beginning of the article show the regions bounded by the 60th parallel, not the 70th.
I think the article discussed why, as that is what CAGW proponents often use.
A long yet interesting post. I have a question for the author.
The post states, “Atlantic water flowing annually through the Barents Sea continues eastward as the Circumpolar Boundary Current and is the main source of the regional surface water mass. As it goes, it is progressively modified by heat flux to the atmosphere.”
We know in the Arctic that relatively warmer water rides below considerably cooler less salty water at the surface.
How effective is this warmer saltier dense water inversion and ice barrier, and cold water just below the ice, at preventing atmospheric heat loss relative to open water?
Open water heat loss is 24 – 7 – 365. Arctic Solar insolation is not 24 – 7 or 365. It is very seasonal, often overcast and is at a very shallow angle with high reflectivity, effectively reducing the effectiveness of said insolation.
So, on an annual bases is thick sea ice insulating in ocean heat content, and do relatively warm waters, only a bit above the 4C ocean deep water, transport out of the Arctic back to the ocean?
Your thoughtful consideration appreciated.
All the Best…
GISS is a criminal conspiracy.
That would appear so.
….”SHUTTERED UNIVERSITY DEPARTMENTS AND GOVERNMENTAL AGENCIES”….that’ll be the day….look forward to it.
They are currently largely shuttered in my experience, but government employees are still receiving full pay.
I work for one substantial institute in Colorado, and for about a year now, less than a few percent of laboratory researchers are actually doing laboratory research. Money for nothing.
There have been days when I was the only person working in a quarter million square foot lab building.It’s slowly changing, but it’s still very sad. At other times, several Chinese researchers would at least be around and until recently always outnumbered U.S. citizen researchers.
A lot of words (in full agreement with it all) and yet barely a scratch on the public edifice that is ‘climate change’ TM
Just look at the comments from the UK Blonde Buffoon at the UN Security Council … ” it is absolutely clear that climate change is a threat to our collective security and the security of our nation’s”
100% of the MSM/Main Political Parties/Major world Bourse Co. s are completely and utterly infected with this groupthink. And I’ve been fighting this since 1988….and I ain’t got long to go.
At least my kids know it’s all balls.
AleaJactaEst
I too was in agreement with many of the words. But with the graphs all unnumbered, I felt it was impossible to relate the words and the graphs and overall the post was very confusing.
Mine too.
“….barely a scratch on the public edifice that is ‘Climate Change’ “. How right you are, AleaJactaEst. This beautifully written, exhaustive, sensible, scientific opinion will remain unread and ignored. The bulk of our western media will not mention it – they “know” better.
Bari Weiss, in her resignation from the New York Times, put it so well : “……a new consensus has emerged in the press, but perhaps especially at this paper : that truth isn’t a process of collective discovery, but an orthodoxy already known to an enlightened few whose job is to inform everyone else”.
The Earth has been cooling for a while now irrespective of what NOAA et al are trying to hide. The El Niño has been replaced with La Niña and the warm water source for the northern Pacific latitudes is diminishing. The deeper waters under the tropical Pacific from SA to the date line are still colder than normal, so at this point if will be at least quite a few months before any chance the La Niña abates. Waters in the SH are cooling as well.
If we get one large volcano to go off we will be in a heap of trouble. Late spring frosts and early autumn ones will devastate the food producing areas. It’s possible we will already start to see some of this in the coming years, volcanoes or not.
The Earth has been cooling for a while now irrespective of what NOAA et al are trying to hide.
That’s it
Global below zero anomaliy
Hi Krishna
Could you please supply the link / source for this data / Chart
Thanks
And what is the base period for the anomaly.
The reference period is mentioned in the lower right corner
http://www.karstenhaustein.com/climate.php
Thanks
Last year was the second warmest on record. Where is the evidence that the earth has been cooling for a while?
Again, WRONG, izzy-a-fool…
The physical record is piddlingly short and is pointless before 1979
The proxy records shows that it has been WARMER THAN NOW for MOST OF THE LAST 10,000 years
Stop denying climate change science, izzy, it makes you look like a deliberately ignorant fool
Fred,
If the physical record is pointless before 1979 how do you know it has been warmer than now for most of the last 10000 years?
Would you prefer a statement that the UAH satellite record shows a consistent temperature trend since 1980 of about 0.13 degrees per decade?
There is no sign of a cooling trend in the satellite record, nor is there one in the argos data for example.
What do you think “cooling for a while” refers to?
Here’s how I know it was much warmer in the past, Izaak.
David,
That was not the claim. The statement by rbabcock was that “the earth has been cooling now for a while”. That statement is wrong no matter what temperature record you use since there has been consistent warming since at least the middle part of the 20th Century. There is no sign of global cooling and most certainly it has not been cooling “for a while”
Nice attempt at dodging my point but you failed miserably. Given the North American, Asian, and European Arctic tundra is littered with stumps such as these, it is obvious to any but a mindless zealot that it has been much warmer throughout most of the Holocene than it is today. Yet here you are wetting your pants over some moderate warming since the end of the Little Ice Age that falls well within natural variability spouting nonsense about record temperatures, melting ice caps and permafrost, polar bear extinction, etc ad infinitum. Feel free to peddle your nonsense here, but real scientists and people who can look objectively at data aren’t buying it.
ROFLMAO.
Izzy-isa-dope.. for sure.. Comprehension issues, asalways.
IGNORANCE personified.
By physical record I mean , tan acurate untainted temperature record, ie UAH
GISS et al are meaningless because they are based on fakery and urban effects.
If you are CLUELESS aboiut proxy data, you really need to go back and read all the posts that show the Holocene being WARMER THAN NOW for nearly all the last 10000 years.. Or yoo could just remain and IGNOR UNINFORMED CRETIN.
Which is again a TOTAL and COMPLETE LIE.
UAH shows warming ONLY at non-human forced El Nino events
NO WARMING from 1980 – 1997
NO WARMING from 2001 – 2015
Fred,
From Dr. Spencer’s blog post at
https://www.drroyspencer.com/2021/02/uah-global-temperature-update-for-january-2021-0-12-deg-c-new-base-period/
he states that:
The linear warming trend since January, 1979 remains at +0.14 C/decade
Perhaps you should explain to him why he is wrong.
izzy doubles down on dumb
Ignores what the data actually shows.
You said……
Is it a BLATANT LIE or just base-level ignorance.
Poor Izzy-dumb-or-what !….
No cure for such stupidity and lack of cranial activity..
Izaak,
There is one interesting consequence of your argument.
If the linear warming trend since 1979 is 0.14C per decade,how are we on track for 4C warming in the 21st Century and 2C warming by 2050 as stated repeatedly by adherents of the Paris Accord?
Is there any scientific basis for 4C warming this century or is it simply an invention by alarmist scientists deriving from guesses at the time of the Charney Report (1979)?
Any source?
As an example, between January 2016 and January 2018, NASA GISS shows a decline in world temperatures of 0.56C the largest decline since 1982/83.
Yes, coming off the 2015/2016 El Niño.
No,not evidence of “global cooling” overall but any further such episodes will obviously render improbable the 2C claim, if it is not already defunct.
This is before consideration of the 1997-2012 hiatus.
Isaak, how long is your record?
Half a cycle.
“Last year was the second warmest on record.”
Well, that depends on what record you look at.
Remember, if you are looking at a temperature chart that does not show the Early Twentieth Century to be just as warm as today, then you are looking at a bogus, bastardized, fraudulent, instrument-era Hockey Stick chart. You can’t make accurate comparisons of temperatures using bogus data.
Tom,
Find me a record that shows that the Earth has been cooling for a while as rbabcock claims. Otherwise your statement is irrelevant.
It has been cooling for about 5 1.2 years,
Isaak, how long is YOUR record?
Hmmm… if you look at the Barents and Svalbard in just the last 5 years, much evidence of warm water incursion and sharply rising temps.
There is clearly rapid and continued warming in the Arctic, now exceeding what has happened in the past.
Do you have some data proving your words ? Usually you haven’t. 😀
Arctic sea ice extent, thickness and volume all seem unremarkable this year
http://polarportal.dk/en/sea-ice-and-icebergs/sea-ice-extent0/
Finally published:
MISSING DATA: Due to an error at the ground processing station, data from SSMIS sensors on board three DMSP satellites are missing for the period 19-23 February 2021. It is not clear whether this data can be reprocessed. The problem is not due to the Polar Portal. Note that these satellites are very old, the oldest more than 15 years, so it cannot be excluded that further problems occur in the future.
If you try to post evidence to back your assertions, it might mean something, but noooo you post unsupported babble which you do over and over, it is soooo boring to see the same monologue from you.
You claim that it is rapidly warming in the artic is misleading, surely you can post evidence but you seem allergic to that radical idea…..
He is factose intolerant Tommy.
ABSOLUTE AND COMPLETE BS !
Arctic is far COOLER now than for most of the last 10,000 years
STOP your ignorant climate change DENIAL griff,
You are NOTHING but a deliberate and ignorant LIAR !!!
Must have been REALLY WARM in 1922, when Svalbard didn’t even have and SEA in WINTER.
Svalbard last 6 years more sea ice than in 2017,2018, similar to 2016
Thing that really sticks out is the BIG INCREASE in sea ice around Severny Island this year.
griff CAUGHT LYING , as always..
According to MASIE, Barents sea ice extent is…
ABOVE EVERY YEAR BACK TO 2006, except 2007 and 2010.
Much evidence that griff-liar is NOTHING….. but a LYING p.o.s. !!
” …. in the past.”
How far back are you going, griff? Early 1920s? Post Napoleanic wars? Circa Lief Ericson?
Lets have a look further back to 2011
nothing out of the ordinary around Svalbard
more now than 2014, 2016….. just natural variability
Still that big increase this year around Severy Island
Thanks for bring this to our attention griff .. poor muppet waiting for a hand.
If the warming is exceeding what happened in the past, why is there more ice than the past.
Of course griff will make some comment about history starting in 1979.
Can I sell some carbon credits? I’m sure you could use some to improve your social credit and feel superior.
Griff, how long is your record?
Who to believe, Griff or my own eyes⸮
https://www.climate4you.com/images/70-90N%20MonthlyAnomaly%20Since1920.gi
Who to believe, Griff or my own eyes⸮
So many WARMER peaks than now, in the 1930s !!
Backed up by land data
I was wondering why the 1998 NASA temperatures for the past had changed so much in the subsequent years. “Adjustment” Hide the decline and hide the 40’s to 60’s that makes it appear that we are in a catastrophicly logarithmic rise.
“I was wondering why the 1998 NASA temperatures for the past had changed so much in the subsequent years.”
Here’s why: The Data Manipulators demoted and cooled 1998, so that they could claim that every successive year in the 21st Century was the “hottest year evah!”
But as you can see below in the UAH satellite chart, none of the years subsequent to 1998, are warmer than 1998, except for 2016 and 2020 which are both statistically tied with 1998 for being the warmest temperatures of recent times (measurement error is 0.1C).
https://en.wikipedia.org/wiki/Instrumental_temperature_record
“Warmest years
NOAA graph of global annual temperature anomalies, 1950–2012
In January 2017, several scientific agencies around the world, including NASA and the NOAA in the United States[10][11] and the Met Office in the United Kingdom, named 2016 the warmest year recorded.[12][13] This marked the third consecutive year reaching a new record temperature, the first time since the current warming trend began in the 1970s that three years in a row were record highs.[11] 2016’s record meant that 16 of the 17 warmest years have occurred since 2000,[11] 2017 being the third-hottest year on record meant that 17 of the last 18 warmest years have occurred since 2000.”
end excerpt
UAH chart:
As you can see, none of the years between 1998 and 2016 can be described as the “hottest year evah!” going by the UAH satellite chart (the only honest data around).
So NASA and NOAA are flat-out lying about “hottest year evah!”. It’s all propaganda aimed at promoting the Human-caused Climate Change scam.
Wow! Lots of tasty, meaty goodness to chew on so early on Saturday morning; I better make extra strong coffee to go with!
To the Mark 1 eyeball the NAO graph appears to have two major components; one long, one short, that amplify and cancel each other as they go in and out of phase. I would love to hear any learned explanations for what they are if I am not totally out to sea!
Also, could someone define an Sv for me. I assume it is a unit of volume but could not find a definition so far!
The evidence builds more and more that our climate is controlled by the sun through the mechanisms of our great ocean circulation systems that react slowly but inexorably to any changes! The folly of wasting money trying to mitigate rising temperatures when so much more important work needs funding would be laughable if it weren’t so tragic for humanity! We are on a conveyor belt that is carrying us into a deep freeze and we have various idiots and imbeciles complaining about a gust of warm air!
What do you think about this theory? https://plateclimatology.com
First off, there’s no evidence that plate tectonics have sped up.
Secondly, twice nothing is still nothing.
Sv = Sverdrup = 1,000,000 m3/s.
Thank you, Rick!
How increasing CO2 leads to an increased negative greenhouse effect in Antarctica
CO2is the strongest anthropogenic forcing agent for climate change since preindustrial times.Like other greenhouse gases, CO2 absorbs terrestrial surface radiation and causes emission from the atmosphere to space. As the surface is generally warmer than the atmosphere, the total long‐wave emission to space is commonly less than the surface emission. However, this does not hold true for the high elevated areas of central Antarctica. For this region, the emission to space is higher than the surface emission; and the greenhouse effect of CO2 is around zero or even negative, which has not been discussed so far. We investigated this in detail and show that for central Antarctica an increase in CO2 concentration leads to an increased long‐wave energy loss to space, which cools the Earth‐atmosphere system. These findings for central Antarctica are in contrast to the general warming effect of increasing CO2.
Antarctic snow covered regions (most of it) are whiter than cloud.
This results in the anomalous situation that albedo is decreased, not increased, by cloud cover.
Thanks!
OMG!
That’s way too much to digest at one sitting. It should have been broken up into about ten stories.
I am reminded of a quote apologizing for a long letter which, on investigation uncovered this:
Quote Investigator.
The graph of “GHCN 120 years of contiguous US temperature data” indicates 294 stations reporting data starting at around 1840.
Were there really 294 official weather stations in 1840? There was no official weather bureau.
There were no standard, calibrated thermometers and no trained weatherpersons. How were accurate highs and lows recorded?
As far as I can find out, the US had no official Weather bureau until the 1870s or 1880s. Taking this into consideration and removing the pre-1880 data, we find that the temperature anomaly between 1880 and 2020 is flat or possibly in a slight cooling trend.
Excellent article, thanks.
The most important story IMHO is the cooling of the Southern hemisphere including the persistent cold SST anomaly that has persisted all around Antarctica for practically the entire duration of the satellite record. Thermohaline circulation in the Atlantic – all of it, north and south, drives south to north heat piracy.
https://ptolemy2.wordpress.com/2020/09/12/widespread-signals-of-southern-hemisphere-ocean-cooling-as-well-as-the-amoc/
recent Artic heating is a theory yet to be unverified with instruments … what some would call a myth or a conspiracy theory …
There was a spike at the 2015 El Nino big blob event, but that has been gradually dissipating.
Before that, no warming this century
Other jump was between 1995 and 1999, other major El Nino.
before that , the Arctic was actually COOLING
There’s a sarcastic saying about Newspapers that goes like this “Except for those incidents about which you have personal knowledge, everything you read in the Newspapers is absolutely true and accurate”. You could modify that to apply to temperature records. “Except for those temperature records that are very old and far from the urban heat island effect, atmospheric warming is happening at an alarming rate”.
Michael Crichton called it the Gell-Mann Amnesia Effect.
“Briefly stated, the Gell-Mann Amnesia effect is as follows. You open the newspaper to an article on some subject you know well. In Murray’s case, physics. In mine, show business. You read the article and see the journalist has absolutely no understanding of either the facts or the issues. Often, the article is so wrong it actually presents the story backward—reversing cause and effect. I call these the “wet streets cause rain” stories. Paper’s full of them.
In any case, you read with exasperation or amusement the multiple errors in a story, and then turn the page to national or international affairs, and read as if the rest of the newspaper was somehow more accurate about Palestine than the baloney you just read. You turn the page, and forget what you know.”
Wow. Having read it once and adsorbed no more than 10%, this is the best explanation I have ever read of why the CO2 hysteria is utterly unfounded. I will read it several more times and try to get above 10%.
DHR “Having absorbed 10%….”
Boasting again ! :=) I’ve read it twice and I’m still in single digits.
Seriously, it would have been better with a summary, with numbered diagrams, and with section headings. Notwithstanding, it’s an impressive article – just too difficult for me to find anything to question (other than the definition of Sv units)
Wow! How long before this guy gets cancelled?
He is approaching a ton – may not need to be cancelled. I expect has already been replaced by someone sucking on the IPCC teat.
Great post, although it will take multiple reads to sort out all of the many details.
“On the contrary, it makes perfectly clear that, on the coasts of the Arctic Ocean, the end of the century was no warmer than during the 1940s; “
I’m guessing that this means the end of the twentieth century. Since it follows lengthy sections about the nineteenth century, I’m not completely sure.
This shouldn’t be a surprise. The arctic is impacted by ocean temperatures. More solar radiation reaching the oceans, the warmer they will be. ?w=1110&h=202
Antarctica isn’t impacted as much by ocean temperatures, and if you look at it and other deserts, both hot and cold, you will find no warming. Deserts are natural controls for the UHI and Water Vapor.
Amundsen Scott (90.0S, 0.0000E) ID:AYW00090001 https://data.giss.nasa.gov/cgi-bin/gistemp/stdata_show_v4.cgi?id=AYW00090001&dt=1&ds=14 Halley (75.45S, 26.217W) ID:AYM00089022 https://data.giss.nasa.gov/cgi-bin/gistemp/stdata_show_v4.cgi?id=AYM00089022&dt=1&ds=14 Sanae Saf Base (70.3S, 2.35W) ID:AYM00089001 https://data.giss.nasa.gov/cgi-bin/gistemp/stdata_show_v4.cgi?id=AYM00089001&dt=1&ds=14 Mawson (67.6S, 62.8670E) ID:AYM00089564 https://data.giss.nasa.gov/cgi-bin/gistemp/stdata_show_v4.cgi?id=AYM00089564&dt=1&ds=14 Davis (68.583S, 77.9500E) ID:AYM00089571 https://data.giss.nasa.gov/cgi-bin/gistemp/stdata_show_v4.cgi?id=AYM00089571&dt=1&ds=14 Mirnyj (66.55S, 93.0170E) ID:AYM00089592 https://data.giss.nasa.gov/cgi-bin/gistemp/stdata_show_v4.cgi?id=AYM00089592&dt=1&ds=14 Casey (66.283S, 110.5170E) ID:AYM00089611 https://data.giss.nasa.gov/cgi-bin/gistemp/stdata_show_v4.cgi?id=AYM00089611&dt=1&ds=14 Dumont D’Urville (66.667S, 140.0170E) ID:AYM00089642 https://data.giss.nasa.gov/cgi-bin/gistemp/stdata_show_v4.cgi?id=AYM00089642&dt=1&ds=14 Isla De Pascua East (67.17S, 109.43W) ID:XXXLT848602 https://data.giss.nasa.gov/cgi-bin/gistemp/stdata_show_v4.cgi?id=XXXLT848602&dt=1&ds=14 Rothera (67.567S, 68.117W) ID:AYM00089062 https://data.giss.nasa.gov/cgi-bin/gistemp/stdata_show_v4.cgi?id=AYM00089062&dt=1&ds=14 Vernadsky (65.25S, 64.267W) ID:AYM00089063 https://data.giss.nasa.gov/cgi-bin/gistemp/stdata_show_v4.cgi?id=AYM00089063&dt=1&ds=14
“In any event, a stubborn positive state of the NAO characterized the final decades of the 20th century, associated with a strong pressure difference between the high and low pressure cells reduced ice coverage in the eastern Arctic significantly.”
It was the negative NAO in 1993 and 1995-1999 which was also driving the AMO warming which significantly reduced the sea ice. Negative NAO increases warm humidity events and cyclones into the Arctic, like in summers 2007 and 2012. Negative NAO is also directly associated with slower trade winds, and there is a positive feedback from El Nino episodes to major AMO warm pulses with around an 8 month lag.
https://www.cpc.ncep.noaa.gov/products/precip/CWlink/pna/month_nao_index.shtml
“the station was moved in 1954 from the small offshore Winter Island to Galindez, closer to the coast”
WR: Winter Island, Antarctica, and Galindez can both be found on Google Maps. Connecting Winter island (as indicated on the map) with the research station on Galindez shows that the distance between the two isn’t much: about 600 meters. But, switching the map to ‘satellite’ reveals that the new research station (Vernadsky research base) is (at the moment of picturing) surrounded on three sides by open water, while Winter island shows much more sea-ice around. Ice or water makes a big difference in temperatures. Higher and less variable, as shown in the graphic.
https://www.google.nl/maps/place/Winter+Island/@-65.2471243,-64.2620535,408m/data=!3m1!1e3!4m5!3m4!1s0xbb807e40ec7dc42d:0xf94a118ee1f8032a!8m2!3d-65.2499998!4d-64.2666669
An excellent article!
Since the Arctic Ocean is mostly surrounded by land, but has a wide stretch of open water between Greenland and Norway, sea ice cover can be greatly influenced by fluctuations in the Atlantic Ocean, whose water can flow freely into the Arctic, particularly around Scandinavia. Also, since most of the land surrounding the Arctic Ocean (except Greenland) is not permanently glaciated, that land has a low heat capacity and low albedo, which can warm rapidly in spring and summer, and induce melting along the Arctic coasts.
For the CAGW alarmists, sea level rise seems to be the main concern, but changes in Arctic sea ice cover would not affect sea levels. Ice floating on the Arctic Ocean displaces its weight in water, so that even if the Arctic Ocean became totally ice-free one summer, that would not change sea levels elsewhere in the world.
The article also mentioned a Circumpolar current in the Arctic, probably the Gulf Stream flowing eastward north of Scandinavia (with an eddy to the east side of Scandinavia), then eastward along the Russian coast, then north of Alaska, and then north of the Canadian archipelago. This water is gradually cooled as it flows eastward in polar waters, so that ice breakup in spring is progressively later. The last stop in this current would be the Labrador Straits (between Labrador and Baffin Island) where the now-cold water would flow southeast toward Newfoundland.
The ice cap on Greenland is largely isolated from this warm current, except for the extreme southern tip, and the high altitudes of most of the Greenland ice cap ensure that summer temperatures remain well below freezing (similar to Antarctica). Long-term weather measurements along the Greenland coasts show that the east coast receives much more snowfall than the west coast, likely from storms that form off the coast and move northward, pushing humid air off the North Atlantic into the cold air mass over Greenland, similar to the nor’easters that form off the coast of New England in winter. With high snowfall rates along the east coast, the ice cap of Greenland is unlikely to melt.
One of the best points made in the article is that Antarctica is climatically isolated from the rest of the world by the permanent westerly winds in the Southern Ocean, which prevent warmer water from being transported to the shores of Antarctica. The Antarctic ice cap won’t be melting anytime soon, and as it is the largest ice mass in the world, we have little to fear from rising sea levels.