


Demographics show increase in Eastern student diversity
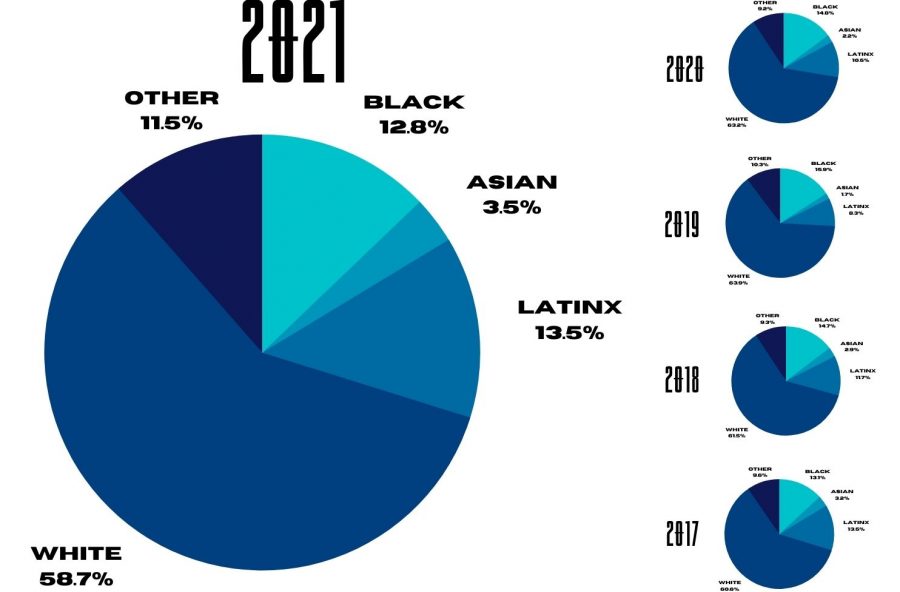
Demographics of Eastern’s student body from 2017 to 2021 show that Eastern’s student body is becoming more diverse. Other represents the categories of American Indian, Alaska Native, Native Hawaiian, Pacific Islander, two or more races, international students and students who did not disclose their race.
October 27, 2021
Eastern students are more diverse than ever with 41.3% of students being people of color.
Twenty years ago, Eastern’s student body was 87 percent white. Today, it is 58.7% white.
In 2001, there were 25 Native American students, 697 Black students, 83 Asian/Pacific Islander, 206 Latinx students, 9,162 white students and 145 international students.
In 2011, there were 33 Native American/Alaska Native students, 1,504 Black students, 96 Asian students, 379 Latinx students, 112 students who identified with two or more races, five Native Hawaiian/Pacific Islander students, 8,410 white students, 149 international students and 490 unclassified students.
Now, as reported for the Fall 2021 semester, there are 10 Native American/Alaska Native students, 1,106 Black students, 300 Asian students, 1,161 Latinx students, 184 students who identified with two or more races, seven Native Hawaiian/Pacific Islander students, 5,045 white students, 399 international students and 387 unclassified students.
Females continue to make hold a majority at Eastern following a 58.3% majority in 2001 and a 59.2% majority in 2011. In 2021, nearly 60 percent of Eastern students are females.
Data is unavailable for 2021, however, 2020 data shows that Eastern’s faculty are becoming increasingly more diverse.
In 2001, four faculty members were Native American, 15 were Black, 24 were Asian or Pacific Islander, 13 were Latinx, 531 were white and 52 were unclassified. White faculty members were the majority with 83.1% of faculty members being white.
In the same year, males made up the majority of faculty members with 365 male faculty members and 274 female faculty members. There were 138 male professors compared to 71 female professors, 86 male associate professors compared to 44 female associate professors, 80 male assistant professors compared to 57 female assistant professors, 60 male instructors compared to 98 female instructors and one male lecturer compared to three female lecturers.
In 2011, three faculty members were Native American, 30 were Black, 38 were Asian, 18 were Latinx, 634 were white, nine were international and nine were unclassified. White faculty members were the majority with 85.6% of faculty members being white.
In the same year, males made up the majority of faculty members with 377 male faculty members and 364 female faculty members. There were 104 male professors compared to 69 female professors, 70 male associate professors compared to 51 female associate professors, 73 male assistant professors compared to 62 female assistant professors and 130 male instructors compared to 182 female instructors.
In 2020, two faculty members were Native American, 23 were Black, 30 were Asian, six were Latinx, 412 were white, 14 were international and 27 were unclassified. White faculty members were the majority with 80.2% of faculty members being white.
In 2020, the majority changed with 268 female faculty members and 246 male faculty workers. Last year, there were 78 male professors compared to 62 female professors, 40 male associate professors compared to 31 female associate professors, 24 male assistant professors compared to 32 female assistant professors and 104 male instructors compared to 143 female instructors.
According to educationdata.org, nationwide, 55.2% of college students are white, 19.5% are Latinx, 9.6% are Black, seven percent are Asian, three percent are Pacific Islander, 3.9% are two or more races and 0.7% are Native Americans.
According to the National Student Clearinghouse, a nonprofit research group, during the 2020-2021 academic year, 59.5% of college students were females.
Corryn Brock can be reached at 581-2812 or at [email protected].