Scientists publishing in GRL once again affirm that in recent decades the dominant mechanism driving surface melt for the Greenland ice sheet has been downwelling shortwave radiation modulated by clearer skies (fewer clouds) and natural wind pattern changes.
Greenland’s ice melt has not been driven by “longwave heating” from greenhouse gases in the last decades – even though this has been the “prevailing hypothesis” in climate models (Wang et al., 2021).
“The day-to-day variability of normal-rate melt events is dominated by sensible heat exchange (31%) and shortwave radiation (28%). They are likely caused by katabatic winds, a gravity-driven downslope wind that can be forceful and often associated with clear skies.
“With katabatic winds occurring during clear skies, they coincide with periods of increased shortwave radiation.”
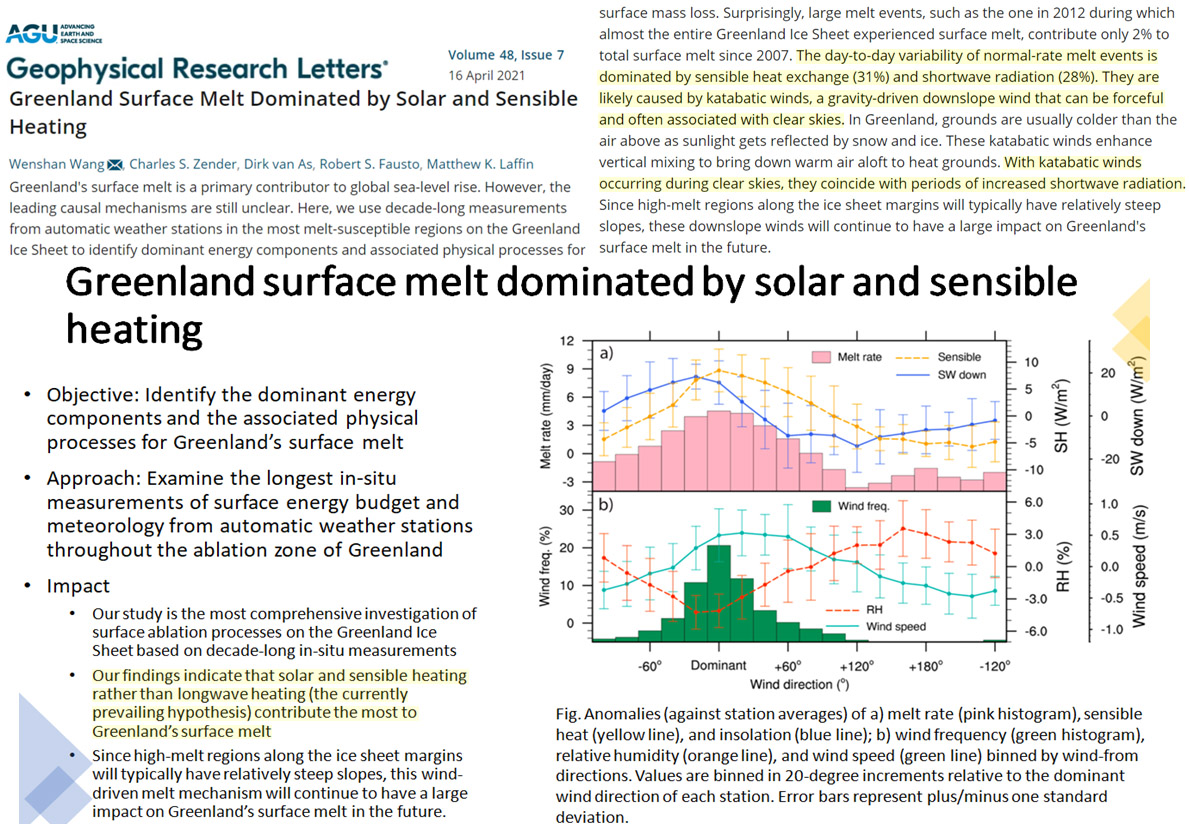
Image Source: Wang et al., 2021
A 2020 study (Hahn et al.) also concluded reduced cloud cover from 1994-2017 led to enhanced shortwave radiation (+7.3 W/m²) and drove the warming from the 1990s to mid-2000s. This shortwave cloud forcing trend is what “dominates” the melt signal for Greenland.
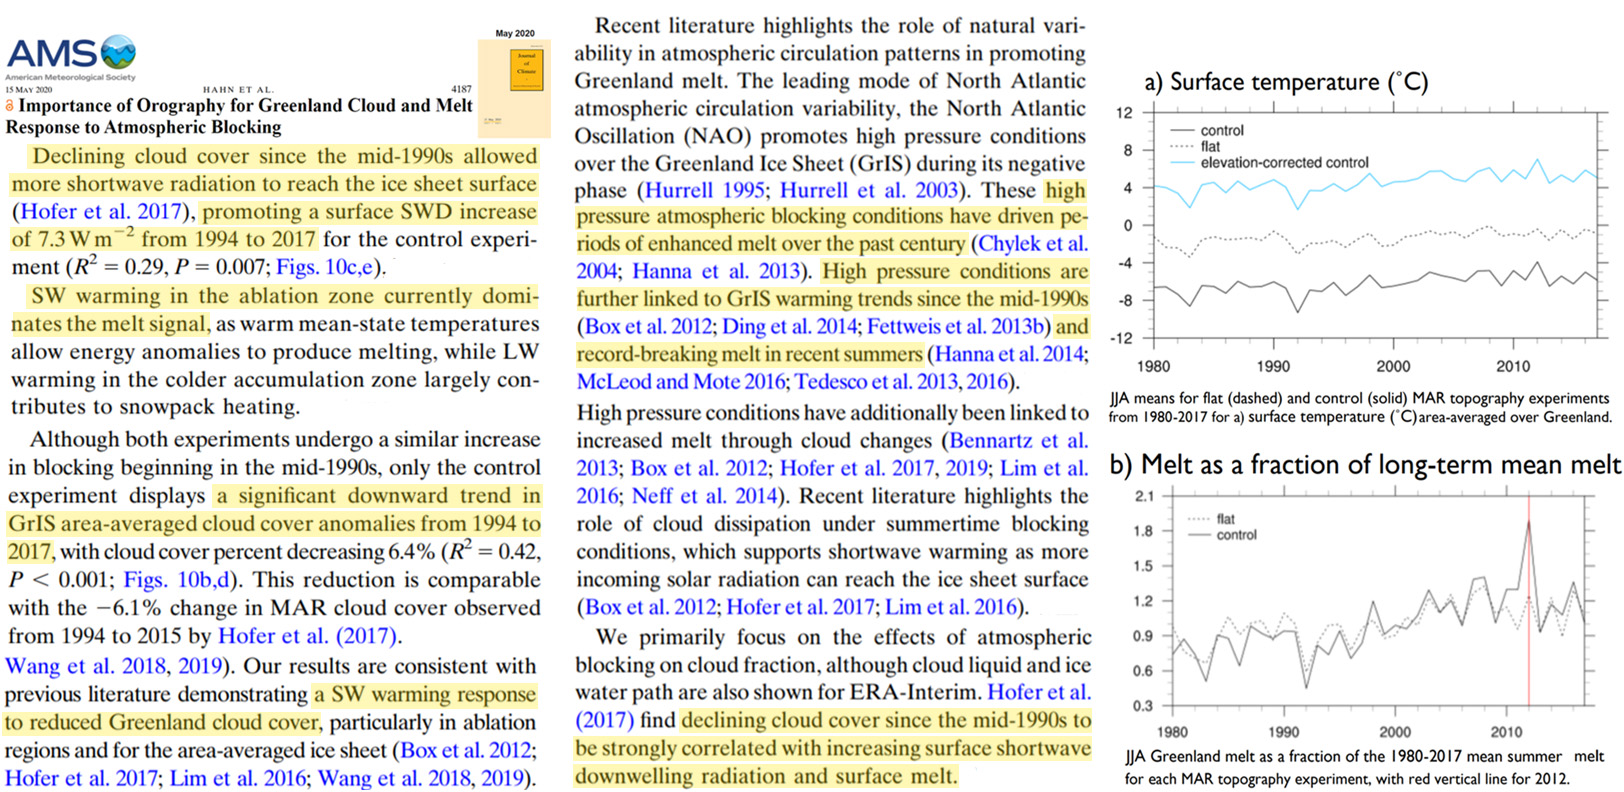
Image Source: Hahn et al., 2020
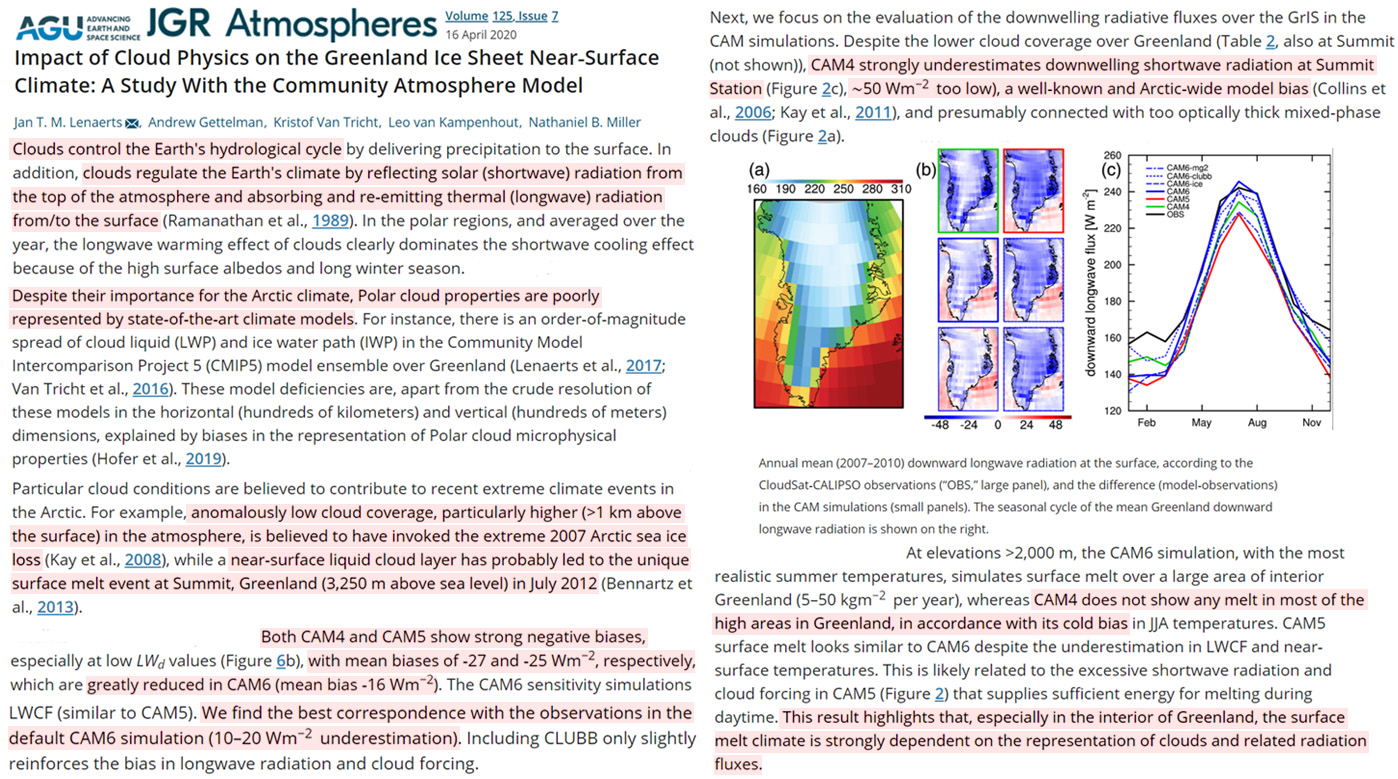
Another 2020 study (Lenaerts et al.) also affirms clouds “control the Earth’s hydrological cycle”, “regulate the Earth’s climate”, and, as mentioned above, drive polar ice melt.


All because of weaker solar wind states since 1995 causing an increase in negative NAO conditions and driving a warmer AMO.
The regional low cloud cover changes are a decrease in cloud cover over Arctic land masses, and an increase in cloud cover over the Arctic Ocean.
The same post 1995 increase in sunshine hours can be seen in the UK, annual:
https://www.metoffice.gov.uk/pub/data/weather/uk/climate/actualmonthly/17/Sunshine/UK.gif
but not in summer:
https://www.metoffice.gov.uk/pub/data/weather/uk/climate/actualmonthly/14/Sunshine/UK.gif
Newsflash: Relevant to the GHG Effect, CO2 only absorbs LWIR between 13 and 18 Microns. That is a 100% Physical Certainty identified in every gas absorption spectrometry graphic. No scientist will deny that. Simply go to a BlackBody Calculator, one can be found at SpertralCalc. What you will find is that 13 to 18 Micron, Peak 15 Micron, is associated with a blackbody of -80C. Ice emits higher energy LWIR peak 10.5 to 11 Micron. This is all proven by any BlackBody Calculator. LWIR of 13 to 18 Micron, Peak 15 Micron won’t warm water or melt ice. The quantum physics of a CO2 molecule simply doesn’t support CO2 causing warming.
Oldie but goodie
Bill Gray set’s the warmists straight.
https://m.youtube.com/watch?v=BzlSUU3nihE