


S&P 500, HANG SENG INDEX, ASX 200 INDEX OUTLOOK:
- Dow Jones, S&P 500 and Nasdaq 100 closed +0.83%, +0.82%, and +0.78% respectively
- Around 86% of S&P 500 companies have beaten earnings estimates so far this season
- Traders now eye the ECBs interest rate decision, US jobless claims. Japanese markets are shut for a holiday

Wall Street Rally, Earnings, Crude Oil, ECB, Asia-Pacific at the Open:
Wall Street stocks rebounded for a second day as investors shrugged off viral concerns and cheered strong US corporate earnings. 57 out of 66(around 86%) S&P 500 companies have beaten analysts’ forecasts so far, marking a strong start of the reporting season. Share prices of Verizon Communications and Coca-Cola rose after results were released.
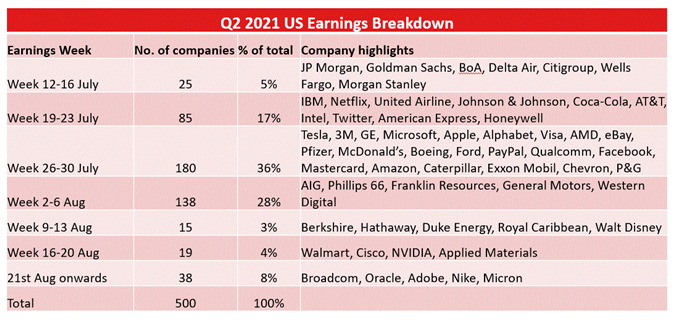
The peak in earnings news-flow will arrive next week, with most of the FAANG companies facing perhaps a “reality check” after an astonishing rally this year. According to Factset, the blended earnings growth rate for the S&P 500 is 69.3% YoY, which will mark the highest level seen since 2009. This is attributed to both an economic rebound and a low base in the previous year. High expectations rendered the tech firms susceptible to a pullback if they miss the estimates.
Source: Bloomberg, DailyFX
Crude oil prices surged over 4% overnight, lifting performance for the energy sector. This reflects revitalized hopes for growing energy demand despite data showing an unexpected rise in US oil inventories last week. Traders are perhaps taking the recent price drop as an opportunity to buy the dip after OPEC+ finally struck a deal to increase output. Rising oil prices may be a positive signal for APAC stocks.
Looking ahead, the ECB interest rate decision and press conference headline today’s economic docket alongside US weekly initial jobless claims data. Find out more from the DailyFX economic calendar.
Asia-Pacific markets look set to trade higher on Thursday. Futures in mainland China, Australia, Hong Kong, Taiwan, Singapore, India and Thailand are in the green, whereas those in South Korea and Malaysia are in the red. Japanese markets are closed for a public holiday.
Hong Kong’s Hang Seng Index (HSI) looks set to cease a three-day slide and rebound. The index lost 2.67% so far this week amid a renewed wave of selling from mainland investors. Some HK$ 3.65 billion net southbound outflows were registered on Wednesday, following Tuesday’s HK$ 4.69 billion (chart below). So far this month, mainland investors have sold HK$ 28.6 billion worth of Hong Kong stocks, reflecting weakening appetite as Beijing tightened regulatory curbs on large tech firms. Near-term sentiment for the HSI may be tilted to the downside.
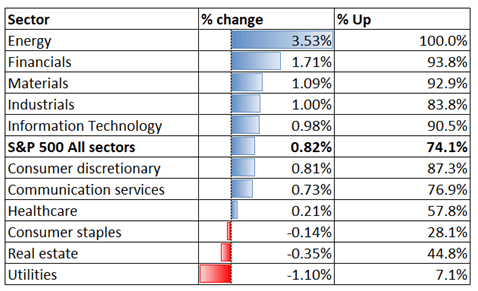
Looking back to Wednesday’s close, 8 out of 11 S&P 500 sectors ended higher, with 74.1% of the index’s constituents closing in the green. Energy (+3.53%), financials (+1.71%) and materials (+1.09%) were among the best performers, whereas utilities (-1.10%) lagged behind.
S&P 500 Sector Performance 21-07-2021
Source: Bloomberg, DailyFX

S&P 500 IndexTechnical Analysis
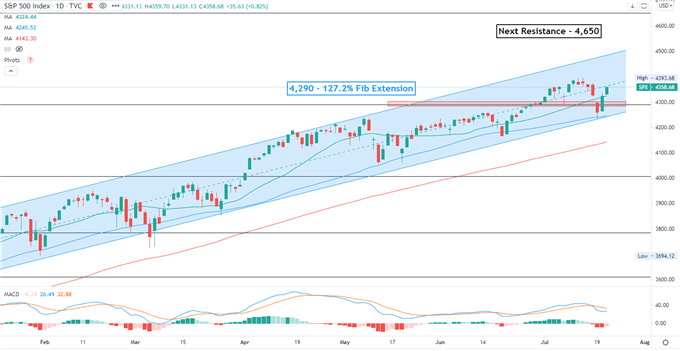
The S&P 500 index tested an immediate support level at 4,290 and rebounded, continuing its upward trajectory. The next key resistance level can be found at 4,650 – the 161.8% Fibonacci extension. The overall trend remains bullish-biased as prices continue to trend higher within a “Ascending Channel” formed since November.
S&P 500 Index– Daily Chart
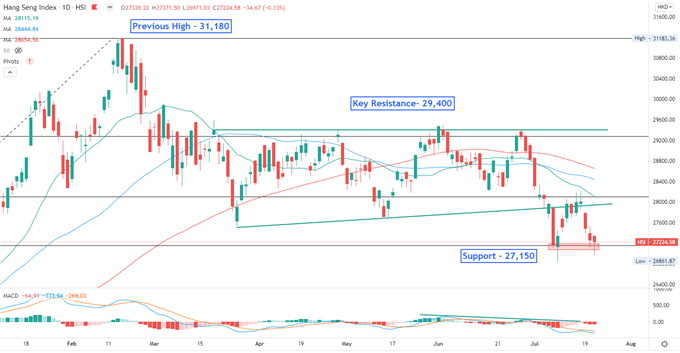
Hang Seng Index Technical Analysis:
The Hang Seng Index looks set to rebound from an immediate support level at 27,150, potentially forming a “Double Bottom” chart pattern. The overall trend remains bearish-biased however, as the SMA lines have formed a “Death Cross” and trended lower. The MACD indicator has dived below the neutral line, suggesting that the index may be under near-term selling pressure.
Hang Seng Index – Daily Chart
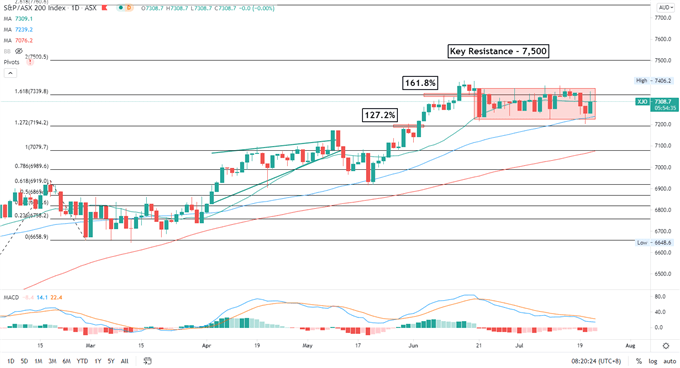
ASX 200 Index Technical Analysis:
The ASX 200 index is trading in a tight range between 7,230-7,370, waiting for fresh catalysts for a breakout. The overall trend remains bullish-biased, as suggested by the consecutive higher highs and higher lows formed over the past few months. A major resistance level can be found at around 7,500. The MACD indicator is trended lower, suggesting prices may continue to range bound in the near term.
ASX 200 Index – Daily Chart

--- Written by Margaret Yang, Strategist for DailyFX.com
To contact Margaret, use the Comments section below or @margaretyjy on Twitter


