Last week we discussed a new study exploring the puzzle that over the past two decades the sun didn’t get any brighter, but more sunlight (shortwave radiation or SW) has been absorbed at the Earth’s surface. The likely explanation is that cloud cover variations are allowing more sunlight through. Once this effect is taken into account, there is little role left for changing greenhouse gas concentrations. Further evidence on this point is found in another new study by Dübal and Vahrenholt which compared radiation trends in clear sky regions versus cloudy regions of the planet. In cloudy regions the SW absorption rose sharply, leading the authors to conclude that clouds became more permeable to sunlight over this interval. That phenomenon, not greenhouse gases, was the main cause of the warming. Which is awkward not only because of the chorus of voices saying all GHGs all the time, but also because it’s very hard to see how to tax cloud permeability.
Authors Hans-Rolf Dübal and Fritz Vahrenholt checked the SW and long wave (LW) radiation flows into and out of the atmosphere, as measured by satellite, and found that in clear-sky regions additional LW absorption seemed to be influenced by rising GHG levels. But the relationship vanished in cloudy areas, which account for about 2/3 of the Earth’s total surface area (land and sea). Here clouds dominate the radiation absorption and whatever additional energy they absorb does not get transmitted down to the surface. Thus overall they found the warming from 2000 to 2019 mainly explained by increased permeability of clouds to solar radiation. This permeability can be due to thinning or other changes in the nature of clouds. But it is not a prediction of climate models in response to increased GHGs.
The discovery prompted the authors to look for data going farther back, and they found earlier satellite records of cloudiness going back to 1980. In this chart they show the cloudiness record (blue line) and outgoing LW radiation (orange line), a measure of how much heat the atmosphere is expelling to space.
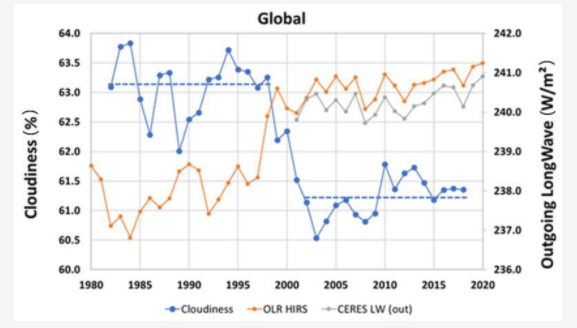
The cloudiness measure dropped dramatically between 1998 and 2003, and has stayed low ever since. The authors comment “The cloud window that opened around the year 2000 has certainly fostered the heating.” But why did it open? And what might it do in the future?
Dübal and Vahrenholt posit a connection with large-scale ocean circulation systems like the Atlantic Multidecadal Oscillation. And they say it’s too soon to draw conclusions about what will happen in the coming years. But if clouds changed in one way 20 years ago, they could change back any time. And if change in cloud cover, not greenhouse gases, drove early 21st century warming, and greenhouse gases do not explain the change in cloud cover, we could well observe a reversal of the warming.

")
