We wrote earlier in the week about Ofqual’s A-level equalities report. Today it’s the turn of GCSEs.
To recap, the aim was to address the question of whether 2021’s grading process has impacted more on some groups of students than others. To do this, they looked at how gaps in outcomes have changed over the past few years.
The models they used took into account the differences in pupils’ other characteristics (for example, when they looked at gaps for disadvantaged pupils, they took into account their prior attainment too). They also accounted for the nested structure of the data, with grades clustered within pupils and pupils within centres.
For GCSEs, the metrics they used to track these changes were: average grade, proportion of entries awarded at least a grade 7, and proportion of entries awarded at least a grade 4.
They define as “notable” any gaps which have grown or shrunk by more than we’d expect in a normal year, and by at least a tenth of a grade for the average grade measure or at least one percentage point for the two proportion of entries measures.
Here’s a summary of what they found (full report here).
FFT 2021 Secondary Results Service
Aspire schools can access a full national analysis of this year’s KS4 and KS5 results as well as future KS5 estimates for Y12 students. Simply upload your grades to Aspire before 3 September.
Not an FFT Aspire user?
Subscribe now
By pupil group
As was the case in the A-level report, there haven’t been too many “notable” changes in gaps and, where there have, they’re generally small.
That said, some of the changes that have been highlighted, make for uncomfortable reading.
Pupils who were eligible for free school meals (FSM) fell another 0.12 grades behind peers with the same prior attainment between 2019 and 2021. The gap also widened at both grade 7 and above, and at grade 4 above: by 2.3 and 1.3 percentage points, respectively.
Those from a Gypsy/Roma background were already over a grade behind white British pupils in 2019. Between 2019 and 2021, this gap widened by another 0.17 grades. At grade 7 and above, the gap widened by 2.3 percentage points, and at grade 4 and above, by 6.3 percentage points.

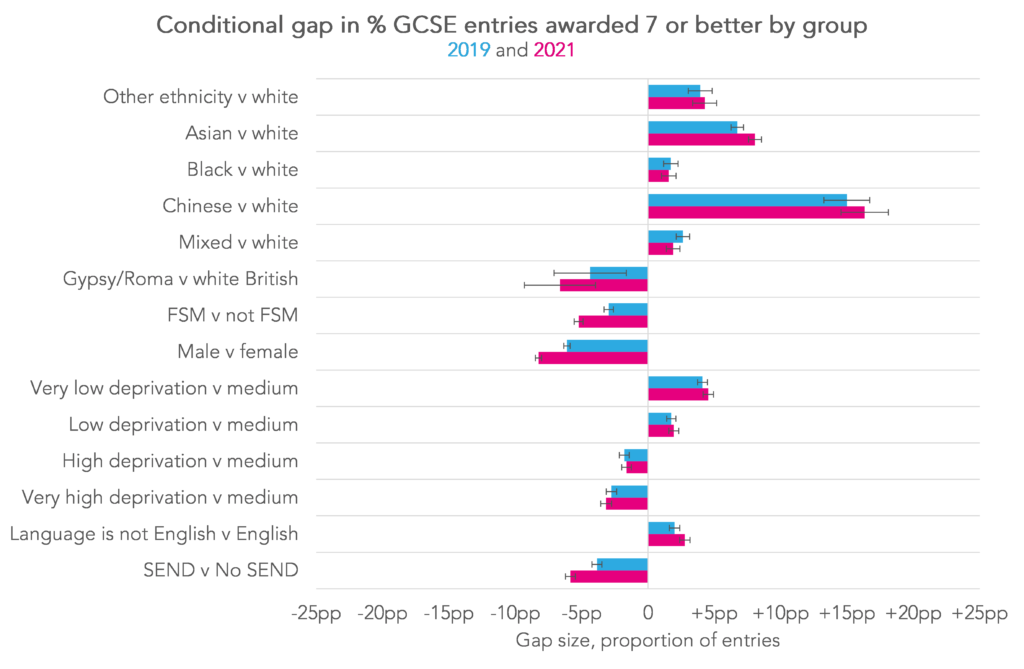
For boys, who historically underperform relative to girls, there has been no change in the average grade gap between 2019 and 2021. The gap at grade 7 and above has increased by 2.1 percentage points, but at grade 4 and above it’s narrowed by 2.6 percentage points. (Again, remember we’re talking about gaps between boys and girls with the same prior attainment).
This seems contradictory, but it’s actually what you’d expect because boys are bunched lower in the grade distribution than girls. So even if boys and girls saw their grades change by exactly the same amount, boys would make gains at the middle of the grade distribution, and girls at the top.
By centre type and region
We saw earlier in the week that independent schools had made larger gains at A-level than those with the same prior attainment in academies. This is true at GCSE too.
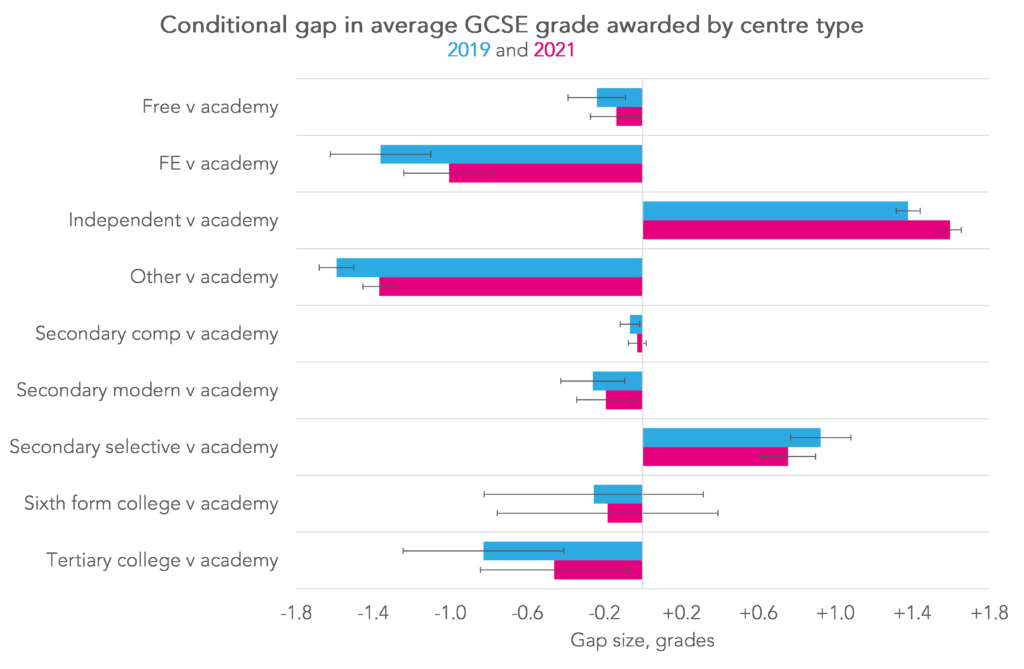
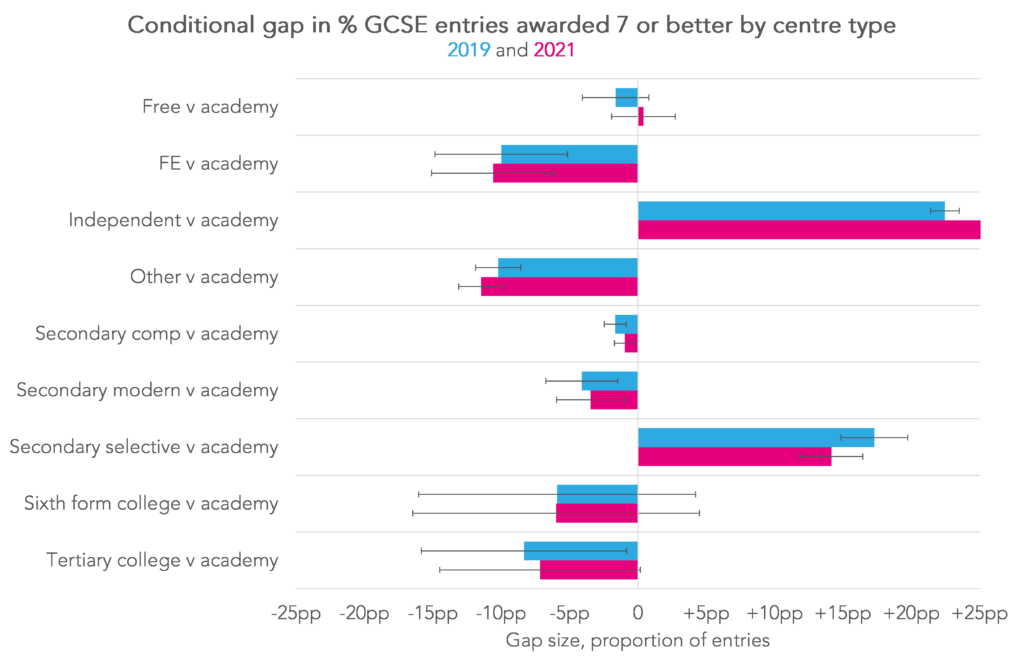
The gap between independent schools and academies has widened by 0.22 grades since 2019 and by 6.8 percentage points at grade 7 and above.
Also mirroring trends at A-level, the gap indicating better outcomes in selective schools compared with academies shrunk, this time by 0.17 grades, and around 3 percentage points at both grade 7 and above and at grade 4 and above.
There were “notable” results too for free schools, and for FE and tertiary colleges, all of whom narrowed the gap between themselves and academies between 2019 and 2021. (Outcomes were only slightly lower in free schools than in academies, and there are relatively few GCSE candidates from FE and tertiary colleges.)
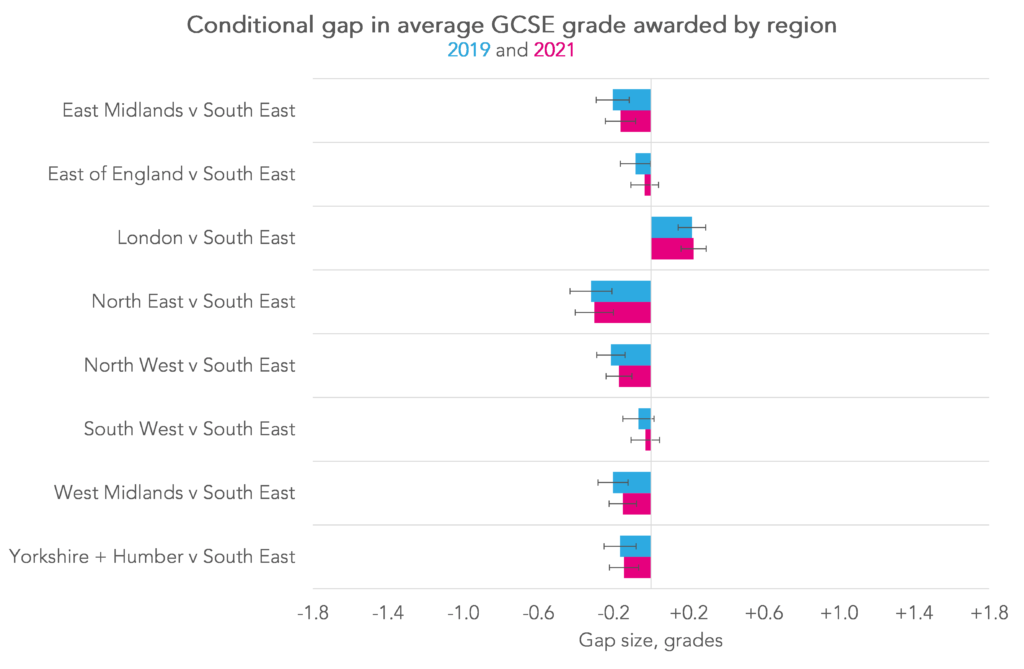
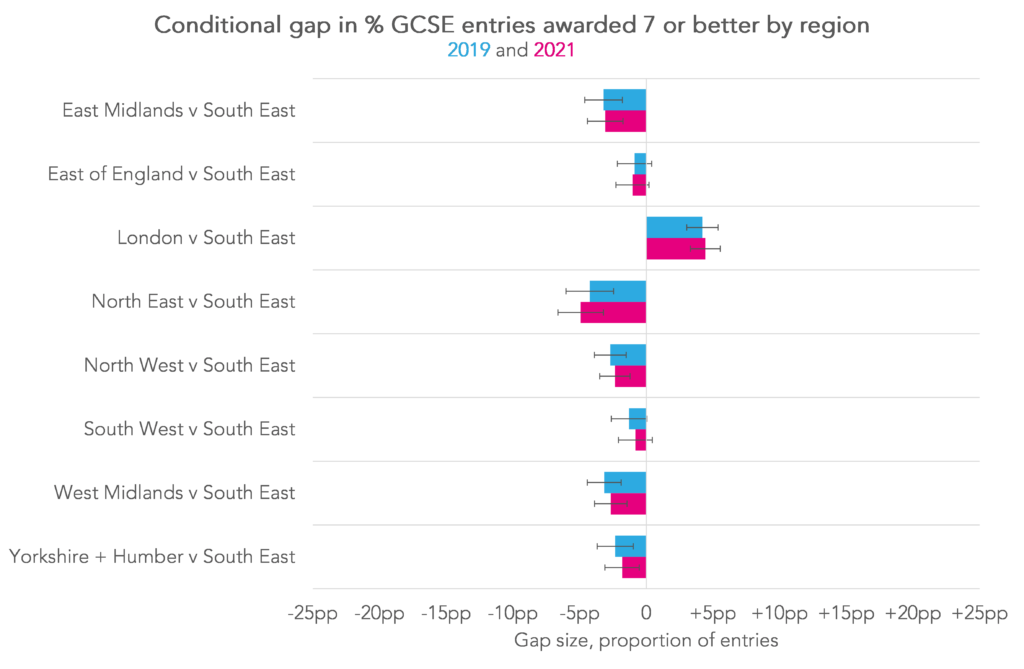
In the regions, there were no “notable” changes in gaps in average grades or in the proportion of grades awarded at least a 7, with higher outcomes for pupils in London and the South East persisting (though, on a positive note, not getting any wider.)
Summing up
We’ve seen results improve for all groups of students since 2019, the last time public exams were taken. Ofqual’s report concludes that, on the whole, these improvements have been shared out pretty evenly.
However, the areas where disproportionate impacts have been identified are concerning. Pupils eligible for FSM and those from a Gypsy/Roma background have fallen further behind, and those in independent schools have pulled further ahead.
The cause of this, whether due to the change in grading process or the uneven impact of the pandemic, is not something we’ll get an answer to anytime soon.
We will need to wait until the DfE produce their statistical first release on Key Stage 4 attainment to know what the effect of this year’s process has been on the official disadvantage gap. Although the Ofqual data is useful, the data and methodology they have used are not equivalent to those used by DfE.
Sign up to receive our blogposts by email to make sure you don’t miss any coverage.
And don’t forget to visit our dedicated results day microsite for more on the trends in entries and results by subject.

Leave A Comment