
Guest essay by Eric Worrall
Admitting some cloud error is as close as most climate modellers come to admitting their projections are not fit for purpose. Note the image above is from Pat Frank’s paper about cloud error, not Paulo Ceppi and Ric Williams’ paper. More below.
Why clouds are the missing piece in the climate change puzzle
September 11, 2020 8.01pm AEST
Paulo Ceppi Lecturer in Climate Science, Imperial College London
Ric Williams Professor of Ocean Sciences, University of LiverpoolHow much our world will warm this century depends on the actions we take in coming decades. In order to keep global temperature rise below 1.5°C and avoid dangerous levels of warming, governments need to know how much carbon they can emit, and over what timeframe.
But current climate models don’t agree on where that threshold lies. In new research, we discovered one of the reasons why there is such a large range of estimates for how much carbon can be safely emitted: the uncertain behaviour of clouds. In some climate models, clouds strongly amplify warming. In others, they have a neutral effect or even dampen warming slightly. So why are clouds likely to play such a pivotal role in deciding our fate?
…
Clouds can act like a parasol, cooling the Earth by reflecting sunlight away from the planet’s surface and back into space. But they can also act like an insulating blanket, warming the Earth by preventing some of the heat in our atmosphere from escaping into space as infrared radiation. This “blanket” effect is particularly noticeable during the winter, when cloudy nights are typically much warmer than cloud-free ones.
…
While we do know that clouds will likely amplify global warming, there is still a great deal of uncertainty about how strong this effect will be. Here climate models are of little help, as they can only simulate the bulk properties of the atmosphere over scales of tens of kilometres and several hours. Tiny cloud droplets form and evaporate in minutes. Models miss these small-scale details, but they’re needed for accurate predictions.
Climate models have to resort to simplifications in order to represent clouds, which introduces error. As different models make different simplifications in their portrayal of cloud processes, they also make different predictions of the cloud feedback, which results in a range of global warming projections and differences in our remaining carbon budget. For a given future carbon emissions scenario, clouds are the single most important factor behind the differences in future warming predicted between models.
…
Read more: https://theconversation.com/why-clouds-are-the-missing-piece-in-the-climate-change-puzzle-140812
The abstract of the study;
Controls of the transient climate response to emissions by physical feedbacks, heat uptake and carbon cycling
Richard G Williams1,4, Paulo Ceppi2 and Anna Katavouta1,3
Published 11 September 2020 • © 2020 The Author(s).
Published by IOP Publishing LtdThe surface warming response to carbon emissions is diagnosed using a suite of Earth system models, 9 CMIP6 and 7 CMIP5, following an annual 1% rise in atmospheric CO2 over 140 years. This surface warming response defines a climate metric, the Transient Climate Response to cumulative carbon Emissions (TCRE), which is important in estimating how much carbon may be emitted to avoid dangerous climate. The processes controlling these intermodel differences in the TCRE are revealed by defining the TCRE in terms of a product of three dependences: the surface warming dependence on radiative forcing (including the effects of physical climate feedbacks and planetary heat uptake), the radiative forcing dependence on changes in atmospheric carbon and the airborne fraction. Intermodel differences in the TCRE are mainly controlled by the thermal response involving the surface warming dependence on radiative forcing, which arise through large differences in physical climate feedbacks that are only partly compensated by smaller differences in ocean heat uptake. The other contributions to the TCRE from the radiative forcing and carbon responses are of comparable importance to the contribution from the thermal response on timescales of 50 years and longer for our subset of CMIP5 models and 100 years and longer for our subset of CMIP6 models. Hence, providing tighter constraints on how much carbon may be emitted based on the TCRE requires providing tighter bounds for estimates of the physical climate feedbacks, particularly from clouds, as well as to a lesser extent for the other contributions from the rate of ocean heat uptake, and the terrestrial and ocean cycling of carbon.
Read more: https://iopscience.iop.org/article/10.1088/1748-9326/ab97c9
The authors assert that if we had a better understanding clouds, the spread of model predictions could be reduced. But there is some controversy about how badly cloud errors affect model predictions, and that controversy is not just limited to climate alarmists.
Pat Frank, who produced the diagram at the top of the page in his paper “Propagation of Error and the Reliability of Global Air Temperature Projections“, argues that climate models are unphysical and utterly unreliable, because they contain known model cloud physics errors so large the impact of the errors dwarfs the effect of rising CO2. My understanding is Pat believes large climate model physics errors have been hidden away via a dubious tuning process, which adds even more errors to coerce climate models into matching past temperature observations, without fixing the original errors.
Climate skeptic Dr. Roy Spencer disagrees with Pat Frank; Dr. Spencer suggests the cloud error biases hilighted by Pat Frank are cancelled out by other biases, resulting in a stable top of atmosphere radiative balance. Dr. Spencer makes it clear that he also does not trust climate model projections, though for different reasons to Pat Frank.
Other climate scientists like the authors of the study above, Paulo Ceppi and Ric Williams, pop up from time to time and suggest that clouds are a significant problem, though Paulo and Ric’s estimate of the scale of the problem appears to be well short of Pat Frank’s estimate.
Whoever is right, I think what is abundantly clear is the science is far from settled.
But!!!! But!!! The science was settled?
It is only Alarmists who think that the science is settled.
And they also believe that insulting people with immature name calling will help solve their predicted disaster. [sorry, projected disaster. Alarmists don’t do “predictions”, because predictions can be checked and found to be wrong. Projections can be as alarming as desired, and can never be falsified – they are not really “science”]
Some of the so-called “scientists” and “climate scientists” are no better. They don’t even look at RATS (real actual temperatures). They only look at temperature anomalies. [Alarmists believe that all change is bad, even if you live in a cold country]
The biggest uncertainty in climate science is whether Alarmists will even realise that they have shot themselves in both feet.
https://agree-to-disagree.com/why-is-climate-science-different
Sheldon,
On somes things – but not all things, as Eric sagely notices – the science is settled. Using anomalies is one. If you don’t understand why then just ask him.
And you’re also wondering what is so alarming about the insight: “if we had a better understanding clouds, the spread of model predictions could be reduced”, then again, ask Eric.
Loydo
I understand why anomalies are used, and I am NOT against using temperature anomalies.
There is nothing wrong with looking at temperature anomalies. For some things, temperature anomalies are the best thing to use.
But why ignore the real actual temperatures?
If you don’t think that RATS (real actual temperatures) are important, then I suggest that you read some of these articles:
https://agree-to-disagree.com/how-hot-is-that-country
https://agree-to-disagree.com/rats-average-daily-high-for-the-hottest-month
https://agree-to-disagree.com/rats-winter-summer-temperature-difference
All of my articles are based on real actual temperatures from more than 24,000 locations on the Earth.
Ouch, I scored points just visiting your blog.
https://math.ucr.edu/home/baez/crackpot.html
Why are you ignoring the fact that no-one ignores actual temperatures?
Oh, really? Name them.
Is that your latest comeback Loydo as I said last time Climate Science scores pretty impressively itself on that test.
Loy.. you have NEVER scored any points against ANYONE
You are DELUSIONAL, and a scientifically illiterate NUTCASE.
You are a little child-mind, in a sea of adults, and devoid of any rational or logical thought.
loydo,
“Why are you ignoring the fact that no-one ignores actual temperatures?
Oh, really? Name them.”
Everyone, including you! It’s averages all the way down. When you take an average you lose every bit of data about the actual data.
Here’s an average: 50
No tell me *exactly* what actual maximum and minimum data points contributed to that average.
If you can’t then your claim that no one ignores actual temperatures is just so much bovine fertilizer!
“On somes [sic] things?”
When, for example, the CA governor declares the science of climate change is settled, which “some things” is he referring to? Why doesn’t anyone ever say, “the science is settled on some things?” The implication is that it is settled on basically everything.
I think that Loydo just shot himself in both feet 🙂
https://agree-to-disagree.com/one-sandwich-short-of-a-picnic
https://agree-to-disagree.com/global-warming-travel-warning
“I think that Loydo just shot himself in both feet”
Non-functional brain.. so he won’t feel it. !
“It is only Alarmists who think that the science is settled.”
No, it is only Alarmists who say that the science is settled.
Far as I’m concerned, the evidence they are knowingly lying is their demands for ever more funding. If the science were settled, what are they researching?
The only way any results from a climate model could be trusted are:
The continuum errors in both the dynamical and physical equations approximated by the model are smaller than the truncation errors of an accurate (almost convergent) numerical solution.
Now let us discuss each of these requirements in detail.
1. All current global climate models are approximating the wrong dynamical system (the hydrostatic system) of equations. This has been mathematically proved in my peer reviewed manuscript that appears in the September issue of the journal Dynamics of Atmospheres and Oceans and in another thread on this site.
2. The physical equations are approximated by discontinuous parameterizations that have large continuum errors and that violate the necessary requirements that the continuum solution be expandable into a Tayor series. The necessary unrealistically large
dissipation needed to prevent the model from blowing up due to these discontinuities leads to a large continuum error and destroys the numerical accuracy as shown by the Browning, Hack, and Swarztrauber cited in the above manuscript.
3. As the requirements for a numerical method to converge to an accurate approximation of the continuum equations are violated,
the numerical solution will never be close to the true soltuion.
Clouds are the main focus of the next IPCC report, Assessment Report 6 (AR6), to be published in 2022.
In the previous report (AR5) the sensitivity of global temperature to a doubling of CO2 was – within a 60% certainty – estimated to lie between 1,5 and 4,5 degrees Celsius. There is a huge difference in consequences between these two endpoints. Scientists widely agree that doubling of CO2 alone gives a warming of about 1 degree. The rest is feedback, mainly from a shrinking ice sheet and from clouds and aerosols.
When starting the current reporting cycle, in May 2017 the chair of IPCC published a “vision paper”. Clouds are mentioned eight times. He writes “It is important that the scoping of the AR6 is designed to
facilitate the flow of information from new observations, process based understanding, model
evaluation and projections, especially in relationship to aerosols and clouds. ”
https://www.ipcc.ch/site/assets/uploads/2018/11/AR6-Chair-Vision-Paper.pdf
Well, we shall see; but they will have to start thinking outside the current box and when they do they will have to come to terms (if they are honest) that have been getting it wrong for a long time; particularly in the assumption that water provides a positive feedback to the GHE.
I doubt we shall see anything happening; as it would be a political disaster.
Despite the uncertainty, they are certain that clouds will amplify global warming?????
“Despite the uncertainty, they are certain that clouds will amplify global warming?????”
They did use the weasel word “likely” so that they can’t be blamed if they are be wrong (“While we do know that clouds will likely amplify global warming …“)
So unscientific to say “ we do know that clouds will likely amplify global warming”.
I suspect clouds + rain and storms tend to cap global warming. Big storm systems with towering thunderheads are columns of moist air punching a hole through the bulk of the greenhouse blanket, using evaporation and condensation to transport vast quantities of heat from the surface up to the cold edge of space.
Roger that.
+1
You’ve got Eric there is huge amount of energy transmitted upwards by the clouds . It is done through the Hydro/Rankine Cycle; but gets little credence in modelling circles.
Lets keep things in perspective here, I know its easy to get carried away… but I suspect there is something new and quite banal overwhelming even this vast and majestic process. Otherwise land and ocean temperatures would not be relentlessly climbing so.


Oh yea! The Venusian atmosphere the settled science crowd crowed about is just a few years away.
YEs Loy..
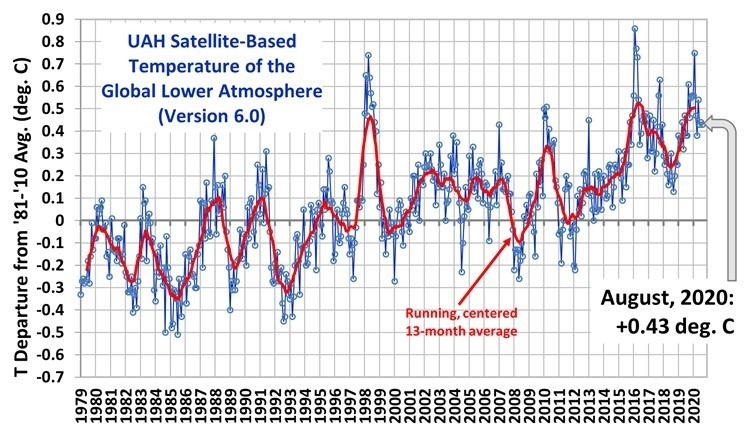
UAH shows that the warming in the last 50 years or so has come ONLY at El Nino events
Thanks for showing everyone that CO2 has absolutely NOTHING to do with it.
And lets have a look at that OHC .. which represents some 0.1C of warming, and is a MODELED graph because it could never be actually measured.
Then let’s look at it in context over the longer time span… see that little red wiggle at the end.
You are a scientifically illiterate twerp, Loy, stuck in your abyss of ignorance.
Hmmm.

Your graph is from Rosenthal 2013
SST have gone hockey stick.
From the Abstract
Observed increases in ocean heat content (OHC) and temperature are robust indicators of global warming during the past several decades
Give yourself an uppercut then post the video.
Poor little-mind DENIAL of the fact that the world is COOLER now than it has been for most of the last 10,000 years
You live in a tiny little world of scientific ignorance
NOAA themselves only show 0.08C of whole ocean warming since the 1950’s
And the OHC chart you posted is showing only 0.1C.
Anyone claiming oceans have suddenly warmed by 2C is LYING or committing mathematical malfeasance.!
Pity science has left you behind. !
” We show that water masses linked to North Pacific and Antarctic intermediate waters were warmer by 2.1 ± 0.4°C and 1.5 ± 0.4°C, respectively, during the middle Holocene Thermal Maximum than over the past century. Both water masses were ~0.9°C warmer during the Medieval Warm period than during the Little Ice Age and ~0.65° warmer than in recent decades.”
Oh look….. direct from Rosenthal 2013.
And as shown, that up-tick is NOT supported by the actual data.
https://www.thegwpf.com/steve-mcintyre-rosenthal-al-2013/
But without it, it probably wouldn’t have got passed the climate gatekeepers.
https://climateaudit.org/2013/11/02/rosenthal-et-al-2013/
Pick yourself up from your faceplant into your own excrement, slimon.
A real mess-up on that graph..
Rosenthal make the classic mathematical faceplant of splicing short tern data onto widely spaced proxy data.
Their “supplementary materials” pdf shows they used 200 year intervals to plot their Pacific OHC estimates. Pretending the last dot that creates that up-tick has any meaning, is a mathematical absurdity
But that is beyond your comprehension, isn’t it Loy…
And from the table shown , from Rotenthal, revised….
Warming is 0.24 K/century.
Are you SCARED yet…… is it time to PANIC ???
Now , where’s that evidence of warming by atmospheric CO2 ?
Still ABSENT….. MISSING….. NON-EXISTENT
So it took you how long to realize the graph *you* posted was dodgy? Didn’t the sharpie line drawn on it give you *any* pause for thought. Keep digging fido.
Poor Loy do still stuck with his IGNORANCE and climate change DENIAL
Its little mind just cannot accept the REALITY that current temperatures, OHC etc are only a small amount above the cold anomaly of the LIA.
Incapable of learning basic facts.. see that little red wiggle
That is the REALITY…
Why do you continue to show you are NOTHING but a clueless, ignorant , zero-science CLOWN
All impressive graphs; but to me 0.5 Degrees is not much to worry about . We are in a very benign phase in our climate history. Thankfully.
Loydo,
Perspective, eh?
How do you know land and ocean temperatures are relentlessly climbing?
All you know is that *average* land and ocean temperatures are climbing. Here’s an average: 50
Tell me what contributed to that average. If you can’t then you simply don’t know if land and ocean temperatures are relentlessly climbing.
Do have a link to a graph of any temperature set where temperatures aren’t climbing relentlessly?
You mean since the COLDEST period in 10,000 years
Thank goodness for that warming, hey loy.-doh !
And yes, RSS V4 shows no warming from 1980-1997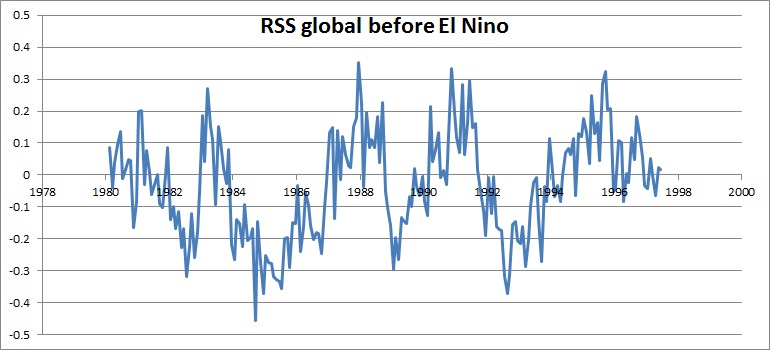
and no warming from 2001-2015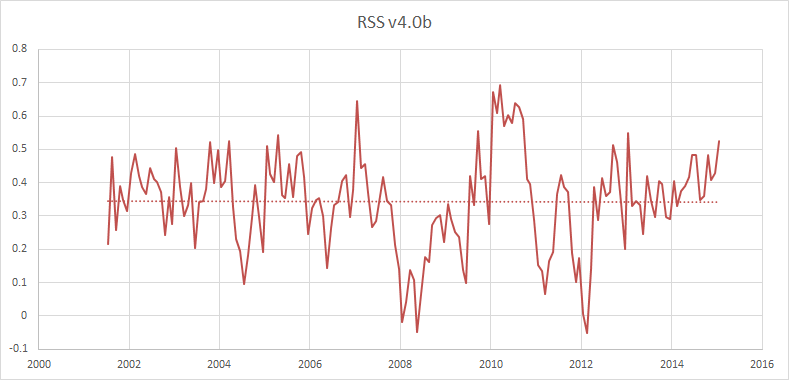
Data from before the AGW scam shows COOLING from 1940-1970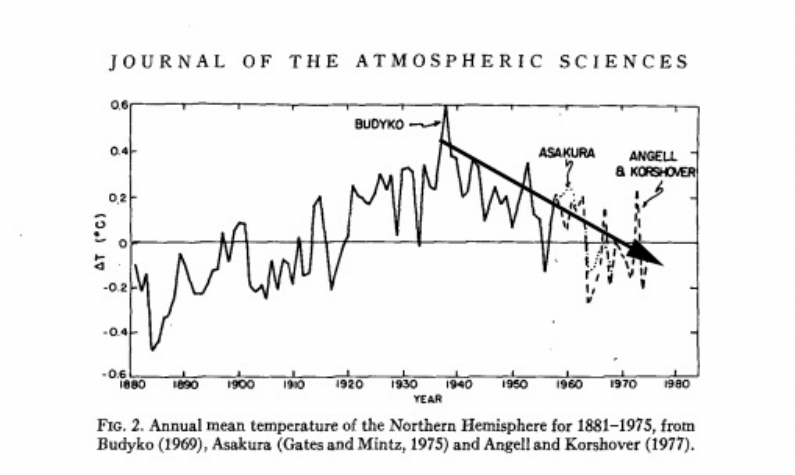
Only the fabrication that is GISS et al has this human created (by adjustment and infilling and just horrendous data quality) persistent warming since the LIA.
For the 3000 years before the LIA.. it was COOLING
Or are you still deep in the abyss of your climate change denial, Loy. .. doh !
Loydo,
You didn’t answer my question.
If I give you the average of 50 can you tell me the maximum and minimum values that contributed to that number?
If you can’t then there is no way for you to know what is warming and what is cooling. And that is the whole problem with the “global average temperature”.
ANSWER THE QUESTION! Quit hiding from reality!
I agree with Stubbings – there is no scientific reason to expect clouds to make things worse. Like Worrall, I expect diurnal variations in clouds to have a huge impact on the equations. And I am convinced that we should explore Willis Eschenbach’s hypothesis that cloud formation can act like a control system – like a thermostat – to moderate warming effects. Our climate is so stable, year after year, that I doubt it is running open-loop.
boffin77:
You say: “ And I am convinced that we should explore Willis Eschenbach’s hypothesis that cloud formation can act like a control system – like a thermostat – to moderate warming effects. Our climate is so stable, year after year, that I doubt it is running open-loop.“
I certainly concur with this. We find this thermostat effect in our steam generating plants, where an increase in heat input does not result in an increase in temperature PROVIDING the pressure remains constant. All happens is an increase in the rate of circulation in the system. In the atmosphere, due to the constant gravity the pressure spectrum remains stable with the Hydro Cycle operating as a Rankine Cycle in like manner.
Thus we have the Hydro Cycle reacting to any extra heat input such as say the GHE by merely accelerating its rate of circulation without a temperature increase.
In my book this is a form of thermostat with a strong NEGATIVE feedback to the GHE.
However I think that the clouds , being merely an intrinsic part of the cycle are not the prime influence here. In fact they do contribute a relatively small positive feedback when you consider their radiative behaviours, as does the IPCC .
What matters here is the NET figure where feedback is concerned.
I have often wondered why we have hear so little about measurements of the Earth’s albedo. We have had satellites observing this for decades now, and the data should be widely available. Any “forecasting” of climate would necessarily take that into account, and the lack of this information is (to a large extent) the reason I have little to no faith in climate alarmism.
Kpar
Measuring the retroflectance (albedo) alone isn’t sufficient and it is just one more problem in the non-physicality of extant models. See why at this link:
https://wattsupwiththat.com/2016/09/12/why-albedo-is-the-wrong-measure-of-reflectivity-for-modeling-climate/
It is interesting that the albedo of totally cloudy Venus is 0.65 or higher. Our cloudless rocky moon is 0.12. Here on Earth we have 70% ocean with an albedo of 0.05, and some land masses of higher albedo, but a predominant feature of our planet is that 60% cloud cover average, with a resultant overall albedo slightly more than 0.30.
Yet, instead of mentally absorbing the albedo information, climate scientists seem to be completely misled by the fact that Venus is super hot at ground level, and don’t do their heat transfer calculations very well. They don’t seem to believe that cloud cover (a result of water content of air increasing with increasing water temperature over the ocean, then convecting up into the colder troposphere forming clouds) is what controls the Earth’s temperature. Very odd conceptualization. Its a forest for the trees issue. An extra square meter of clouds on Earth can reflect much more the amount of incoming sunlight back into space, than it can reflect IR originating from the ground back to the ground, or emit to the ground by virtue of its temperature.
However, on Venus, there is no room for an extra square meter of cloud cover, and no ocean below to generate the cloud. Heat loss from the surface is limited by convection and radiation. So Earth’s temperature is controlled by it’s cloud cover, which is controlled by the Clausius-Clapeyron equation, and the randomness of which continent the wind blows the clouds over a couple of days later,
Science is settled – period !
😀
“The surface warming response to carbon emissions is diagnosed using a suite of Earth system models … ”
Any one who produces a study that doesn’t know the difference between Carbon Emissions and Carbon Dioxide Emissions needs to take a basic chemistry class before they are ever allowed to publish a study.
Amen!
“Carbon” emissions brings up a scary vision of black clouds and soot. Plain ol” CO2 does not.
So the main influence of climatic conditions has been hiding in plain sight all this time?
“I’ve looked at clouds from both sides now . . . “
It’s clouds’ illusions I recall. Maybe we really don’t know clouds at all.
Clouds are one known unknown. CO2, natural, anthropogenic, reradation and heat transport, is another.
The behavior of clouds is clear. Without this strange dependence on the amount of clouds vs. temperature,
http://www.palisad.com/co2/sens/st_ca.png
which modulates the fraction of surface emissions reaching TOA, the average fraction would not be within a few percent of each other from pole to pole. This constant fraction is equivalent to modeling the temperature as a black body multiplied by this fraction to calculate TOA emissions, i.e. an equivalent emissivity.
http://www.palisad.com/co2/tp/fig1.png
The green line is the prediction of a constant fraction of 0.62 from pole to pole and as you can see, even monthly averages (the small dots) agree. Multi-decade averages (the larger dots) agree even more.
It’ can’t be a coincidence as the same coincidence would need to be happening all across the globe and at all times. There’s a good reason for why the most likely fraction is 1/g, where g is the golden ratio. It’s the natural consequence of a chaotically self organized system where clouds provide the chaos.
http://www.palisad.com/co2/goldenwarming.pdf
Decrease in tropical cloud cover..
More energy into the oceans.
Wow! For a moment I thought that here was to be a fresh look at the clouds and the Hydro Cycle. Sadly no. Very disappointed; for here again is the Grouthink CO2 obsession driving the view that all may be explained by radiation and what comes out of the sophisticated satellite and other measurements which merely needs to be properly analysed to obtain conclusions.
No. IMO, to advance the understanding of clouds these things need to be put to one side and thinking needs to be outside this box.
To start with, a simple look at the steam tables will reveal that 1 Kilogram of water evaporated rom the surface contains some 694 Watthrs. of energy in the Latent Heat. This Kilogram once it has passed through the clouds etc. in the Hydro Cycle returns to earth WITHOUT this energy.
This raises a chain of questions unrelated to CO2 or radiation which opens up a fascinating area for scientific research and explanations. The first two questions being : Where does that energy go and how does it rise up through the atmosphere and the clouds.?
No need to go further; but just hope it opens up the debate .
Incidentally I have found that following this route provides a simple explanation as to why the oceans never get above about 32C in spite of tens of thousands of years of solar radiation. But that is just me. What do others think?
Is it a trick question? I’ll give it a shot.
As water at the surface warms (mostly due to solar radiation), it evaporates. The latent heat of vaporization is drawn from the surrounding water and air at the surface, cooling the surface. The latent heat is carried up with the water vapor from the surface into the lower troposphere by mass transport (convection) due to buoyancy. It continues to rise until it reaches a point where the cold air is saturated with water vapor (100% relative humidity at the temperature and pressure conditions at that altitude). Water vapor then begins to condense out onto particles of dust and onto existing water droplets. The latent heat released during condensation somewhat warms the very cold air surrounding the condensing water droplets. That warmer air convects further as we can observe when we see billowing clouds rising. Eventually the heat radiates to outer space.
For every flow of air/water vapor upward in convection there must be cooler and drier air displaced toward the surface. This mixes and further cools the air near the surface.
In the clouds, as the droplets reach a critical size, they will be too heavy to be carried up in the convecting air and will fall as rain. The cold water raindrops then further cool the surface.
To address the question of sea surface temperature seeming to be limited to about 32C, my guess would be that it’s a balance between an increasing rate of evaporation (a strong function of temperature) and the cooling effect of that evaporation. Also, with that high amount of water vapor convecting up to the clouds, the clouds will rapidly reach the point where raindrops can no longer remain aloft. It is therefore an emergent phenomenon that regulates surface temperature as long as there is sufficient water at the surface.
Did I miss something?
Oh I did leave out one important point. As clouds form, some of the incoming solar radiation is blocked, cutting off part of the heat source. Again a simple and effective emergent phenomenon.
Not my ideas, btw, I’m going on memory from Willis Eschenbach’s explanation.
Yes the bottom of the clouds receive far less solar than the top but do get more upwelling radiation from the surface. Another reason why they are so complex.
I reckon that at the top the solar is actually causing further evaporation which partly explains why we get those anvil clouds where convection has been prevented.
Yep. ‘(climate computer model programmer) ‘But we know there is positive feedback’.
old construction worker:
NO. We DON’t KNOW there is a positive feedback. In fact it is a FALSE assumption due to the omission in the calculations of the behaviour of water at the point of evaporation which provides a very strong NEGATIVE. feedback. The Latent Heat generated here at a Planck sensitivity coefficient of zero rises in opposition to the purported GHE.
These days Alasdair, people aren’t asked what they “think”.
They’re asked how they “feel”.
Yes Mr. I very much feel that you are right.
“. . . as to why the oceans never get above about 32C in spite of tens of thousands of years of solar radiation. But that is just me. What do others think?”
I think that large areas, over great depths, of the Earth’s oceans are several degrees above 32 deg-F.
I concur with you that the (Earth’s) oceans, en masse, never get above 32 C (90 deg-F). Most marine life could not survive continuous exposure to water this hot. For example, the ideal temperature for a reef aquarium is 75-78 deg-F.
I think your statement would apply to tens of millions if not billions—not just tens of thousands—of years of solar radiation.
Some version of this has applied since the earth cooled sufficiently to have liquid water. But it does depend on atmospheric pressure, salinity, TSI, that have varied over the eons, and probably other factors I’m not considering.
But we don’t have solar radiation for thousands or billions of years. At any given point, we have periods of night at least every six months (in polar regions) and more typically every 10-14 hours. The surface warms during sunshine and cools in darkness. At all times, the heat received from the sun must match the heat radiated to space, otherwise temperature changes at the surface. There’s no accumulation over thousands of years (ok, except potentially in the deep ocean with very slow currents).
You yourself introduced the distinction of day versus night (i.e., non-continuous radiation for a given location on Earth, but nevertheless the Sun has shined continuously for billions of years, always illuminating half of Earth’s surface area).
You yourself introduced the issue of polar (versus non-polar) regions on Earth.
You yourself introduced the word “accumulation”.
To what end?
Obviously because Alisdair said:
It’s a clear implication that heat was expected to accumulate over time (tens of thousands of years).
I’m just reacting to that implied expectation.
Gordon:
Yes: Millions might well have been better. Also agree there must be higher temperatures at depth due to local volcanic and tectonic plate movements.
Tried to keep it simple! Easy with these things to go off at a tangent.
Thanks
You are on the right track. The water cycle is controlling the surface temperature. Not CO2. Experiment with this vertical flow model. During the day, when their are few clouds, the sun heats up the surface water. However, most of that energy goes into evaporating water. Evaporation is an endothermic process which cools the surface water, As the water evaporates, it releases CO2 into the air above it. The rate of that release is expected to be proportional to the rate of evaporation. The rate of evaporation is expected to be proportional to the temperature difference between the surface water and the dew point temperature of the air-water vapor mixture just above the surface. That mixture is lighter than air and will rise. Air temperature is a measure of molecular collisions (PV=nRT). As the mixture rises there are fewer collisions and both pressure and temperature decrease. When the air temperature decreases to the dew point temperature, the water vapor will condense and clouds will form. This is an exothermal process that will transfer energy to the air molecules making them lighter so they rise faster taking the water droplets with them. These water droplets grow, get colder, and absorb more CO2 as they rise. Most of this CO2 is returned to the surface in rain. But some is carried to the top of thunder clouds where the water freezes,releasing CO2 that shoots out the top at the terminal velocity of hail stones. That CO2 is transported to polar sinks via jet streams. There is relative little vertical energy transfer via CO2 radiation and absorbtion in clouds.
Fred. I am puzzled why you have brought CO2 into the discussion. It seems to me that you are confusing it with Latent Heat. We are talking here about enthalpy/energy in its different forms and the way it can react with or generate the forces involved , not CO2 which is irrelevant here.
So you have me confused but reckon you are thinking somewhat in the right direction.
My regards
Alasdair
I didn’t intend to be confusing. What i wanted to show is that the evaporation of water is controlling the flux of CO2 into the atmosphere as well as condensation in cloud with CO2 absorption returns CO2 to the surface. Thus, the surface temperature and temperature in clouds is controlling atmospheric CO2 levels; not the reverse as the warmest claim.
Yes I take your point which is relevant when dealing with the carbon cycle and CO2 in particular. However being a different subject somewhat confused me in the context of my thinking.
The way CO2 gets absorbed and outgassed from the oceans is very interesting and I tend to think as you suggest that much of absorption takes place in the atmosphere where gets into the oceans via precipitation.
I’m still not though how you conclude that the evaporation process somehow generates CO2. Perhaps you could explain?
That is simple. The dissolve CO2 that is in the evaporating water has no where to go but into the air above the water that has not evaporated.
Fred isn’t the increase in CO2 conc. having any effect?
to Loydo
Not in clouds, because the energy transfer associated with evaporation/condensation of water is so much greater than CO2 radiation transfer.
Alasdair,
I’m impatiently awaiting the promised debate. Were you expecting a different answer?
Sorry I’m not very good at dealing with all these comments so tend to get lost.
I had hoped you would perhaps contact me via email; but maybe you would wish to avoid that. Would look forward to further discussion.
Regards
Alasdair
alasdairfairbairn220@gmail.com
( I’m not too bothered people knowing my email address. Maybe I am naive)
Strange that you spoke of a debate as if expecting opinions with which you would disagree, but you have not disagreed with anything. How you would think that I could have known your email is also curious. The point of blog comments is that they are public and everyone can contribute to the discussion and benefit from the different perspectives.
Well if you never actually had a point that you wanted to make, then I’ll just move on.
Rich:
All i’m after is a chat with someone of like mind and curiosity over matters of the Hydro Cycle. Thought it might be better via email. I could do with someone to point out any flaws I have in my thinking ; as currently it is being done in a vacuum.
No problem if you decline.
Regards
Cloud amounts vary with changes in the ‘waviness’ of the mid latitude jet stream tracks.
That is what controls the proportion of solar energy able to enter the oceans and introduces variability in temperature around the baseline set by atmospheric mass moving up and down via convection within a gravitational field.
Those variations are easily neutralised by adjustments in the size, intensity and position of the Hadley, Ferrell and polar atmospheric cells.
Radiative imbalances introduced by radiative gases are dealt with in the same way but require miniscule adjustments that we would find too small to measure.
If they don’t understand clouds then they’ve done zero science and its all linear progression lies.
Well, it might be too late, as he might be doing a Joe Biden, but has anyone told Jim “feedback” Hansen about clouds yet? ….. rain too.
Clouds and rain are like democrats dammit. They can ruin anything, eh Jim?
Cloud amounts vary with changes in the ‘waviness’ of the mid latitude jet stream tracks.
That is what controls the proportion of solar energy able to enter the oceans and introduces variability in temperature around the baseline set by atmospheric mass moving up and down via convection within a gravitational field.
Those variations are easily neutralised by adjustments in the size, intensity and position of the Hadley, Ferrell and polar atmospheric cells.
Radiative imbalances introduced by radiative gases are dealt with in the same way but require miniscule adjustments that we would find too small to measure.
Cough…did somebody say clouds?
https://notrickszone.com/2019/08/29/nasa-we-cant-model-clouds-so-climate-models-are-100-times-less-accurate-than-needed-for-projections/
” NASA: We Can’t Model Clouds, So Climate Models Are 100 Times Less Accurate Than Needed For Projections
NASA: We Can’t Model Clouds, So Climate Models Are 100 Times Less Accurate Than Needed For Projections
By Kenneth Richard on 29. August 2019″
Well then, how about this one..
https://notrickszone.com/2020/09/11/austrian-analyst-things-with-greenhouse-effect-ghe-arent-adding-up-something-totally-wrong/
Certainly interesting
Eventually they will figure out that warming by atmospheric CO2 is not actually possible, because the CONTROLS that balance the atmosphere are immediate and overwhelming.
Atmospheric molar density allowing the retention of energy via the gravity based lapse rate.
Climate scientists–they can’t see the climate for the clouds.
By the early 1990’s the results of NASA’s Earth Radiation Budget Experiment were clear.
Taken all together, clouds are strong coolers.
The exception are thin clouds, which have an overall warming effect
The Chilling Stars, Henrick Svensmark 2008, page 67
Note: Al Gore is right, the science is settled, the only unsettled aspect is how much COOLING.
The scientists said – in perfect harmony:
I’ve looked at clouds from both sides now
From up and down and still somehow
It’s cloud’s illusions I recall
I really don’t know clouds at all
The lyrics of Joni Mitchell’s songs contain many gems of wisdom.
From “Big Yellow Taxi”
Don’t it always seem to go
That you don’t know what you’ve got til its gone
They paved paradise
And put up a parking lot
“While we do know that clouds will likely amplify global warming, there is still a great deal of uncertainty about how strong this effect will be.”
Actual data however suggest that clouds have a small net cooling effect. Even GISS admits that:
https://www.giss.nasa.gov/research/briefs/rossow_01/neteffect.html
“Actual data however suggest that clouds have a small net cooling effect.”
That is worth repeating. Over and over and over again.
Wouldn’t it be embarrassing for the Alarmists if it turns out CO2 ultimately cools the atmosphere rather than warming it. They don’t know that it doesn’t. The science isn’t settled.
Tom:
The link only refers to the radiative aspects of clouds with no reference to the thermodynamic workings of the Hydro Cycle which produce a strong negative feedback to the GHE.
Water vapor is a greenhouse gas. There is on average 50 times as much of it in the atmosphere as CO2. Occasionally as much as 100 times. Explain how CO2 is dominant.
And occasionally (at 100% RH, associated with the interior of clouds, a dense fog or rainstorm conditions) as much as 735 times as much as water vapor as CO2 on a ppmv basis.
Average global atmospheric water (TPW) is about 0.25 percent, or 2500 ppm.
Measured for many decades.
http://www.climate4you.com/GreenhouseGasses.htm
Average global atmospheric CO2 is about 410 ppm.
2500/410 = 6
And H₂O is many times more effective at energy absorption.
H₂O is the only atmospheric gas that can alter the lapse rate,
….. so it is, in reality, the only “greenhouse” gas.
Anything else is a scientific mis-naming.
Back at you:
“The percentage water vapor in surface air varies from 0.01% at -42 °C (-44 °F) to 4.24% when the dew point is 30 °C (86 °F).”—source: https://en.wikipedia.org/wiki/Water_vapor
“Water vapor varies by volume in the atmosphere from a trace to about 4%. Therefore, on average, only about 2 to 3% of the molecules in the air are water vapor molecules.”—source: https://www.theweatherprediction.com/habyhints/40/#:~:text=ATMOSPHERIC%20WATER%20VAPOR&text=Water%20vapor%20varies%20by%20volume,air%20are%20water%20vapor%20molecules.
Assuming an average of 2.5% based on the above, that translates to 25,000 ppmv.
Bottom line: you are off an order of magnitude too low.
My response to M Simon is correct.
Total Precipitable Water (TPW) is a well known global parameter, see the climate4you link.
A column of atmosphere contains on average about 25 millimeters of liquid water.
That’s just how it is expressed. If all the water in the atmosphere condensed to the bottom, it would have a thickness of 25 millimeters.
25 millimeters of liquid water has a mass of 25 kilograms per cubic meter.
The mass of the atmosphere is 10135 kilograms in a square meter column extending to the top of the atmosphere.
25 divided by 10135 is about 0.0025, or 0.25 percent, or 2500 ppm by mass.
The Earth’s global atmosphere contains on average 2500 ppm H20.
Don’t get fixated on surface conditions. A typical office at 50 percent RH will have about 10 grams per cubic meter of air. Tropical ocean can easily be 30000 ppm at the surface.
The stratosphere is 10 ppm H2O.
The real world is here
https://eldoradoweather.com/climate/world-maps/world-precipitable-water.html
bwegher,
1) You are confusing TPW with humidity evaluated near Earth’s surface (i.e., the lower part of the troposphere). The stated values of 2 to 3% of water vapor molecules in the air were never meant to apply across the total atmospheric column. Fifty percent of the total mass of the atmosphere is located above the first 5.6 km (3.5 miles or 18,000 ft) of the troposphere. The Wiki reference that I gave in my previous reply specifically states “The percentage water vapor in surface air . . .”
2) You are confusing parts per million by volume, ppmv (the standard method of reporting concentrations of various gases in mixtures) with parts per million by weight (what you derive from comparing TPI weight against the total weight of an atmospheric “column extending to the top of the atmosphere”.
I have confirmed your values and conclusion of 0.25 percent TPW weight versus atmospheric column weight, but again that is a different matter from the 2-3% water vapor by volume that most people consider when talking about “surface” or lower tropospheric humidity.
The claim that water vapor is on average 50 times greater than CO2 is faulty.
On a mole or volume basis the ratio is 6.2 to 1.
Converting to mass, the MW of water is 18, and CO2 is 44, so the final ratio is 2.5 to 1.
Using PV=nRT with water fully mixed in an “average” cubic meter of air at the surface, the cubic meter contains 975 grams of N2, 298 grams of O2, 16.6 grams of Argon, 2 grams of H2O, 0.78 grams of CO2, 0.016 grams of Neon and 1 milligram of CH4. Total 1292.797 grams of gas per cubic meter.
The webpapge at http://ossfoundation.us/projects/environment/global-warming/atmospheric-composition provides a table listing “average estimated composition of the atmosphere up to an altitude of 25 km” in both percent volume and ppm (=ppmv) for all of its chemical constituents. While noting that both H2O and CO2 are “considered relatively variable gases”, the table gives the value of 25,000 ppmv for water vapor, and 399 ppmv for CO2 (noting it was for a December 2014 estimate).
If we update the CO2 to today’s 410 ppmv value, we get the ratio of H2O/CO2 = 25,000/410 = 61 as the mole or volume ratio.
Of course, since water vapor is acknowledged to range from “0.01% at -42 °C (-44 °F) to 4.24% when the dew point is 30 °C (86 °F)” per the previously-cited Wiki reference, anyone if free to pick the value of 2,540 ppmv (0.25%) for water vapor that would indeed result in the particular H2O/CO2 ratio of 6.2 that you cite.
I will just add that 2,540 ppmv water vapor at normal sea level pressure and 21 C equates to a relative humidity level of 10.3% . . . that’s pretty arid. In comparison, the Sahara Desert has an average relative humidity of 25%.
I don’t know what else to say.
Little wonder they are having trouble modeling clouds. Because no two clouds are ever exactly alike.
A really laughable statement from the above article’s boxed quotes attributed to Ceppi and Williams: “In new research, we discovered one of the reasons why there is such a large range of estimates for how much carbon can be safely emitted: the uncertain behaviour of clouds.”
Wait a minute! . . . you both DISCOVERED one of the reasons was “uncertain behavior of clouds”??? Heck, cloud behavior (e.g., % coverage, persistence, sources of nucleation, dependence on changes in local or global atmospheric humidity, etc.) has been featured in many, many public articles over the last 20 years, including here at WUWT (most notably, articles by Pat Frank as demonstrated by the lead graphic above).
Ceppi and Williams, methinks you can claim nothing more than “we confirmed . . .”
Also, guys(?), it would have been helpful if you had first give the scientific basis to support “to keep global temperature rise below 1.5°C and avoid dangerous levels of warming, governments need to know how much carbon they can emit”.
But asking you for overwhelming scientific evidence to support anthropogenic CO2 emissions causing any measurable change in global temperatures is probably just too much to ask in today’s world of scientific discourse.
Or maybe you just used that lead-in as a setup for obtaining additional funding from those fronting this meme?
Maybe it’s something else?
Seismic activity, lagged 2 years Vs UAH.. (all normalised)
We really are in some *really* deep schist here…
Quote”This “blanket” effect is particularly noticeable during the winter, when cloudy nights are typically much warmer than cloud-free ones.”
So where did the heat come from that the clouds are blanketing? Its winter remember – the clouds stopped the sun shining in to warm the place up.
How did The Cloud radiate *anything* down to the ground. It *has* to obey Lapse Rate. So in winter with a soil/surface temp of 5 degC, the cloud will be minus 5 it its a mile high
How can these muppets not work out that ‘The Heat’, being blanketed in by The Clouds, is actually what *made* the clouds.
The Heat came from a big old bubble of warm & moist air that rolled in from somewhere else.
In the UK usually the warm air lurks behind a ‘warm front’, part of an anticyclone which started life out in the Atlantic.
The warm air in that case probably originated from Florida or there-a-bouts.
That these clowns don’t realise or cannot work it out and we’re basing so much on their say-so is beyond insanity. We deserve to d1e if we let them continue. No sympathy from this quarter. Sorry.
The “blanket” effect is not so much that the clouds warm Earth’s surface (being at a temperature above absolute zero and having a thermal emissivity above zero, clouds do in fact radiate thermal energy toward Earth’s surface) as it is that they greatly reduce, especially during the night, the amount of thermal energy loss (i.e., “cooling”) that would otherwise occur if Earth’s surface radiated through a clear atmospheric layer directly to deep space, having an “effective temperature” around 3 K (-455 deg-F).
And yes, I’m aware of the term “sky temperature”.
“How did The Cloud radiate *anything* down to the ground. It *has* to obey Lapse Rate.”
Of course, but ice/water are both (nearly) black body radiators, so yes, clouds radiate IR both upwards and downwards (and sideways) with the black-body spectrum applicable to the cloud temperature.
You seem to suffer fom the common delusion that photons can’t move from a colder object to a warmer. They can, and will, but the net energy flow will be from warmer to colder, but this net flow will be smaller than if the colder object wasn’t there.
Peta of Newark posted: “How did The Cloud radiate *anything* down to the ground. It *has* to obey Lapse Rate. ”
Actually no. A cloud forms when water vapor in the atmosphere condenses into micro droplets of liquid water. In this process, a relatively large amount of “latent heat” is released (about 2,260 kJ/kg of water vapor). This will occur as the cloud forms at a constant altitude or over a range of altitude . . . that is, the heat release from condensation is INDEPENDENT of the atmospheric lapse rate.
It takes a while for the mass of air and moisture contained within the cloud’s envelope to dissipate all this energy. Some of the released energy is conveyed to the ground via direct radiation, some of it by atmospheric convection, some amount of it by rain (if it occurs).
Approximately half of the energy released via radiation will eventually make its way down to Earth’s surface.
Now, you were saying something about clowns . . .
“How did The Cloud radiate *anything* down to the ground. It *has* to obey Lapse Rate.”
Not true in the slightest.
Whether something radiates depends on one thing and one thing only. It’s temperature.
Would a post or preferably an article on turbulence by Christopher Essex be appropriate here?(Enter the Navier Stokes equations!)
“Pat Frank, who produced the diagram at the top of the page in his paper “Propagation of Error and the Reliability of Global Air Temperature Projections“, argues that climate models are unphysical and utterly unreliable, because they contain known model cloud physics errors so large the impact of the errors dwarfs the effect of rising CO2.”
Pat Frank’s work is not on the physics of clouds or the models ability to use the known physics. His work is strictly a mathematical analysis of the reliability of the model projections. Briefly his point is ” since we do not not know how to model clouds with good certainty there is a given uncertainty in each calculation.” Because GCMs are iterative processes, each iteration has all the uncertainty of all the previous steps so, very soon, the uncertainty in the next step is outside physical limits of the system. This does not imply that the next step global temperature estimate might be 20C outside any previously measured temperature. It means that it has no useful information. Even if all of the physics in the model were correctly applied the uncertainty in the cloud computation portion disallows getting answers that can be trusted. The real error bars generated by his analysis don’t fit on the graph of the temperature.
Thanks DMA. I revised the paragraph which described Pat’s work five times, I wanted to encapsulate the meaning of what Pat was saying without getting too bogged down in details, hopefully I struck a reasonable balance.
Thanks, DMA. You’ve got it. 🙂
Somehow, every climate modeler I’ve encountered has been entirely unable to grasp the point you have made so readily.
(They’ve) looked at clouds
from both sides now,
from win and lose
and still somehow
its clouds’ illusions (they) recall
(they) really don’t know clouds at all.
Apologies to Joni Mitchell, but further resistance was futile.
Wow, the atmospheric CO2 must be over 1000 ppm. If you add 1% to the CO2 each year, you would use the same calculation you use to calculate compound interest. The fact that blooper escaped all the authors and the editor and the peer reviewers speaks very poorly of the mathematical knowledge of the climate community as a whole.
Yes, confirming a 1%/year rise starting from the level of CO2 that existed 140 years ago would be:
280 ppm*(1.01)^140 = 1,128 ppm . . . and that would be ± uncertainty that GLOBAL atmospheric CO2 concentration was actually 280 ppmv back then.
They are so used to qualitative arguments that when the attempt to make a quantitative statement, they’re unable to do so.
I guess they meant “annual rises in atmospheric CO2 over 140 years. The current rate of increase is about 1% of the original concentration.”
Then the English majors got involved.
Common sense suggests to me that increasing clouds would result in cooler days and warmer nights. Overall, these are good things.
When heat kills it is usually the midday heat under the sun. When cold kills, usually it is the nighttime lows that are worst.
So what if overall global temps go up a degree or two, as long as peak temps are moderated by several degrees. And more clouds means more rain. Ask California how nice that would be.
Would a post or even an article on turbulence by Christopher Essex be helpful here?(Enter the Navier Stokes equations!)
In order for clouds to form, the water needs something physical to condense on, e.g. dust. However, dust is not the only thing on which water will condense.
Has anyone ever heard of that classic piece of demonstration apparatus known as the “Wilson Cloud Chamber,” or seen one in action? I have. Saw one in a physics demonstration lab way back about 1955, and have remembered it ever since.
As SpaceWeather.com has noted, cosmic rays are increasing. It seems to me that outside of the West Coast I have been seeing a bit of cold weather lately, cold weather which seems to escape the notice of the news media for some reason or other.
The next decade could be very interesting. If some unconsidered factor such as cosmic ray influence on clouds is responsible for the model cloud error identified by Pat Frank, a substantial change in that unconsidered factor could throw models even further off.
Peter W
Yes, almost any nuclei will do. So, that includes salt from the oceans, various minerals that are in common wind-blown dust, volcanic ash, micrometeorites, and even bacteria. The last two are rarely ever considered. However, they might vary naturally over time, giving rise to variations in cloud cover. The science is NOT settled!
You spend $2T to lower the temperature by 1°C via CO2 and the average cloud cover changes by a few % and wipes that all out. You don’t have to be an Einstein to see how stupid that is. H2O is significant, CO2 is not.
$2T for 1C?
I think that the Green New Deal is supposed to run us about $100T and that’s supposed to cut us back from 2C to 1.5C.
More like $200T for 1C that could be thwarted by a small decrease in cloud cover.
Why do we still have so many models?
If we have a consensus that the science is settled, we should only have one model.
Yep.
We must have diversity. And also smoke, and mirrors.
The keys to the hydrological cycle are the fixed points of the change of state. If these were at different points as they are for different elements then there would be a totally different environment.
I don’t agree with Dr. Spencer. Random errors may cancel. Uncertainty does *not*. Uncertainties add, they don’t cancel.
The issue with clouds is not random error. It is an uncertainty about how clouds act. There is no probability density that is associated with random error when it comes to clouds. There is jut plain uncertainty and uncertainty has no probability density, it is not a random variable and, therefore, cannot cancel.
Every time a climate model is iterated with an uncertain cloud impact the uncertainty of the combined impacts grows. After some number of iterations the uncertainty becomes larger than what the model predicts.
You can’t make the models better by just ignoring the uncertainties built into the model. The uncertainties don’t just go away.
My understanding of what Dr. Spencer was saying is that the Stefan-Boltzmann effect dominates – heat makes it out one way or another, so errors in ascribing heat transport to any given mechanism don’t have a major impact on the overall outcome. Dr. Spencer also suggested a while ago that our cloud observations are not good enough to ascribe a cloud error the way Pat Frank has done.
Having said that, I’ve got to say I find Pat Frank’s argument about propagated model error compelling, but I’m strictly an observer in this debate – I’m not about to try to go toe to toe with someone with Roy Spencer’s expertise!
Roy Spencer’s argument is misguided because all the models are in global energy balance, at the same time that they are wrong about clouds and thus wrong about longwave cloud forcing.
The fact that errors are adjusted so as to cancel out does not mean the model can make correct predictions.
Uncertainty in energy is not an energy. It’s a statistic that tells you how accurately you know that energy.
Many here understand that distinction. Every studious second year engineering, physics, and chemistry undergraduate understands it
Somehow, that distinction is opaque to climate modelers.
I get what you are saying Pat, propagating known errors through the calculation to determine their possible impact on results is something I learned in high school (I had good teachers). It seems a really obvious way to test the value of a model prediction.
As far as I can tell Roy Spencer’s objection hinges on the idea that clouds are an effect rather than a cause, so changes in cloudiness don’t really affect the overall energy flow or surface temperature, but I could be wrong – I’m not 100% confident I understand Roy Spencer’s response.
Eric,
Uncertainty is not a known “error”. Uncertainty doesn’t have an impact on results, it just makes the result uncertain. If the inputs are uncertain then the output is uncertain. That is not the same thing as an error.
It doesn’t matter if clouds are an effect, they are still a cause as well. Clouds have an impact on the albedo of the earth. They do reflect energy away from the Earth. If they reflect energy away from the earth then they must be accounted for in the energy in/energy out calculations. If the amount of that energy reflection is uncertain then the final value of the calculations are uncertain as well.
Thanks Tim, I should have said “uncertainty”.
I had a conversation with Roy Spencer a while ago. I’m having trouble accepting that Roy Spencer doesn’t understand propagating uncertainty through the calculation, which makes me doubt my understanding of Roy Spencer’s response. What I would really like to see is another detailed explanation from Roy about why he thinks Pat is wrong.
Dr. Spencer isn’t coming out of left field. It appears to me that he is simply applying what I was taught in validating a model. That is, you do a hindcast applying the model to the data set over the period for which you have data. If the model agrees reasonably well with the historical data then that agreement constitutes validation. Dr. Spencer’s argument seems to me is that the hindcast doesn’t show the kind of geometric growth in uncertainty (measured in the hindcast by the difference between hindcast model values and data values!!!) that Dr. Frank’s paper explains.
This leads to a cognitive dissonance. It seems to me that in Dr. Spencer’s view, Dr. Frank can’t be right because the hindcast doesn’t show that large an uncertainty nor geometric growth. Uncertainty is being evaluated with different metrics, however. Dr. Frank is estimating uncertainty using propagation of uncertainty based on known uncertainties in cloud modeling. Dr. Spencer is evaluating uncertainty based on the fit between model hindcasts of historical values and historical data.
Which is correct? Dr. Frank’s evaluation of uncertainty is well grounded. Dr. Spencer’s evaluation of uncertainty is clouded by the “tuning” of the models which dampens uncertainty within the calibration range. Please refer to Dr. Frank’s rebuttal on October 15, 2019 at https://wattsupwiththat.com/2019/10/15/why-roy-spencers-criticism-is-wrong/. Please refer to his Figure 4: RCP8.5 projections from four CMIP5 models at ?resize=384%2C330&ssl=1. Up until about the year 2050, the models mostly agree with each other (which doesn’t mean they are right!). After that, they start to diverge dramatically. I believe the agreement between models in the early period is an artifice of the “tuning.” After the “tuning” wears off, model divergence reflect the propagation of uncertainty that Dr. Frank has shown in his paper.
The same thing is true of forecasts of hurricane tracks. These are sometimes referred to as “spaghetti” graphs. There is agreement among models followed by large divergences. I reiterate my point that the usefullness of these models is limited to short term forecasts.
Phil,
Matching hindcast data is really meaningless. A plethora of different combinations of math equations can be created to do data matching. None of the combinations need to be based on the real world. All the models eventually devolve to a linear equation with different slopes. That alone is concerning. Is the future temp gong to be that predictable?
Eric,
Pat is not wrong. Nothing from Mr. Spencer will change that. It simply doesn’t matter the approach you use in the climate models, be it a radiative balance, a thermal balance, or something else. Clouds *should* be a major contributor to any model and if the cloud factor is uncertain then the output of any model will be uncertain. If the cloud factor is uncertain at the start then the output of the model grows in uncertainty with every iteration. Sooner or later the uncertainty overtakes the ability to define differences in the output of the model.
I am not surprised at anyone today not understanding how to propagate uncertainty. It seems to be a subject that is not taught or observed very often any more. Far too many people don’t even understand the difference between dependent measurements (measuring the same thing multiple times with the same measurement device) and independent measurements (measuring different things with different measurement devices). One is error and is subject to the law of large numbers and the other is uncertainty and is not subject to the law of large numbers.
Suppose you have a disk you want to calculate the inertia of. The formula is 1/2 x m x r**2. You have two quantities to measure, mass and radius. Like with temperature you only get one measurement of each. Your measurement of the mass and the radius will have an uncertainty factor. How do you combine the uncertainty of each to come up with the uncertainty of of the inertia? You do it with root-sum-square. Just like Pat has used in all of his answers and writings.
I don’t care what Mr. Spencer says, every factor he uses has an uncertainty. And he only gets one shot at each measurement so each measurement is independent not dependent. So the uncertainties add root-sum-square. The only defense Mr. Spencer can have is that everything he measures is 100% accurate. I simply don’t believe that and never will.
The water vapor vs temperature relationship is not linear.
Increasing temperature greatly increases water vapor which condenses into aerosols (clouds).
More clouds reflect more sunlight.
There is nothing uncetain about clouds increasing global albedo.
Increasing global albedo is cooling.
Any 8 year old can see clouds build up during the day. Then dis-appear at night.
“Why clouds are the missing piece in the climate change puzzle”
This statement suggests that everything else is known. I would suggest that less than 20 percent is actually known to fully understand the mechanisms of medium to long term climate change.
This is an interesting catch from NoTricksZone:
https://notrickszone.com/2020/09/11/austrian-analyst-things-with-greenhouse-effect-ghe-arent-adding-up-something-totally-wrong/
An Austrian scientist finds observation data showing a positive correlation if cloud cover with warmer temperature, in a part of the world (North Pacific, Aleutian Islands) where climate models predict the opposite – a strongly negative cloud radiation effect.
They can’t both be right.
Williams et al abstract starts “The surface warming response …. ” It does not say “The total atmospheric warming response …”
If clouds intercept radiation travelling from surface to sky and make it warmer below them, that process must make it cooler above the clouds, so the total column has no change. Clouds cannot increase total energy.
Some researchers seem to think that this tiny effect on near-ground temperatures means they can say silly things like “global warming” and “the Earth has a fever.”
Why does it get so hard to make people see the obvious?
Geoff S
Can’t get clouds right. Can’t get precipitation right. Can’t get temps right on a continental or regional scale.
But if you add the garbage results on top of garbage results, you get something reasonable for a global temperature anomaly. Therefore the model’s are “close.” Only in climate science would this fly.
As I like to say, climate science is the only field of human endeavor, where you can average a bunch of wrong answers in order to find the right answer.
pat’s wrong.
next.
Steven Mosher is wrong.
Next.
Mosher
Your arrogance knows no bounds, unlike the uncertainty of sequential calculations.
Mosh is off his meds again .. next
Mosh deeps dives into his pit of IRRELEVANCE. !
Home sweet home for you, mosh !
Why is it that people who’ve studied English at university think that they are science experts? I say studied because Roger Harrabin, another English student seems rather shy about what qualification he got at the end of it. I think that most journalists call into this category. These people have no understanding of how science works and should keep their mouths firmly shut.
PS. Pay Frank is spot on.
Well look at that. No spelling errors again! ⭐️
And this time, punctuation! Super job! ⭐️⭐️
Please review the hand-out on capitalization (big letters) 🦄
Punctuation, but is it correct punctuation?
Is “next” enough of a sentence to get a period after it?
Oh Mark. Please don’t discourage the learner. He found the period key twice and even the apostrophe. The apostrophe is very advanced. There could be a comma in the future.
And you don’t even credit him for getting the spelling right on three out of three monosyllabic words.
Have you read and understood the BIPM Guide to the expression of uncertainty in measurement?
Steve, thank you for once again admitting that you can’t refute the argument.
Steve, you’ve never displayed an iota of scientific understanding. Not in the knowledge, and not in the method of thinking. Your opinion is meritless.
If any readers here have a Twitter account, please tweet my paper, here.
That seems to be the only way, apart from WUWT, that word of it gets out. Thanks, all. 🙂
It does not seem logical that the uncertainty of a model forecast could exceed the bounds of a system, as some have interpreted Dr. Frank’s paper. I was taught to calculate uncertainty separately from model forecasts. It is this theoretical uncertainty that can exceed system bounds.
When the theoretical uncertainty exceeds system bounds after a certain number of iterative forecasting steps, then the model becomes useless for forecasts beyond that time horizon. That the uncertainty range exceeds the bounds of the system does not mean that future values are expected to exceed the bounds of the system.
Another way to look at it is that the point in the forecasts at which the theoretical uncertainty exceeds the bounds of the system marks the outermost forecast horizon of the model. IIRC, most weather models have a forecast horizon of days, not weeks. The accuracy of longer weather forecasts seems to drop pretty fast the further out the forecast is. For example, you don’t see anyone forecasting where a hurricane is going to be two weeks ahead very often (think “Sharpiegate”). Accurately forecasting where hurricanes are headed just days ahead is difficult enough.
There is an unfortunate circular reasoning in using forecasts of climate models to show that the forecast uncertainty is constrained over the period for which there is data. As a first test, that just means that the models pass a reasonableness test. If model forecasts exceed system bounds during the period for which there is data, then such models are immediately determined to be invalid.
A further confusion arises from the practice of “tuning” models. I was taught to build a model and then to tune it by using smoothing constants and minimizing the sum of the squared errors between the model values and the data values over the period for which there is data by varying each smoothing constant over a certain range. I assume something similar in concept is done with climate models.
The problem with this practice is that the optimization of the tuning parameters is only valid over the calibration range. Forecasts are necessarily made outside of the calibration range. Tuning a model artificially constrains uncertainty within the calibration range. Tuning is a heuristic. It has no physical meaning. Thus the model becomes heuristic and any claim that the actual physics is being represented mathematically becomes more difficult to make.
Then a further assumption is made that the calibration done over the period for which there is data is valid outside of the calibration range. That assumption becomes less and less valid the longer the forecast is.
When using a heuristic, the modeling uncertainty is merely dampened. One cannot pretend that the modeling uncertainty has been eliminated. Thus, Dr. Spencer’s argument that the uncertainty in modeling clouds has been constrained is true only for the calibration range. Forecasts are necessarily done outside of the calibration range. Since the model is a heuristic and unphysical, the benefit of the tuning is not unlimited. Dr. Spencer is assuming that the dampening of the uncertainty during the calibration range will continue into the future as it does during the calibration range. That assumption is unsupported.
Should public policy be formulated based on heuristics? The answer is no for long term forecasts. Short term forecasts (i.e. weather) have been shown to be useful.
This seems to be the essence of Pat Frank’s argument, since the models have been coerced into agreeing with past temperatures without regard for fixing substantial underlying physics errors they don’t really tell us anything about what will happen outside their calibration period.
But Roy Spencer’s argument as far as I can tell is the cloud errors are not as significant as Pat thinks, that Stefan-Boltzmann rules the climate TOA energy balance, so if clouds are a little heavier one year, instead of the Earth retaining more heat or whatever the energy balances out via a different path.
Yet clouds must be important on some level if differences in predicted cloud behaviour are responsible for the spread of model predictions.
Glad I don’t have to figure it all out.
Thank-you, Phil. You’ve captured the whole message in a comprehensive nutshell.
All I did was put numbers in it.
Phil,
Thank you. You are among the few people who not only understand this, but know enough to write about it.
If there was a moment of awakening for me, it was in my young analytical chemistry days ca 1965-70 when the Moon missions were returning lunar rock and soil for analysis. Several labs, mostly government and university, with top reputations and credentials were engaged. After the analysis came the inevitable round robin comparisons. Whereas, for example, some labs claimed their results were accurate to +/- 10%, many times the labs differed by N times 10% where N was a number usually between 0 and 9.
Simply, the self-described performance beforehand was not achieved by the tested performance after the event. You would need a book to explain the reasons why.
Note that the analyses were done (mostly, AFAIK) independently. These days we see model runs for climate models compared with many others in a process that seems to allow rejection of those that do not look “correct”. Unfortunately, there is no way I know to determine “correct” in this modelling work.
Some of the pioneering work on this lunar soil analysis was by George H Morrison, who had the skill to dissect and report it. These days, people like Morrison was are having to run a gauntlet of opposition to their “reveals”. Geoff S
Clouds, one unknown variable. How many others?
“Climate skeptic Dr. Roy Spencer disagrees with Pat Frank”
Roy confused a calibration error statistic with an energetic perturbation. He also confused an uncertainty statistic with a physical temperature. His disagreement was wrong in every respect, and did not touch the analysis in my paper.
I’ve since found and assessed CMIP6 global average annual longwave cloud forcing calibration error. It’s a bit smaller than the CMIP5 error.
CMIP6 annual average global LWCF error is still about ±76 times larger than the annual average increase in forcing from human CO2 emissions.
There’s no way CMIP6 models can resolve the effect of such a tiny perturbation.
The last line of my paper remains true: The unavoidable conclusion is that a temperature signal from anthropogenic CO2 emissions (if any) cannot have been, nor presently can be, evidenced in climate observables.
That was the big boast of CMIP 6, that they did a better job of replicating cloud behaviour, and shock horror the hottest, most sensitive models did the best job.
Thanks Dr. Frank. I’ve been hoping for an update of your cloud error analysis ever since the alarmist buzz began around the more dire predictions of CMIP 6. I’m pleased to see that the modelers have “reduced” their error from 114x to 76x, which I think is due, at least in part, to your earlier work. Unfortunately, like squeezing a balloon, this improvement has come at the expense of even sillier predictions. Please keep up the good work.
Thanks, Frank. I was glad to find the opportunity to get resolution info about the CMIP6 models.
Also, please call me Pat. 🙂
From the article:
Yes, but that has NOTHING to do with the global warming equation. Those clouds were due to sun shining on water and evaporting it. Those clouds carry their latent heat up (in general) and the IR that holds energy under the cloud layer more effectively adds NO, ZERO new energy into the climate system. But the clouds themselve are going to reflect visible light back into space when the sun comes up, SUBTRACTING energy from the climate system. Goddammit why are climate scientist of the alarmist variety so stupid on this? It is the variability of the total cloud albedo that changes climate (and the orbital variations that cause relatively more or less albedo and angles of incidence of the light itself to alter the amount of energy entering the system on Northern Hemisphere land (as opposed to the more watery Southern Hemisphere) that makes the most profound changes.
And it says this:
Yep,, they don’t seem to have even the most basic idea how clouds get there in the first place.
Quite bizarre , really !
It’s not so simple.
They cool in the daytime. Obviously every cloud is the result of evaporation which cools the surface. But they also slow cooling in the nighttime. And you’re not mentioning that they move. They could cool a place in the daytime when forming and then blow away to a different place, where they slow down cooling at night.
People say that clouds warm us at night, implying a heat source. But what they do is keep us warm longer by slowing the rate of cooling. The cold cloud stands between us and the frigid 2-3 kelvin outer space. The clouds are much hotter than near absolute zero, so the net radiative heat loss is lower than if the cloud were not there.
Intuitively it seems that the cooling effects outweigh the heat retention effects, but can we prove that? In addition to that question, consider that even if the overall effect is overwhelmingly toward cooling, if various factors change the dispersion and persistence of cloud cover, that will modulate the amount of cooling. Less cooling has the same effect on temperature as more warming.
Rich, the most stifling uncomfortable nights are always where after a hot cloudless day heating the surface, the clouds roll in and as you say, slow the rate of cooling.
I still vividly recall how frequently these occurred as a youngster in the 1950’s because those were the restless nights where in the absence of any insulation or air-conditioning, or even a breath of wind through the wide open windows and doors, the whole family would move outside to try and get some sleep.
These days there would be few people aware of such natural occurrences given the widespread dependence on their air-conditioned insulated homes they can return to in their air-conditioned cars from their air-conditioned offices.
This is where the use of “global average temperature hides needed data. If the clouds slow warming then exactly how much do they do such? The effect of the slowed down cooling could lead to higher morning temperature (or maybe not). Do these higher morning temperatures lead to higher daytime temperatures? Maybe, maybe not. You can’tell because the use of average temps hides the data. Certainly higher minimum temps will raise the average. But if maximum temperatures are not directly dependent on the minimum temp then how do we discern that?
How do we know the less cooling has the same effect on temperature as more warming when all we have is averages?
Phil,
Thank you. You are among the few people who not only understand this, but know enough to write about it.
If there was a moment of awakening for me, it was in my young analytical chemistry days ca 1965-70 when the Moon missions were returning lunar rock and soil for analysis. Several labs, mostly government and university, with top reputations and credentials were engaged. After the analysis came the inevitable round robin comparisons. Whereas, for example, some labs claimed their results were accurate to +/- 10%, many times the labs differed by N times 10% where N was a number usually between 0 and 9.
Simply, the self-described performance beforehand was not achieved by the tested performance after the event. You would need a book to explain the reasons why.
Note that the analyses were done (mostly, AFAIK) independently. These days we see model runs for climate models compared with many others in a process that seems to allow rejection of those that do not look “correct”. Unfortunately, there is no way I know to determine “correct” in this modelling work.
Some of the pioneering work on this lunar soil analysis was by George H Morrison, who had the skill to dissect and report it. These days, people like Morrison was are having to run a gauntlet of opposition to their “reveals”. Geoff S
If you were making a climate model from scratch, the very first question that you address is, “is the climate a dissipative or a conservative system?”
https://en.m.wikipedia.org/wiki/Dissipative_system
https://en.m.wikipedia.org/wiki/Conservative_system
It’s very clear that climate is a dissipative system. This branch of theory – nonlinear thermodynamics – was developed by Ilya Prigogine. It is central to understanding climate but is ignored since the simplistic climate warming model requires conservative equilibrium which in reality does not exist.
Clouds are dissipative structures with the persistence of emergent attractors. All climatic features have spatio-temporal structure, such as ocean circulation, atmospheric circulation cells, anticyclones, depressions, storms, sea ice, etc. They are all dissipative structures. To understand their behaviour you need to model them as such, not in the incorrect conservative paradigm.
The behaviour of dissipative and conservative systems is fundamentally different. For instance, in conservative systems the Onsager reciprocal relations apply between pressure and temperature.
https://en.m.wikipedia.org/wiki/Onsager_reciprocal_relations
But this is not necessarily so in dissipative systems.
Noether’s theorem is important here.
https://en.m.wikipedia.org/wiki/Noether%27s_theorem
Her theorem is about physical systems having their own conservation laws. It is connected with the “principle of least action” which states that any system perturbed by a changing parameter will respond to this alteration by changing its overall state as little as possible.
Quoting the wiki on Noether:
All fine technical points aside, Noether’s theorem can be stated informally
If a system has a continuous symmetry property, then there are corresponding quantities whose values are conserved in time.[4]
A more sophisticated version of the theorem involving fields states that:
To every differentiable symmetry generated by local actions there corresponds a conserved current.
The “conserved current” is an important part of Noether’s theorem. I suspect that it applies to atmospheric thermodynamics, such that the flow of heat into and out of the atmosphere from space is the conserved current. Therefore changing CO2 will result in minimum system rearrangement with no change to the overall in-out flow of solar heat energy, which is the conserved current.
See also:
https://ptolemy2.wordpress.com/2020/02/09/the-principle-of-least-action-calls-into-question-atmosphere-warming-by-co2/
Climate modelling is like Bandersnatch, to progress you need to make a series of correct choices. Failing to recognise climate as a dissipative system means that you’re out of the game at the very first choice.
Phil, I wonder why climate modelers don’t operate from the same understanding.
You might be interested in Jerry Browning’s recent paper on climate models. He posted a summary at Judy Curry’s site.
Jerry is a Ph.D. in applied math, who spent his career on Bounded Derivative Theory applied to atmospheric flows. His paper is very mathematical.
But his point is that climate models apply incorrect equations of motion, that would cause the model to blow up did they not also include large dissipations, such as their hyperviscous atmosphere.
His paper proposes the fix. If you enjoy deep math, he’s where to go.
Thanks Pat
Jery Browning’s paper is a very important insight, it’s hilarious that the modellers need to make the air as “viscous as molasses” to stop the atmosphere from “blowing up”. They’re just numerically crunching over-simplistic equations and applying all manner of tweaks and fudges to get a credible looking result. The core maths is in dire need of fundamental change.
The comment about turbulence is important (this is of course suppressed by their unphysical work-around of making the atmosphere viscous with too much dissipation). I’ve always wondered for instance if the emission height should be considered as smooth. What if it’s complex and chaotic with a 3D fractal surface? That might change heat flows. I remember many years ago seeing a paper where they modelled a supernova and found that the models stubbornly failed to work until the modelled the shock wave propagation from inside in a chaotic turbulent way instead of liniear. Then it worked. But I’ve no idea what paper that was.
Agree Phil. These modellers seem to be locked myopically into into their own complexities. They are behaving a bit like molasses themselves. Time they got out of the box.
Pretty much all research into climate physics ceased after the modelers took over, Phil.
Apart from the Lindzen/Choi Iris Effect hypothesis, I know of no other attempt to improve the physical theory of climate, since 1990.
The modelers have effectively destroyed the field, driving out the bona fide scientists. Tim Ball has a lot to say about that.
A sad day. They’ve cornered the limelight and the funding.
BTW the modellers’ excessive and blunt use of dissipation as viscosity does not I think mean that they are recognising the system as dissipative – in the Ilya Prigogine sense. Instead they are forcing a conservative system to dissipate and that’s where the problems are coming from.
Phil,
I will repeat my post from above.
The only way any results from a climate model could be trusted are:
The continuum errors in both the dynamical and physical equations approximated by the model are smaller than the truncation errors of an accurate (almost convergent) numerical solution.
Now let us discuss each of these requirenents in detail.
1. All current global climate models are approximating the wrong dynamical system (the hydrostatic system) of equations. This has been mathematically proved in my peer reviewed manuscript that appears in the September issue of the journal Dynamics of Atmospheres and Oceans and in another thread on this site.
2. The physical equations are approximated by discontinuous parameterizations that have large continuum errors and that violate the necessary requirements that the continuum solution be expandable into a Tayor series. The necessary unrealistically large
dissipation needed to prevent the model from blowing up due to these discontinuities leads to a large continuum error and destroys the numerical accuracy as shown by the Browning, Hack, and Swarztrauber reference cited in the above manuscript.
3. As the requirements for a numerical method to converge to an accurate approximation of the continuum equations are violated,
the numerical solution will never be close to the true solution.
Thanks!
Governments are busy legislating life changing iniatives to tackle a problem projected by models which are incapable of projecting anything meaningful.
Meanwhile, it is becoming obvious that the climate of our water planet is contolled by water in one form or another. It impinges on the energy balance by interaction with short wave radiation and long wave radiation. It is involved in albedo via clouds, water, snow and indirectly ground albedo via rain and flora. It has a major contribution in energy transfer via ocean currents, winds and convection at the macro level and through its massive latent energy of phase change at the molecular level.
Yet carbon dioxide has been almost the sole focus of climate science for decades. While the alarmism has grown massively through hype, the understanding has not advanced at all. The science becomes less settled by the day. The scientists don’t like to discuss water and its clouds. They do not understand it and cannot model it. They do not recognise that this fact renders their projections useless.
Clouds are the elephant in the room. move along, nothing to see here.
Thoroughly agree. I think this goes back to the inauguration of the IPCC which was given the SPECIFIC remit to assess the risks of anthropological CO2 emissions which in essence removed the need to deal with the climate as a whole.
It is not surprising therefore that risks were found; as otherwise the IPCC would have been disbanded.
To me the most grievous ERROR perpetrated by the IPCC was the statement that water provided a POSITIVE feedback to its calculations of the GHE. This done by deliberately or otherwise by ignoring the thermodynamics of water, particularly at its evaporative phase change which occurs at a Planck sensitivity coefficient of zero.
This last statement opens up a large area of debate and discussion; but sadly, due to the politicisation now apparent this has been well suppressed as considered part of the sceptical camp.
The principle that for every force or influence an opposing force or influence is generated somehow appears to have been lost amid the complexities.
Good post. Thanks to the commenters for the interesting discussions within the comments.
My request: How about some of you engineers and physicists well learned in thermodynamics and phase change please weigh in. Be detailed and thorough and explain in terms for those that may be less knowledgeable. Phase change seems to be needing a helping hand in understanding clouds. The details in the cloud issue is ready to be solved.
I’ll have a go eyesonu; but my computer presentation techniques are very substandard and to date I can’t put the images I have into these comment sections. They are .ipg images and I don’t have the url. Can anyone help? Just hope the solution is simple as I have fat fingers.
Regards
Alasdair
As mentioned earlier, there is an excellent post here:
https://notrickszone.com/2020/09/11/austrian-analyst-things-with-greenhouse-effect-ghe-arent-adding-up-something-totally-wrong/
The author uses real NOAA airport cloud observation reports and finds that cloud cover is associated with higher temperatures, suggesting strong long wave warming. The is not what the conventional wisdom (based on models) expects and the finding undermines the whole importance of carbon dioxide as an agent for warming.
The paper discusses the role of clouds in warming and cooling and I found it informative and entertaining.
SC
Yes there are a lot of really interesting implications of Erich Schaffer’s paper.
It’s counter-intuitive that clouds warm, we all experience that they cool us on a sunny day.
At night of course they trap IR – but even in daytime they also downradiate IR.
Clouds are in the end just another form of energy.
Solar energy evaporates water which makes clouds.
Miskolczi recognised this and suggested looking not at atmospheric temperature but air energy content including temperature and water content, involving Virial theory.
For some reason he was of course violently pilloried for this – from a mixture of racism and political chicanery – defending a lucrative catastrophist narrative.
Schaffer’s discovery that clouds exert net warning changes our understanding of ENSO in the equatorial Pacific. Generally the east equatorial Pacific is cloudy during el Nino and clear during La Nina. This has been interpreted that the sea loses energy during el Nino and gains it during La Nina. But it could be the opposite.
“… Miskolczi recognised this and suggested looking not at atmospheric temperature but air energy content including temperature and water content….”
Once that energy is captured and contained within the water vapor in the air it is only temporary as that parcel of air will sooner or later convect upwards to radiate above the emission level. It’s the energy storage mechanism for the formation of the thunder heads or major storms. It’s just a temporary pause but would possibly skew the temperature records.
I agree that the water vapor energy (in its vapor state) needs to be included in any temperature records or they are not fit for purpose.
You seem to be talking about enthalpy. All the climate models try to use temperature as a proxy for enthalpy but it is a poor, poor proxy. You’ll never get a complete picture of the physics with temp as a proxy.
Too true Tim.
At evaporation water increases it’s enthalpy by 694 Watthrs/Kg; but the temperature remains constant, for example.
Consideration needs to be considered as to what put the clouds overhead. Were they brought in from an air mass that was warmer and had a higher moisture content from another region? Also the very cold waters in the Aleutian Islands, it would seem to be reasonable that warmer clouds aloft with a corresponding lower air mass would cause warmer ground temps.
To your last point – yes.
However the Aleutians were chosen as a place where the climate models were showing the highest negative correlation of clouds and temperature – a cloud cooling effect. And the data showed the reverse.
“While we do know that clouds will likely amplify global warming…”
LMFAO.
Just exactly how do they “KNOW” that?! Envelope to the head ala Johnny Carson?!
Or perhaps the same way they “KNOW” that rising atmospheric CO2 will “drive” the Earth’s temperature, something it has never been empirically demonstrated to do.
Only in so-called “climate science” are ASSUMPTIONS treated as if they were FACTS.