Guest Post by Willis Eschenbach
After my last post about the surface warming of the ocean, entitled “How Global Warming Isn’t“, I got to thinking about the warming of the upper part of the ocean. So I got the data for the ocean heat content (OHC) of the top 700 metres of the ocean from the marvelous site, KNMI. If you look under “Monthly Observations” you’ll find a host of most fascinating datasets. Under “Heat Content” on that page, you’ll find the National Oceanic Data Center (NODC) 0-700 metre depth OHC data. And down at the very bottom of that page is a link that will download a 196 megabyte gridded NetCDF file containing the data that I used. (Big file, click at your own risk.)
And what did I find? Well, I’m a visual kind of guy. I mean, I can do the math, but it only makes sense when it comes up as a picture on the silver screen. So here are my graphics. I’m interested in the changes in the oceanic heat content, so these are two views of those trends.


Figures 1 & 2. Decadal trends in oceanic heat content, in exajoules (1018 joules) per decade.
I love climate science because I’m continually surprised by what I find. What could be better? It’s like Christmas every day.
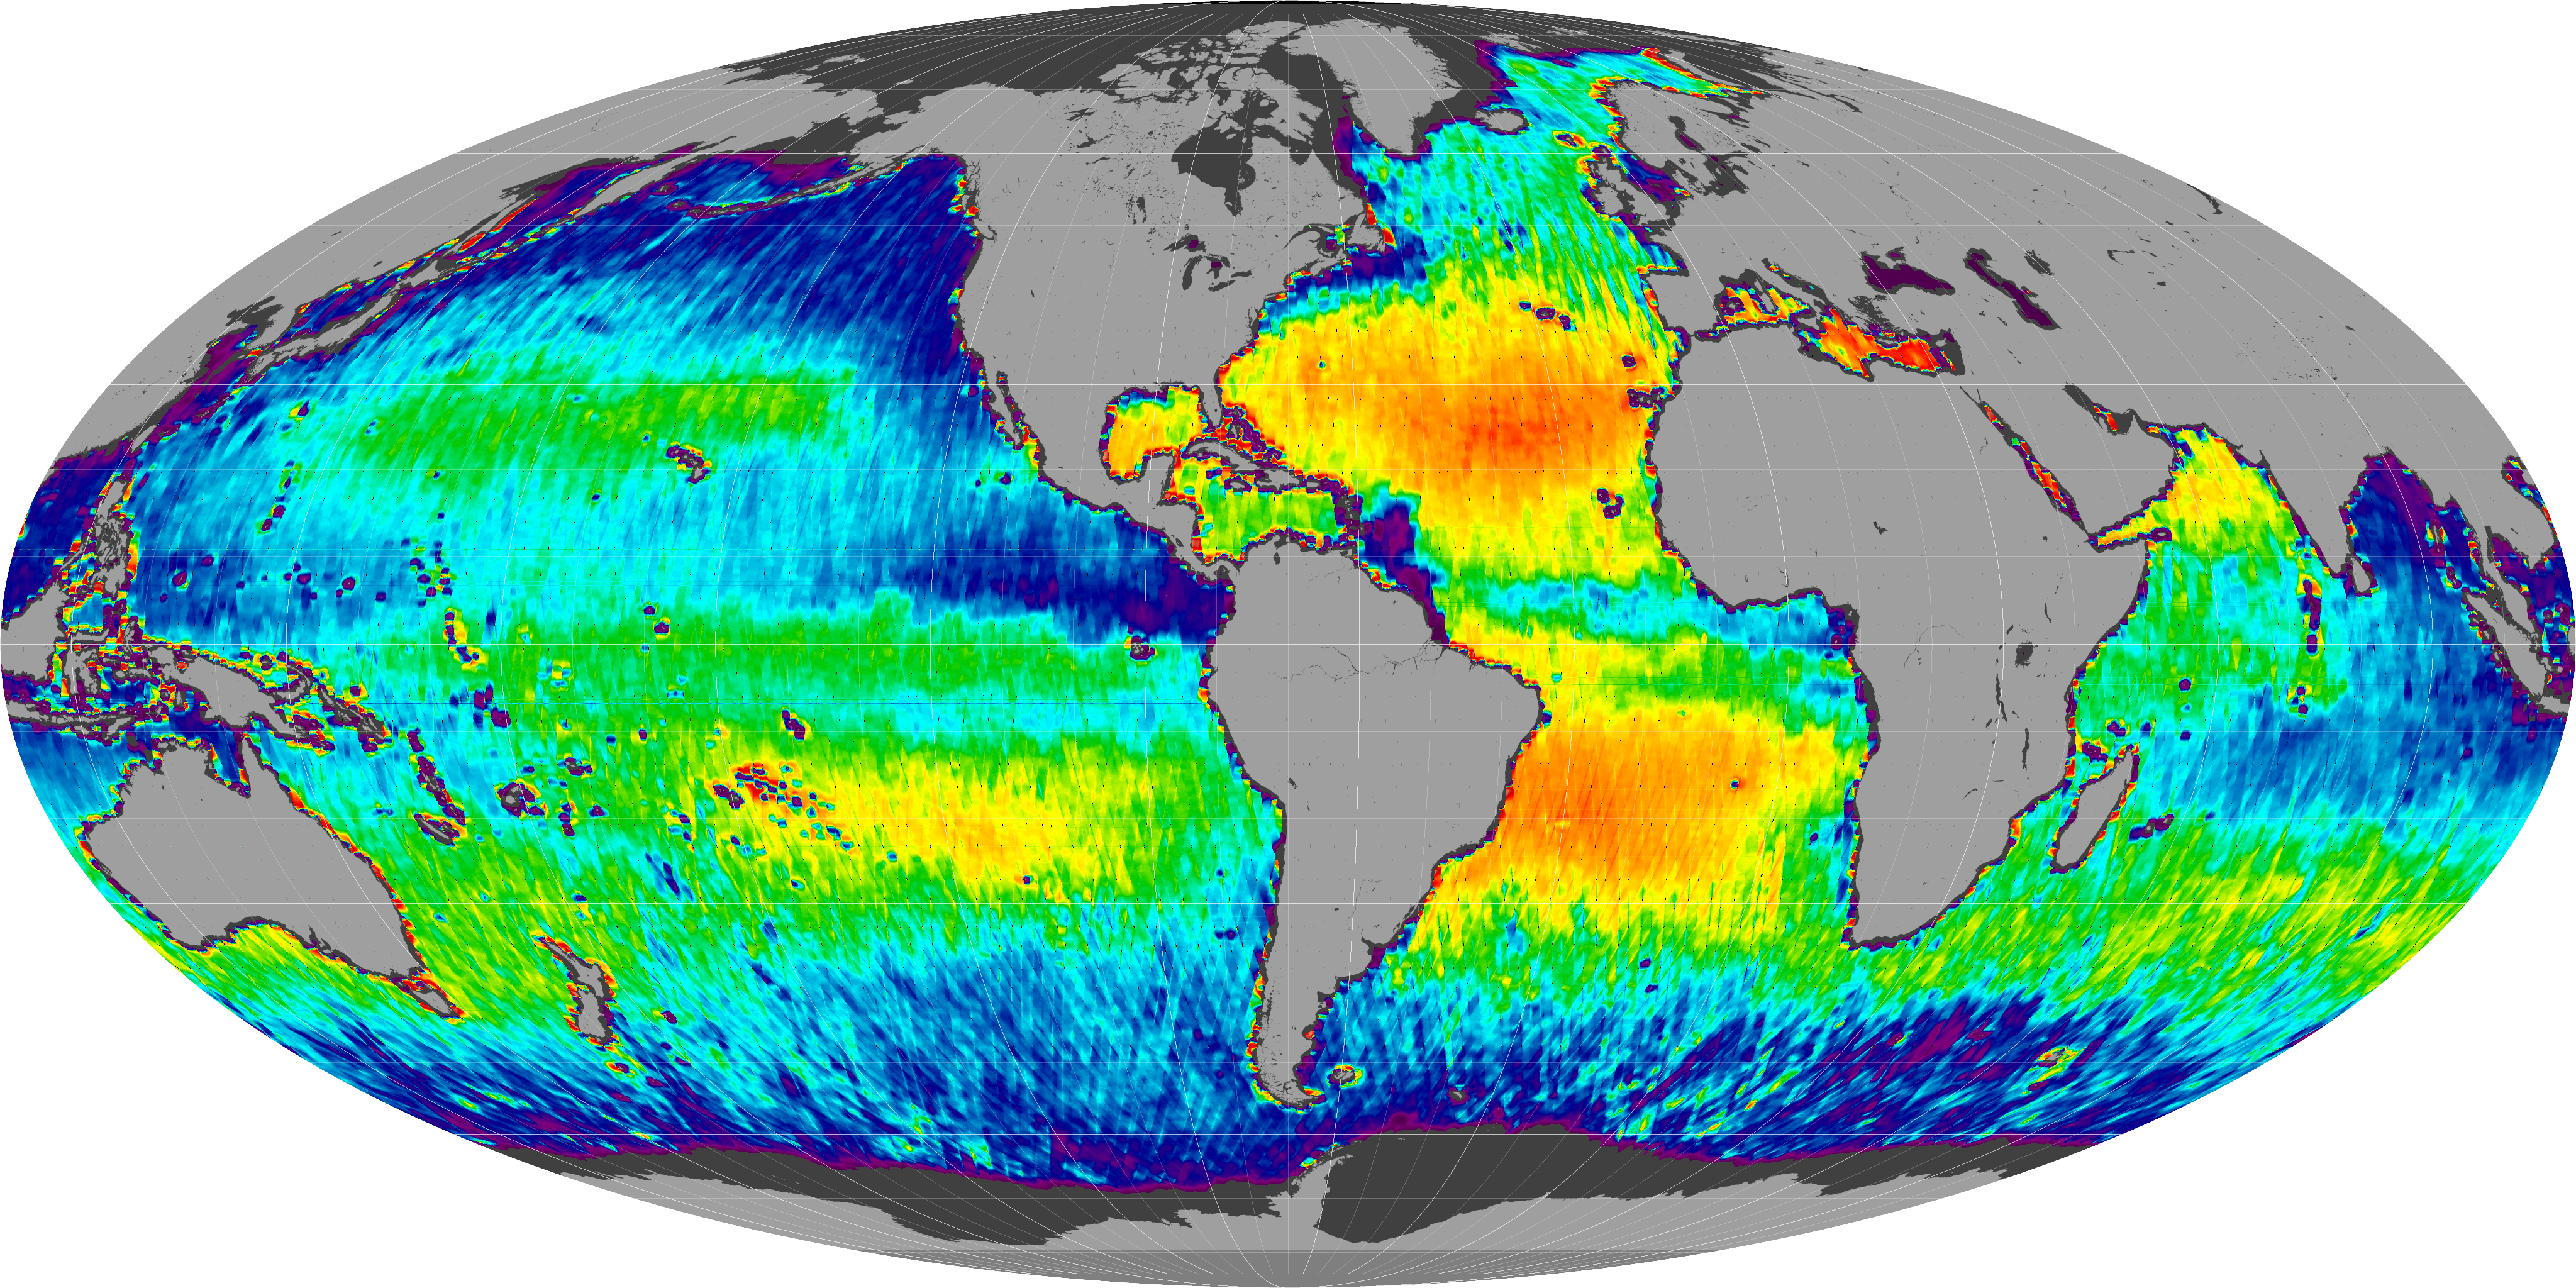
My first surprise? There’s a line of giant oceanic slow whirlpool-type eddies that I’ve seen before. They start at the southern tip of Africa and extend down under Australia. I knew about them because they’re visible in graphics of satellite sea-surface height data. But what I hadn’t realized is that these eddies are mixing warm surface water down into the depths. This is indicated by the orange/yellow line of increased undersea heat stretching from Africa under Australia.
And when you mix some warm surface water downwards, other cool deep water has to come upwards … as indicated by the corresponding line of areas just south of the eddies encircled by black/white lines, showing areas that have actually lost heat since 1955. Who knew? Certainly not me.
What else surprised me? The turbulence of the Gulf Stream as it interacts with the ocean floor topography along the East Coast of the US is also mixing warm surface water downwards … and the corresponding upwelling of cold subsurface water is occurring just south of Greenland.
I’ve long wondered how less-dense warmer water could mix downwards into denser cooler deeper waters … well, there are a couple of places where it is happening.
To close out, I took a look at the actual temperature change represented by those exajoules of energy changes. I mean, just how big is an exajoule when it’s at home? I’m sure I don’t know.
But like I said, I can do the math. So I converted the slow increase in exajoules of heat content into degrees Celsius of slow warming. Here’s that result:

Figure 3. Global ocean temperature change, surface to 700 metres depth from 1955 to 2020
A quarter of a degree in a half century?
Now I keep reading about how fish are changing their locations in response to oceanic warming. But it seems extremely doubtful to me because the changes have been so small. Over the last fifty years, the ocean has warmed by about 0.005°C per year … and call me crazy, but I’m just not believing that the fishies and other underwater denizens are so temperature-sensitive that a change of a quarter of a degree in half a century will make them leave their happy homes.
For one thing, in the open ocean, the vertical temperature change is often on the order of 1°C per 40 metres vertical or so. Here are some Argo float profiles of the top 200 metres.

Figure 4. Vertical temperature profiles of the North Pacific, Argo float data.
And that means that if a fishie or other subaquatic denizen goes up or down by ten metres or so, it’s already endured the dreaded quarter-degree temperature change …
Add to that the fact that many millions of oceanic fish, shrimp, and copepods migrate every night from 800-1000 metres depth up to around 100 metres depth, and then go back down at dawn … which means they happily endure 5° – 10° of temperature change every night. So I doubt greatly that they will be bothered by a quarter of a degree temperature change in a half-century.
And by tonnage, this daily vertical migration is the largest movement of living creatures on the planet … so we’re not talking about a few fish here and there.
This is the bottom line. If the world’s creatures, both on land and at sea, were as temperature-sensitive as the alarmists would have us believe, those beings (and we humanoids as well) all would have gone extinct long ago. And near as I can tell, that hasn’t occurred … at least yet.
My very best wishes to all living creatures, terrestrial and aquatic alike,
w.
As Always: I ask that when you comment you quote the exact words you are discussing, so we can all know both what and who you are responding to.
A Final Note: In addition to daily traversing the five degrees or more temperature range, it’s worth noting that when the millions of tonnes of aquatic creatures travel from 1000 metres to 100 metres depth and back down every night, they undergo a pH change of about half a pH unit.
In other words, every night they undergo a greater pH change than we’re expected to see in the ocean in the next century under IPCC assumptions. You know … the dreaded pH change that’s supposed to kill oceanic creatures by the millions. But instead, as Darwin is rumored to have mentioned once or twice, living creatures have evolved to … well … survive.
Willis,
The usual brilliance of topic and data interpretation!
It just occurred to me that not just humans, but most species, are evolved for the tropics! During the Age of the Dinosaurs the tropics were greatly expanded, and the temperate zones were pushed far towards the poles! The non-tropical species are the outliers, so why would we NOT want a slightly warmer world?
Thanks for leading this old horse to water, and getting him to think!
Dorothy Parker, on the subject of horticulture:
“You can lead a horticulture, but you can’t make her think.”
An atmosphere creates a thermal resistance, R, just like all those batts of insulation down at Home Depot. That’s what makes the surface warmer than the top of the atmosphere just as R makes the inside of the house warmer than out. Or cooler in Phoenix.
Picture a large south facing window. The solar energy just pours in, heating the room. Draw the draperies. Is the room cooler now or warmer? By reflecting the solar energy the room is
cooler aka albedo.
Picture a large north facing window. It’s 20 F outside. Heat from the room is just pouring through that window running up the heating bill. Draw the draperies. Is the room cooler now
or warmer? The thermal resistance, R, of those curtains slows the heat loss and lowers the gas bill.
Same draperies, two different results depending on the application.
The atmosphere/albedo cools the lit side and its R warms the dark.
That’s NOT a greenhouse effect and carbon dioxide/GHGs are NOT involved.
I have a large open-area semi-split first floor. The equivalent of eight windows and one large patio door – from East to South to West in the main area.
The weather could be -30C outside in the winter, my heat is set at 15C for 24 hours when it’s sunny. The full house is warmed, even the North-East room elsewhere. The basement is set at 18C.
And my bedroom (West-South) is set at 10C all winter. Never a problem.
The sun-generated heat mixes in everywhere although I do wear socks but not a sweater. Because I walk through the house, I move the heat with me. And at night, it’s the heat from three lamps.
I just don’t understand all the crap about ‘green’ reconstruction of buildings when all you need are windows.
PLUS, at bedtime, you don’t want a hot room because the heat you generate in bed is sufficient to sleep well.
QUOTE: “And that means that if a fishie or other subaquatic denizen goes up or down by ten metres or so, it’s already endured the dreaded quarter-degree temperature change “
Cooling and warming are the wrong words. Curtains, blanket or what ever are inanimate objects. They can not do an action or activity. They can reduce the heat flow through thermal resistance. In the first case the heat inflow from radiation is reduced. with the latter case the heat outflow is reduced. Note that the second law of thermodynamics always applies. Heat only flows from hot to cooler. The alarmists have fooled people by talking about warming. CO2 does not warm or cool. CO2 absorbs a very tiny portion of the radiation spectrum at around 14.8 micron wavelength. It also radiates at that wavelength (around 220K) to space. Clouds which are composed of droplets of water and particles of ice are much more important affecting heat flowing to and from the Earth’s surface. Not only is there heat flow by radiation affected but also by convection and phase change ( condensation -which gives off heat, evaporation which takes in heat, and fusion to and from ice which similarly gives off and takes in energy)
Spot on. CO2 absorbs and re-radiates (in all directions) energy as does water VAPOR. Neither are insulators or heat flow “resistors” as insulation is. Analogies to greenhouses or blankets lead to bad science and misunderstanding. Look up Feynman’s interview when he was asked to explain the repulsive force between opposite magnetic poles.
https://youtu.be/MO0r930Sn_8
He explains that answering the “why” of observable phenomena requires some basic scientific understanding of fundamentals. For the atmosphere, thermodynamics and radiative physics, for instance. Not greenhouses and blankets.
Feynman’s response was painful. He was vamping, while trying to figure out what the cognitive disconnect was, and in so doing just made it look like he didn’t know what he was talking about. But his final statement was dead nuts: I can’t explain it in terms of anything you’re more familiar with. He could have just said: “It’s like an axiom in logic, or mathematics. It just is, and can’t be proven in terms of anything more fundamental.”
Hello Willis,
“they undergo a salinity change of about half a pH unit.”
Do you mean a change in pH or a change in salinity? Both do change with depth.
pH, my bad. Thanks, fixed. I love writing for the web, the half-life of my errors is measured in minutes.
w.
Willis – maybe a bit off-topic, but you talk about a 200MB file as being “massive”.
I know you live in the sticks … not sure how far out, but I get the impression that wherever it is, you are getting somewhat poor Internet service if you consider files of that size as massive.
You may want to take a look at Starlink. They are slowly rolling out production service, and it seem to be running up to 200Mbps. Might make your life easier.
Just a thought.
Thanks, Philip. I was saying “massive” to avoid problems for the poor folks on slow service. I also wanted to warn people working in say Excel that they’ll have some issues with file size …
Me, I do live in the sticks, but somehow I’ve ended up with fiber to my desktop. They advertise it as a 1-gigabyte service, but my typical upload/download speed is only about 940 Mbps … don’t think I’ll ever complain about that.
w.
Ah… Excel … yes, I know what you mean. My job has be analyzing data that comes in multi-GB log files from time to time. Even after paring it down to just the basic info that I need, it’s still thousands (or even tens of thousands) of coordinate points. Excel sits and looks at these files for a L O N G time before dying. Gave up on that a long time ago. Gnuplot works very well, and I have neve been able to hit it’s limits yet.
Phillip, Willis thinks it is “massive” because he does not have experience with large data files. Wait until he encounters a multi-terabyte one!!!
Well , that was a pathetic attempt at dog-whistling, Dog-tag !!
Roger the LHC data grows at 90 terrabytes per year and what you call massive is less than a days data. Yes there is big data and as usual your comments are meaningless and vapid.
Even when it’s in bits ?
Roger – please stop boasting about the size of your stack. I’m sure it’s very nice but probably not as large or impressive as you seem to think.
Absolute ignorance and arrogance on display by taguchi.
Unable to argue any of the facts so attacks the author.
Perhaps that deserves an antisocial commenter warning?
Don’t forget the pressure changes the aquatic creatures also can endure. Every 10 meters of ocean depth increases pressure by one atmosphere. Not only can they endure that, but they never get the bends either because there is no nitrogen in their bloodstream to decompress.
“no nitrogen in their bloodstream to decompress”
Interesting! I was wondering about that. So what about marine mamals who breath the air? How do they avoid the bends? Some dive deep and fast.
They do not breathe underwater. The trouble starts when you are deep and your air supply needs to be pressurized to balance the ambient pressure. So you start breathing air at high pressure and that is what saturates you to the point you get bubbles going up.
(Rule of Thumb: 0.5 psi for each 1 foot of depth, so 100 ft. gains 50 psi. pressure)
Trivia point:
N2 at high pressure acts like a narcotic, a diver can get seriously deranged mentally. This is another reason they use a helium mix.
“N2…diver can get seriously deranged..” Unlike climate terrorists, who get deranged on CO2 above the surface?
So Joe’s been deep diving without a helium mix for his whole 50 years in the capitol?
As you dive, the air in your lungs gets compressed. Your lungs actually shrink and your diaphragm moves up and in. The air in your lungs is within a few psi of the water pressure. Therefore, the nitrogen in that breath of air is also compressed. Free divers don’t stay down long enough to absorb much nitrogen into their blood. Whales and commercial deep sea divers do. I am not sure how the whales do it and not get the bends when they return from a deep dive looking for food. Deep sea divers live for weeks in pressurized chambers so they don’t have to spend all that time decompressing. Really, it should be called degassing. Helium is used in the mix to avoid nitrogen narcosis and because it is less soluble in our blood than argon or nitrogen.
It’s the Sperm whales that dive the deepest. Over 3,000 ft at times! And there is evidence that they do get the bends.
Even Sperm Whales Get the Bends – Woods Hole Oceanographic Institution (whoi.edu)
How do they avoid the bends?
=======
They are not breathing, thus there is no extra nitrogen to dissolve in the blood. The nitrogen they do have was dissolved at surface pressure so will not misbehave when they return to the surface.
A professional fish collector told me that they collect flame angelfish in deep water and have to use a needle to extract the air from it’s swim bladder or else it ruptures and the fish dies after they get it to the surface.
Different from the bends. Rapid pressure changes for fish with swim bladders never happens in nature. But not all fish have swim bladders.
I like to look at pictures too.
AMO GlobalAnnualIndexSince1856 With11yearRunningAverage.gif (880×471) (wp.com)
‘‘I’ve long wondered how less-dense warmer water could mix downwards into denser cooler deeper waters … well, there are a couple of places where it is happening.”
Saltier from a source of high evaporation therefore denser?
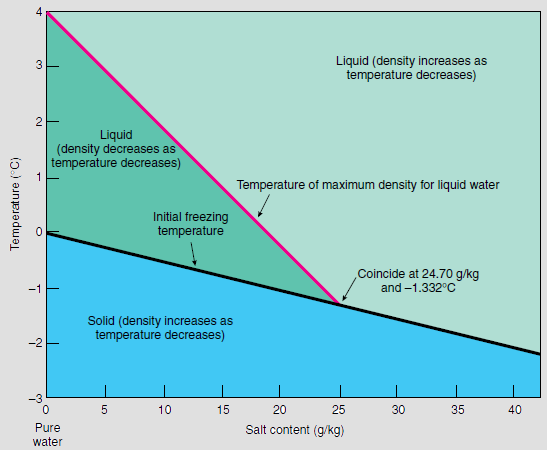
Water is weird:
.
Since water at about 39°F (4°C) is more dense than water at 32°F (0°C), in lakes and other water bodies the denser water sinks below less-dense water.
Which is why the oceans and lakes freeze from the top down.
And the density anomaly is one of the reasons life on earth is possible on earth
Sorry, got to say; is life on earth possible on Mars or Venus, for example?
Sorry no that isn’t why it freezes from the top Roger are you really that science stupid.
Perhaps start with a high school science study of how an ice skate works.
Here this image may help you idiot
Does that chart show sea water more dense at 39 F?
The density is irrelevant any body of water will freeze from the surface when cooled from above because the freezing point increases with water pressure. So the surface has the lowest freezing point of any other point in a body of water and when cooled from above will therefore freeze first … density is irrelevant. It’s basic there is no other way it can freeze when cooled from above the physics in that graph tells you that.
LdB, your idea is correct but your language is backward. The freezing point of water decreases with pressure, meaning it has to get colder to freeze. The surface has the highest freezing point, meaning it will freeze when it’s warmer than water under pressure. All of which means, as you claim, that water freezes from the top.
w.
Yes fingers got ahead of brain … you are correct increase and decrease backwards 🙂
Moral however unchanged water always freezes from top down and probably on easy way to change that is cool or refridgerate very fast from below.
water freezes from the top.
==≠===
But unlike most materials, solid water floats on top of liquid water, limiting further freezing.
Water also has many other properties essential to life. Largely ignored in the CO2 madness.
Without a doubt, water is the Earth’s climate regulator, with the phase changes limiting both cooling and warming.
The density is irrelevant
=========
No. If ice was more dense than water, it would sink when it froze and no longer insulate the surface of the water.
Typically solids are more dense than liquids. Water is an exception and it is lucky for us as the oceans would likely be filled with ice at depth otherwise.
Ferd, LdB meant that the water density is irrelevant. You’re correct about the ice density.
Regards,
w.
When it comes to sea water freezing, the density is totally relevant.
Pressure is not relevant.
The changes in density or freezing point with changes in pressure are trivial at normal pressures anywhere near the surface.
What matters is the relative density of water and ice at varying salinities and temperatures.
Sea water does not exactly freeze from the surface down.
Ice crystals form, then sink due to being more dense.
Then, as they grow and salt is excluded and the water becomes mostly fresh with less and less salt, the crystals rise to the surface.
But it is very complicated.
Frazil ice can and does freeze onto subsurface structures and accumulate, and causes large amounts of damage in certain situations.
And brinicles form and grow along the sea floor.
Anyone saying different is talking off the top of their head without actually checking to be sure they are correct.
Since there is no such thing as pure water in any natural body of water, the impurities have a far larger effect than pressure ever could, but it is insignificant compared to the difference in density caused by the phase change and molecular realignments.
The pressure under a ice skate blade is not relevant to what happens when ice forms on a body of water on Earth.
Or in an ice cube tray.
If it is a cold freezer, ice will form at the top, but also all along the sides and bottom…wherever contact is made with a cold solid object.
The place where that phase diagram juts to the left between solid and liquid is like Marianas trench type pressures.
Always best to check facts before insulting people.
The idea that pressure melts the ice under a skate is a 19th century hypothesis that is not supported by physics.
See the money quote below in the picture.
Unless you weigh about 1400 kilograms or more, it is not the pressure melting the water under an ice skate.
That idea is debunked rather convincingly by several research papers and some unassailable physics.
It is just that few people ever look anything up after they learned it in fifth grade to see if it was really still true in the actual world of science.
And then people publish phase diagrams that bear no relationship with reality.
So it is perhaps understandable if one does not poke a little deeper.
“According to the article, “Pressure Melting and Ice Skating”, published by a geophysicist, Samuel Colbeck in 1995 in the American Journal of Physics, the decrease in friction could not be due to high pressure-induced reduction of the freezing point. He explained that at 0 °C, for every additional pascal of pressure exerted, it would only cause a decrease of 7.37 x 10⁻⁸ °C in the melting point of water, due to the pressure-melting effect. Therefore, if we are skating on a -1 °C ice surface and we want to lower the melting point to -1 °C, by calculation, a pressure of 1.4 x 10⁷ Pa (around 140 atm) is necessary. Assuming that the contact area between the blades and the ice surface is 10 cm2, to exert the equivalent pressure2, the weight of the skater must reach 1400 kg. We clearly know that it’s impossible, and that’s why the melting caused by pressure change is not a convincing reason to explain why we can skate freely on ice.”
sciencefocus.ust.hk/extraordinary-science-the-mechanism-of-ice-skating
Yeah, and here is them brinicles, showing that it is definitively not true that ice can only form at the top.
No source of info shows the ocean freezing that way.
We just see the ice after the frazil floats to the top after excluding the salt.
(2) ‘Brinicle’ ice finger of death (Tipper – Trenched) – YouTube
I do not know where that phase diagram came from, but at the sorts of pressures at and near the the top of a river or lake on the surface of the Earth, pressure is not a significant factor, ice skating notwithstanding.
That diagram is wildly out of scale. Or something.
Here is a high resolution phase diagram for pure water:
The image above is a vapor pressure phase diagram for water. It has nothing to do with density.
Never said it did.
Someone said pressure determined freezing point.
Roger, you say:
Well … no. That’s only true of fresh water at surface pressure, where maximum density is at 3.98°C. But water density is a complex function of temperature, pressure, and salinity.
For typical sea water (salinity = 35 g/kg) at surface pressure, it’s densest at -3.77°C.
For fresh water at 1000 metres depth, it’s densest at 1.95°C.
And for seawater at 1000 metres depth, it’s densest at -6.02°C.
Well … no.
Lakes and the ocean freeze from the top down for the reason given by LdB below—freezing temperature decreases w/pressure for both fresh and saltwater, so the layer under the least pressure (the surface) freezes first.
For example, fresh water at the surface freezes at 0°C. 10 metres down it freezes at -0.01°C. And sea water at the surface freezes at -1.91C, but 10 metres down it freezes at -1.92°C.
But heck, keep pretending you understand this stuff and can lecture us.
w.
.
chuckle 😉
Roger the dodgy !
Whoa…wait a second.
One hundredths of a degree?
And what is the salinity variations, and other chemical differences, and how much effect do they have?
More then 0.01°C in many if not most places.
You posted the maps of salinity variations yourself.
Any impurity in water, or in anything else, cause freezing point depression and boiling point elevation. Basic physical chemistry.
It does not even matter what the impurity is.
Sea ice freezing is a complex dance of factors, including the salt being excluded from the ice crystals as they grow.
Including the fact that…..wait for it…
Water freezes from the top because that is where the cold air is!
And it stays there because ice is less dense than water.
(For fresh water)
Substantially.
And there is no heat sink 1000 meters down to make the water freeze down there. To get a phase change, one must have a place for a whole lot of energy to go.
Unless the water is supercooled down there…and then it can freeze suddenly all at once.
I suspect it may be in places supercooled, especially if some chemical alteration takes place and some shock forces the reaction.
Imagine a few tens of cubic kilometers of water at the bottom of the ocean suddenly freezing due to having been supercooled and then shocked.
What would happen?
Welp, that ice would explode catastrophically up to the surface, and would perhaps cause a chain reaction with any and all supercooled water down there.
Spreading across the entire world ocean!
And then we would have the entire ocean flipping, bringing freezing cold water up; and mixing the warmer top layers down.
The result would be a true ecological catastrophe, and may be enough to …trigger an ice age? Definitely…and then some!
All the warm water is now mixed with freezing cold bottom water, .
Krikey!
I think I got a movie script here!
You all seem to be under the impression that those density curves stay the same with water has varying amounts of salt in it.
Hint: They do not stay the same, at all.
We had a long discussion on this years back, and at the time I was the only one, it seems, who ever retrieved the relevant graphs and posted them here to discuss.
I was new here at the time, and IIRC, it was another Mr E thread.
Reckon I will have to dig them out again.
Here is a little collage of a few I was able to find right away in my files:
Whoops…hit post instead of attach button. Here it is:
Hmm…seems in my haste I put one of them on there twice, and missed a few others.
Here is one more, but these are not the best ones, IIRC:
No, we’re not “ALL” under the impression that the “density curves stay the same with water [that] has varying amounts of salt in it“. As I specifically said:
Others think they stay the same. I don’t. But then I don’t just read the books and look at the graphs.
I do the math and generate the graphs.
w.
I was not including you in “all”, Willis.
You are seperate.
I actually meant it more like “y’all”, then “you all, each and every one of you”.
🙂
Thank you, sir …
w.
And note I did say it only seems that way…which manner of speaking I always try to remember to do because you know my brain tumor and all…
Sometimes I get sgniht ecaxtly wackbards.
Here is how you can tell if I was directing a comment at any particular person: That is the person I am replying to.
I do not read through the entire thread before responding to something.
The person I was addressing is the person or persons I replied to.
Y’all.
Also important to note that the process of freezing sea water is a complicated thing because as the water begins to freeze, it excludes more and more of the salt, which has to go someplace else…like down.
So there are tentacles of hypersaline and ultra-cooled water extending downwards from sea water in the process of freezing.
And sometimes heavy precip adds a layer of fresh water on top which starts out as snow, and this can sometimes jump start the whole process.
Brinicles are amazing, and we have posted and discussed them here often.
And the stages of freezing seawater undergoes is a whole subject of study in itself.
BTW…pressure has no effect on the freezing point at normal pressures.
Water is incompressible.
See the phase diagram for water, attached below.
The line between solid and liquid is vertical with respect to pressure.
It freezes from the top down in freshwater bodies and ice cube trays because ice is less dense than water.
Water becomes more dense as it cools, like almost everything, until it reaches about 4°C, at which point it begins to become less dense due to the molecules beginning to line themselves up into the positions they assume in ice.
The polar nature of the molecule forces them apart as the charges line up.
Still trying to find the same phase diagram for salt water.
Anyone? Anyone?
Bueller?
That temp of 4°C is important in physics, and the metric system.
Because a gram is defined as the mass of a cubic centimeter of water, at it’s max density temp of 4°C
Look up frazil ice and grease ice to find reading material on the stages of ocean water freezing.
Then Nilas. Nilas is frozen water that bends without breaking around waves.
Nilas:
Grease ice:
Frazil ice:
Willis, do you know the Indonesia Military is crediting/blaming “giant undersea waves” for the loss of their submarine. Do you see any evidence of a temperature or pressure change gradient that cold create “giant undersea waves”? NO? Never mind.
Sometimes known as “soliton” waves. they are thought to form and propagate between layers of different density. Because the absolute change in density is relatively small, the wave height can be quite large.
Well, The Guardian often reports “marine heat wave” events.
(which of course are always “worse than we thought”)
So it’s not inconceivable that an apocalyptic instantaneous temp or pressure change gradient could create giant undersea waves.
(Caused of course by manmade CO2 in the atmosphere).
I also take this opportunity to thank Eric Worrall for reading The Guardian as assiduously as he does, and informing us all here of what their daily tosh was.
Eric is really taking one for the team by doing this.
I for one don’t possess the extra reserves of brain cells that could withstand the relentless dumbing-down that The Guardian inflicts upon its readers.
I have been struck by one while oil field diving in NW Australian waters. At a depth of 420 feet in clear water with no current a dark shadow at the extent of visibility appeared. When it arrived I estimate the current at six knots and no visibility. On getting into the dive bell it was hanging out at a fifteen degree angle. Somewhat unsettling. Certainly enough to upset a subs trim.
Everyone, the correct test for this giant undersea wave business is to see if the sub imploded (torn edges bent inward) or exploded (bent edges outward) I’ll take exploded for a million. Wait for it.
Saw a thingey once, showing a constant string of giant vortices forming around Cape (Town) Point and swirling off in conga-line towards South America. The graphich showed what can only be described as gigantic underwater tornadoes, submarine weather par excellence. I remember the location/s different from your graphic, but then I remember, We are talking about two totally different phenomena, yours being static over time. What a simple way to present so much data! Kudos.
I am obviously biased towards seeing a warm line along my (possibly fictional) ‘marine tornado path’. The question is; how many other such “geospoons” are there really? Disregarding all the many other processes stirring the seas, one must not forget that the ocean at the equator is moving at a thousand miles an hour, dragged by the moon against continents moving at a thousand miles an hour. Even granma can tell you things crashing at high speed always is worse, even if both cars were going in the same drection. Continent, meet tidal drag… that’s one hell of a stirring action right there.
The vortices that track from S.Africa diagonally SE >>NW to N Brazil are amazing – was on a ship that pirouetted 360° in about 40 minutes ( complete with a 1 km seismic streamer) off the coast of Venezuela. A bit disconcerting …..
Went down the rabbit hole of ocean circulation after the event – fascinating.
So I did not mysremember; Cape Point to Rio? I was slightly disapointed to see Willis’ vortices so for south. But if you look with a squint, it seems then, the warm Indian ocean water is being transported to Brazil, like the entire southern section of Africa acts as one large but surmountable obstruction to those El Nino currents?
My comment doesn’t address W.’s article. I wonder how the copyright notice that says “may not be stored or archived separately, rebroadcast, or republished without written permission” comports with the “Share this” line of Print, E-Mail, etc, at the bottom of the article? Should I hire a lawyer since I have both shared and archived material from wattsupwiththat.com?
Robert
I think that the intent is to have some legal leverage against people who might use material in a manner that Anthony doesn’t approve of.
Everyone on the internet posts links all over the place to other sites and whatnot.
That was the original basis of the google search algorithm…more links meant higher placement in search results.
Sharing links is how we make sure things get seen.
I think it refers to copying it and posting it somewhere without attribution.
Posting links simply directs more eyes to this site.
“Over the last fifty years, the ocean has warmed by about 0.005°C per year … and call me crazy, but…”
Well, 5 C in a thousands years is CAGW type stuff.
As is .5 C in hundred years.
I sort think the entire ocean “can’t” warm by .5 within a century. And I still don’t think it happen.
But it seems ocean going from average of about 3.5 C to 4 C or to 3 C is huge change to occur within couple centuries of time.
Or my guess is the Holocene Maximum was as much a 4 C ocean. And warmest Eemian got was about 4 C [or maybe more].
Willis: “Add to that the fact that many millions of oceanic fish, shrimp, and copepods migrate every night from 800-1000 metres depth up to around 100 metres depth, and then go back down at dawn … which means they happily endure 5° – 10° of temperature change every night.”
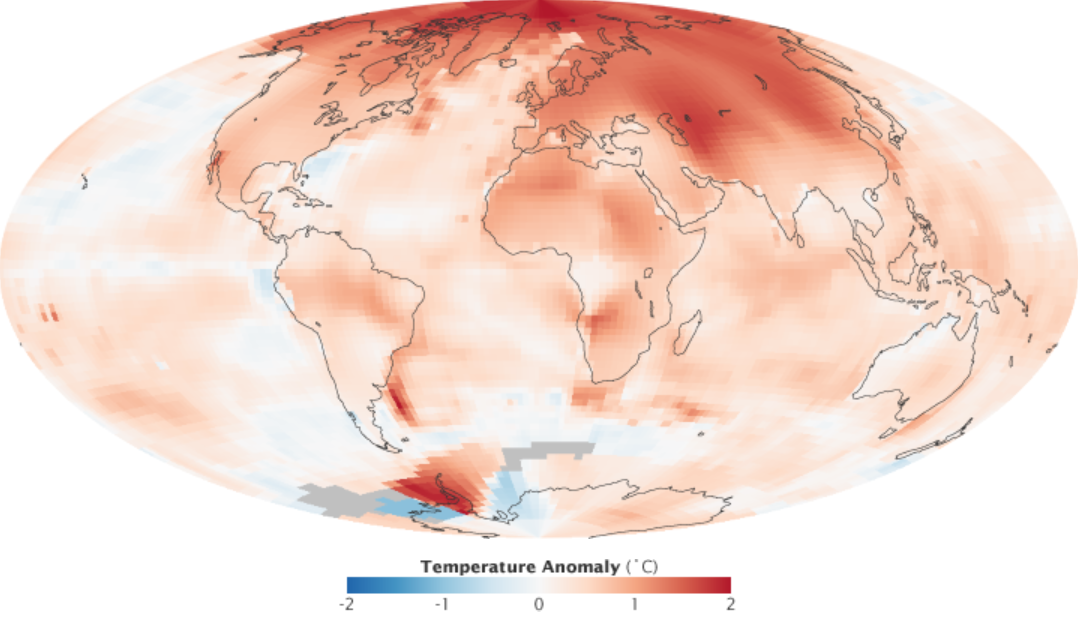
WR: we can add the yearly summer/winter temperature differences: most of the oceans show large differences in summer-winter temperature: from 2 degrees even up to 24 degrees. Without any disturbance.

Text figure: Global ocean temperature contrast between winter and summer months, which were designated based on the mean seasonal temperatures measured with the AVHRR satellite. Data were taken between 1995 and 2005. The grey shades on the land masses indicate human populations (dark grey = high human populations).
Nice, Wim. I’ll have to make up the equivalent using the CERES data. To be continued …
w.
Win, interesting! The very minor change in the southern polar regions, (0 to 4 C) compared to the very large, up to 24C!! swings in the northern poleward regions.
On the face of it, swings that large as shown, are not easily understood. The base winter T may be what, 29 F at the extreme?
Regardless there is no doubt a lots of energy leaving the oceans on some of these extremes. And it would be fascinating to compare this to the CERES data, thanks to Willis.
Which reminds me, what are the error bars in this upper ocean .25 C warming? And a further question for anyone, is it even possible for the SST variance, and the 2 m atmosphere surface T to decouple?
If the answer for the most part is “no”, then any lower troposphere surface warming is limited, or tightly constrained to ocean warming.
David A: “The base winter T may be what, 29 F at the extreme?”
WR: At first sight the very small amplitude between summer and winter temperatures of the polar oceans surprises. It is the system of sea ice that keeps temperatures year-round near zero Celsius (-1.8°C or 29F). Seawater freezes at minus 1.8 degrees Celsius. Below sea ice -1.8°C will be about the temperature of the seawater. When the summer arrives, the melt of sea ice uses a lot of the energy brought by the Sun: surface water temperatures don’t change much. At mid-summer in the Arctic and Antarctic there is still a lot of sea ice left:
https://ads.nipr.ac.jp/vishop/#/extent
(click on Arctic and Antarctic)
When nearly all sea ice is gone (in the Antarctic around half of February), the Sun is also near leaving the south pole.
The moment sea ice is covering the oceans, the mixing of water below the ice is constrained. Below the ice water will stratify, further constraining ocean heat loss. And often sea ice is covered with insulating snow. Over polar areas a lot of low clouds are found, constraining radiative heat loss. These examples of what I call ‘horizontalization’ in the ocean-atmosphere system, diminish both heat loss and heat gain and as such prevent high fluctuation of ocean temperatures around the poles.
Willis explained well that the ‘verticalization of warm humid air’ in the tropics (thunderstorms) limits the ocean temperature at the upside to 30 degrees Celsius. The system of horizontalization (insulating) and verticalization (the ’emergency exit’) are part of the solid system that controls surface temperatures, especially at the extremes.
At the mid-latitudes we find the largest temperature swings. Here the role of the Sun is larger and the role of sea ice is nearly or completely absent. Cold currents and winter atmospheric systems can locally and temporarily influence surface temperatures strongly: see for example the oceans around Newfoundland and North Japan.
Nicely done Willis!
Where to we find data on deep water brine currents?
No idea, sorry.
w.
If it isn’t in the Journal of Physical Oceanography, it’s a military secret….
https://journals.ametsoc.org/view/journals/phoc/phoc-overview.xml
A few months ago I was able to download al the chapters of a fantastic oceanography textbook by Carl Wunch from here: https://ocw.mit.edu/ans7870/textbooks/Wunsch/wunschtext.htm
or alternatively here: Carl Wunsch (mit.edu)
(See the line which reads “Book: Warren, B. A. and C. Wunsch, 1981, Evolution of Physical Oceanography, Scientific Surveys in Honor of Henry Stommel (pdf)” )
but now it seems to be giving an error.
Very interesting, not always so somewhat similar things go on in shallow, and even deep water bays and oceans. Poor tiny critters have a hard time staying vertical. Larvae and their immediate metamorphosis have a lottery scale survival chance which is why they are produced by the trillions. Next time you cross a body of windy water watch the Langmuir circulation, evident lines with bubbles, flotsam and jetsam are convergence (downwelling), in between divergence (upwelling). Not as regular as the models, some lines have “freeway” exits. Langmuir discovered the circulation with light bulbs and umbrellas. Hasn’t been studied much since, makes you 3-D seasick I suppose. It can be surface measured with infra-red. Langmuir, I. 1938. Surface motion of water induced by wind. Science. 87:119-123.
Needing best wishes, they have lots of bigger problems than small changes in T, S, P and even pH.
Willis, the oceans are like an extremely dilute lifeform with huge adaptability. Changing nutrient levels, stirring, death and dissolution will alter albedo and depth of various species. Even the fractionation of carbon changes with light and nutrient levels.
JF
Julian, great to hear from you again. As a man who has spent a good deal of my life on a boat or in or under the sea surface, I can only agree with your assessment of the ocean. It’s amazing.
How much time on a boat? Well, one story about that is here, A Pacific Penance.
My best to you,
w.
Thank you Willis thoroughly enjoyed your common sense approach. I am no scientist at best an enthusiastic amateur ( I can’t do the math). Your logic is irrefutable all those creatures enduring temperature, salinity, PH and pressure changes everyday lays waste to the silly ideas promoted by warmists that nature can’t survive an almost imperceptible rise in temperature that isn’t even proven to be anthropogenic. Excellent.
I note how two of your posts, in one week, have in common demonstrations of temperature change, in fluid dynamics, affecting the environment. I wonder if they don’t belong in a single document? Good work, again.
Steven R Hare (along with Nathan Mantua) noticed that temperature swings on the Pacific Coat of North America caused changes in the catch of menhaden and anchovies ( https://web.archive.org/web/20050212184642/http://www.atmos.washington.edu/~mantua/abst.PDO.html ) on a quasi-regular and repeating basis- thus the Pacific Decadal Oscillation.
I have often thought that nature is more adaptable than humans in their thought patterns.
“ But it seems extremely doubtful to me”
..
How do you account for OBSERVATIONAL evidence?
..
https://e360.yale.edu/features/feeling-the-heat-warming-oceans-drive-fish-into-cooler-waters
..
Sailfish in Cape Cod Canal?
Your calculation of a “small” number for the ENTIRE ocean neglects the fact that it will get much warmer in some spots, and a smaller increase in others.
Based on feelings? From sunlight? Have some more kool-aid.
No dk_, based on reality/statistics. For example the average height of an adult American male is 5’9″. But, the average for NBA players is 6′ 7″ and the average height of professional jockeys is 4′ 10″.
You can’t face REALITY, dog-tag.
Reality is that the slight ocean warming has been from the COLDEST period in 10,000 years, and is highly beneficial to all life on Earth, just like the increase in atmospheric CO2 from barely plant subsistence level has also been HIGHLY BENEFICIAL of ALL LIFE ON EARTH.
That is REALITY..
And perhaps even cooler in some spots, as Willis’ map shows.
“…will get much warmer in some spots, and a smaller increase in others….”
As it ALWAYS has, but let’s fix your comment.
will get much warmer in some spots, and COOLER in some spots, with a smaller increase or DECREASE in others.
Besides .25 degrees over what 70 plus years, with very different observation methods, and very incomplete observations, is likely within the error bars of no change.
Small spots have ALWAYS been a bit warmer.
Nothing to do with human causation.
Another case of dag-tag playing tiddlywinks with himself.
Sailfish in Cape Cod Canal?
The Gulf Stream produces circulating eddies of warm water several tens of miles across and even a few hundred miles across. These eddies can entrain local marine critters when they form in the tropics and subtropics. Because the water is warm and the environment familiar, the creatures have no reason to head south or west. The creatures caught up in these eddies are then transported north to New England and even as far as Atlantic Canada. The eddies eventually decay and the fish make surprise visits to the New England shore on their way south.
All this has been well known and properly understood since forever. The Yale360 article is sheer alarmist drivel, OR demonstrates the totally clueless nature of the Yale researchers. If I was a student there, I would want my money back.
The gulf Stream has been around since before Europe populated North America. How come the Gulf Stream hasn’t brought sailfish to the Cape before? ….. Oh, and read the entire article, and pay close attention what commercial fishermen are observing/doing.
.
How do you know it hasn’t ?
You do know that for most of the last 10,000 years, oceans have been MUCH warmer, don’t you, Dog-tag ?
Or are you one of those ignorant CLIMATE CHANGE DENIERS ??
Coincidence? A one-off event does not characterize a trend.
Roger, you are doing your best to distract the discussion with bogus “facts”. Black marlin, another tropical species, are not uncommon in Massachusetts waters. I find the following about Sailfish from 2010:
And sailfish are mentioned in “The History Of The Fishes of Massachusetts” written in eighteen freakin’ fifty-three… so go away. You are nothing but an uninformed troll doing your very best to screw things up by repeating fake news.
w.
“uninformed troll”
..
https://www.realskeptic.com/2013/12/23/anthony-watts-resort-name-calling-youve-lost-argument/
..
Willis lost this one.
Because of what Mr. Wattts has said about name calling, I don’t want to lose the argument by calling you an “egotistical ignorant wannabe.”
That would only be a reflection of yourself, dog-tag !
Sorry Roger but Willis was not name-calling. You were trolling, by the definition of the word and, due to your posts being refuted ridiculously easily, you were uninformed. Your name-calling is, therefore, completely unwarranted.
Can you explain away what commercial fishermen are experiencing (if you read the article?)
I had an up-close-and-personal encounter with a Greenback sea turtle in Cape Cod Bay way back around ~1965 (!). As you may know the Greenback is a tropical and subtropical species and has no business in New England waters. This stuff has been going on for a very long time.
Sorry, Roger, but once again all you’re doing is trying to sidetrack the discussion … for which nasty habit you’re on my no-fly list. Talk to the hand, the head ain’t listening.
w.
PS—I gave you both a small number for the ENTIRE ocean, plus two, count’em two, graphics showing the exact spots where it is and isn’t warming, and by exactly how much … stop whining.
Thank you for acknowledging that your “small number for the ENTIRE ocean” has no bearing on the argument for species migration (which of course is the whole point of your fruitless endeavor.)
I “acknowledged” no such thing. NINETY-EIGHT PERCENT of the ocean is warming at LESS than a quarter of a degree per half-century, so it has great bearing on species migration.
w.
The distance from the equator to the pole is about 6200 miles. 2% of 6200 miles is 123 miles. So, a commercial fisherman now has to travel an extra 123 miles pole-ward to catch the fish he wants.
How many gallons of fuel does the fishing boat have to burn to travel the extra 123 miles to get to where the fish are?
You poor PATHETIC BABY, crying and carrying on like a child’s tantrum because fish can extend their habitat back to regions they used to frequent for most of the last 10,000 years.
That little bit of Ocean Heat content as shown by Willis is just the small red squiggle
Willis, the number for the WHOLE ocean is not applicable to localized phenomena. The behavior and observations of commercial fishermen (as exposed in the Yale link) proves you don’t have a clue as to what is really happening in the oceans.
So Roger, you’d take as gospel the 1922 reports of the Arctic waters fishermen that the sardine fishery there was f^<ked because of the warmest sea temps EVAH!
.
cause by Dog-tag’s whimpering and yapping, no less !!
Willis,
Roger is the type that; cutting stair stringers, and the treads were changed from 3/4” to 1 1/8” plywood, would very carefully cut 3/8” off the top of each tread while telling one and all how accurate and precise all his cuts were! Somebody older and wiser might eventually tell him that he could have taken the 3/8” off the bottom, but he might try and argue even with that!
Thank you for bestowing upon me your badge of honor (no-fly-list.)
.
It is truly amazing that you react to criticism by labeling it “whining.”
.
No wonder you can’t get a paper published in a reputable journal.
Roger Rabbitbrained,
Did you enjoy perusing your idol Hunter’s laptop photos? Which ones did you like the most; the ones where he’s doing drugs, or where he’s having sex with underage girls?
You qualify for the the no-fly list by constantly wingeing and whining; but I’ll bet part of it is having all the imagination and creativity of an automaton! Try thinking for yourself; it’s tiresome hearing other’s voices spewing from your gab!
We’re still waiting for your apology for besmirching the memory of Officer Sicknick with your lies! I know it’s asking a lot, but try to exhibit a tiny bit of integrity!
Mr Abolition Man, please do us all a favor an look up the definition of “whataboutism” with regards to Hunter.
Oh look, dog-tag has been granted day-leave again. !
You know it’s sad when you have to spend all your time and your limited intelligence trying to defend your religious beliefs! Maybe you should try another line of work; this trolling gig just show the limits of your mind and the flaws in your personality!
Dog-tag,
I rather like fred250’s new name for you!
No, I don’t need to look up “whataboutism,” thank you; I find the videos of the confessed criminal, Hunter Biden, of little interest!
Perhaps you should consider another career besides trolling; you bring to mind the scene from Tombstone where Doc Holliday says to the badly-losing Ike Clanton; “I know, let’s have a spelling contest!” You may spell adequately, but your trolling is pathetic! Maybe you could get a job as a barista!
Roger, I had a peer-reviewed “Brief Communications Arising” published in Nature. I have a peer-reviewed journal paper that’s gotten over a hundred citations. So as usual, you are LYING in a vile manner. Stuff your ugliness where the solar constant is zero.
And you have no “criticism”. Instead, you seem to think that the important issue here is that a tropical fish has turned up in Massachusetts, as has been happening for over 150 years .. and that is a “criticism? Sorry, but that is just more of Roger whining.
Finally, I don’t see your issue. The ocean has warmed and cooled forever, and the creatures of the ocean have ebbed and flowed with that. But from the data in Figure 1, only 2% of the ocean is warming faster than a quarter of a degree per half century … and you want to focus on the 2%? You see that 2% as the important issue? Of course you do.
Because I call it whining about two freakin’ percent of the data.
Yes, Roger, the ocean is not stable. And? So?
You, sir, are a troll, and an ugly one at that. You constantly focus on meaningless trivialities, you pick on some 2% somewhere, and you do your best to spin the discussion away from anything real. Were it my call, I’d ban you for being a waste of oxygen, but I’m just a guest author, so continue your babbling … just know that folks here see you for who you are, and it ain’t pretty.
w.
“Roger, I had a peer-reviewed “Brief Communications Arising” published in Nature.”
…
Again, and again, and again and again and again Mr. Eschenbach touts his “peer reviewed” COMMENT in Nature. It wan’t a paper, it wasn’t research, it was a COMMENT, but he continually misrepresents it.
“that’s gotten over a hundred citations”
…
Nope
“ as has been happening for over 150 years”
..
Nope
Sailfish were noted in ““The History Of The Fishes of Massachusetts” written in 1853. So yes, for 150 years.
w.
ROFLMAO.
Teach just got taught !
Bet he didn’t learn anything though 😉
Go to the dunces corner, teach. !
I said:
“I have a peer-reviewed journal paper that’s gotten over a hundred citations.”
You stupidly said:
“Nope”.
From Google Scholar:

So as usual you’ve got bovine excrement right up to your teeth.
w.
Ooh, William, jealous much? It was EXACTLY what I said, a peer-reviewed “Brief Communication Arising”.
First, Nature has no category called “comments”. So you’re just making things up.
In a BCA you are allowed a certain number of words and one graphic. It was reviewed by three scientists who approved of it.
The BCA also was cited by seven other scientists, and in the event, what I said was found to be true.
I know that frosts your banana, but there it is.
w.
Again, your response proves my point. You refuse to address the fact that commercial fishermen are experiencing the species migration due to ocean warming. You can’t handle being called out when your analysis is faulty. Your ego is just too big.
You posted: “Now I keep reading about how fish are changing their locations in response to oceanic warming. But it seems extremely doubtful to me because the changes have been so small.”
…
Well, there Mr. Eschenbach, that 2% is causing fish migration as pointed out by my link to the Yale study. Your argument that the “changes have been so small” and can’t cause fish migration is falsified by OBSERVATIONAL evidence.
You claimed to have been in commercial fishing, don’t you trust the evidence gathered from the commercial fishermen in the Yale study?
You obviously don’t know any commercial fishermen …
w.
Its the Yale study…. a propaganda pap piece of rabid AGW non-jornalism..
……pay the fishermen to say what you want them to say.
Yale is a basition of FAKE CRAP from AGW sympathisers and cultists.
And what do you have against fish expanding the territory they can live in?
Arctic sea life is coming back strong, RECOVERING from the extreme sea ice and cold of the LIA and late 1970s.
Not only is the land surface GREENING, but the seas are also springing BACK to life after being TOO COLD and frozen over for much of the last 500 or so years (coldest period of the Holocene)
The drop in sea ice slightly toward the pre-LIA levels has opened up the food supply for the nearly extinct Bowhead Whale, and they are returning to the waters around Svalbard.
https://partner.sciencenorway.no/arctic-ocean-forskningno-fram-centre/the-ice-retreats–whale-food-returns/1401824
The Blue Mussel is also making a return, having been absent for a few thousand years, apart from a brief stint during the MWP.
https://journals.sagepub.com/doi/abs/10.1177/0959683617715701?journalCode=hola
Many other species of whale are also returning now that the sea ice extent has dropped from the extreme highs of the LIA. Whales cannot swim on ice. !
https://blog.poseidonexpeditions.com/whales-of-svalbard/
Great thing is, that because of fossil fuels and plastics, they will no longer be hunted for whale blubber for lamps and for whale bone.
Why the HATRED for world sea life, Dog-tag ??
Long bow there Roger.
Commercial fishermen just go wherever the fish are.
Fish chase food, which is borne on currents, which are orchestrated by oceanic cycles, which will present alternatively as warmer at some depths and regions, and cooler at other depths and regions.
Roger, AS I SAID:
“The ocean has warmed and cooled forever, and the creatures of the ocean have ebbed and flowed with that.”
So yes, commercial fishermen experience species migration. And having spent a good chunk of my life as a commercial fisherman, I’m well aware of that, and haven’t denied it.
Get a grip. You’re just trying to make trouble.
w.
Oh, I see, you somehow think a sentence like “fishermen find…becaue…global warming” has logical worth. Fishermen are now climastrologers? Or how about actual reality, with a copy editor going: “Fishermen find tropical species blah blah, climastrologers say it is because GagaWaga blr blrr…”
You’ve lent your ears to the devil, son!
Catching tropical fish a short distance from the Gulf Stream is evidence of the tolerance to temperature differences. One might say, however, that it is anecdotal without a thorough and proper sampling.
Sometimes warm water makes excursions?
I go fishing on west side of vancouver island every summer
7 or 8 years ago, the inlet our lodge floated in had a bunch of mackerel that were unusual
We caught a bunch off the dock with a dipping rod, the oily smelly buggers made fabulous halibut bait.
One person there went on snd on that this was climate change by humans OMG OmG
Of course, we have not seen them since
There’s always one in every group Pat.
Their name is “Chicken Little.”
Obviously you have never been in and around the Gulf Stream. If you go offshore from Cape Hatteras in the winter you can go from 50F water to 75F water in 20 feet and the water will go from green to tropical blue. The fish will change from cold water species to tropical species.
As it goes north of the Cape it meets the Labrador Current and starts swirling into eddies. Tropical fish get trapped in these and if the eddies drift northwestward, you can catch Mahi Mahi or sailfish off Boston. It is not unusual and happens occasionally.
Willis.
What is the accuracy of the instruments?
Are we reading greater precision into the data that doesn’t actually exist?
Thank you for the visuals!
I like to “see” the data as well.
Jim G, preArgo not so great. With Argo (full deployment 2006) surprisingly good. Covered the latter here in my Argo fit for purpose post a couple of years back. Covered the former in essay Missing Heat in ebook Blowing Smoke.
What Rud said, and even post-Argo, the ocean is a big place. There are about 4,000 Argo floats in operation. On a map, it looks very dense.
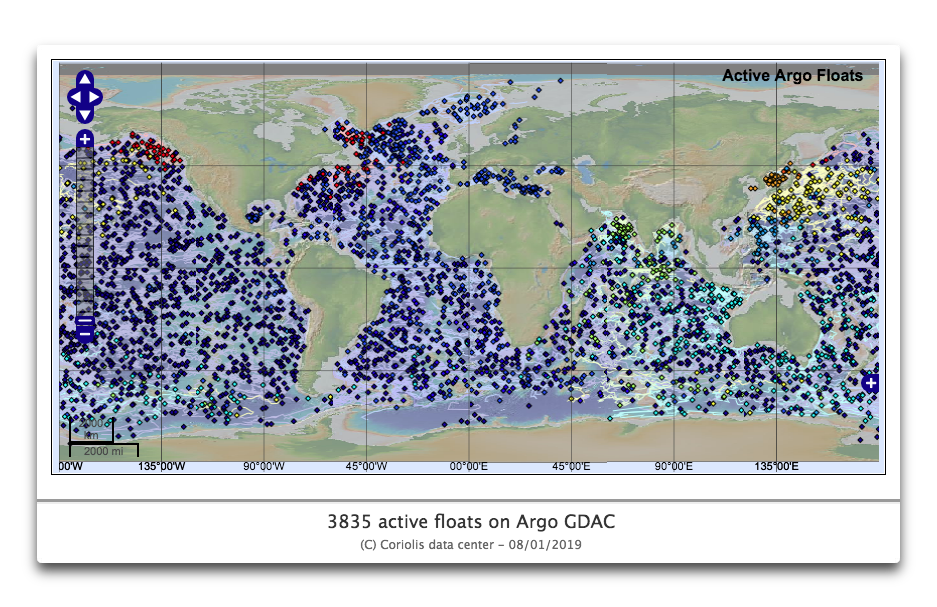
But in reality, that works out to about 5 Argo floats for an area the size of California, or one float for the area of Portugal … so I don’t put all that much weight on their calculations. I mean, if you had only one thermometer to measure the average temperature of Portugal, how accurate is your result going to be?
w.
LOL, again you show you don’t know anything about random sampling.
Why always highlight your own ignorance, dog-tag ?
fred250,
Who was that said: “If you got it, flaunt it!”
Back to Willis/Reply to Rud.
Perhaps, but the reply doesn’t address the question that I asked.
–> What is the accuracy of the instruments?
–> Are we reading greater precision into the data that doesn’t actually exist?
Regardless of the instrumental precision, if researchers like Carl adjust the accuracy to agree with ship boiler-room intake temperatures, then the precision is meaningless.
Nice post, WE. Spot on about temperature and pH adaptability.
I tackled two specific examples, Milne Bay corals and Netarts Bay oyster hatchery at Whiskey Creek, in essay Shell Games in ebook Blowing Smoke. Both were featured prominently in the alarmist Seattle Times series SEA CHANGE. Both alarmist specifics were clear cut cases of academic misconduct.
Yeah, I remember the Netarts Bay hoax. Thanks as always for your work.
w.
Not just in the oceans, either! I have puzzled about claims of land-based biota being endangered by changes upward by fractions of a degree. Other than short-lived insects most biota experience and presumably acclimatise to diurnal variations of up to 10ºC or more. Biota with lifetimes of several years experience seasonal variations of the same order. Presumably biota which cannot endure such changes in conditions would have long since disappeared.
Gary, I explored your question in depth in essay No Bodies in ebook Blowing Smoke, analyzing AR4 WG2 claims. Turns out the IPCC charts are very deceptive. The ONLY generalized IPCC species conclusion comes from just one paper. That paper had no less than four major problems: faulty z, grossly overhot GCM, biased species study choices (example Queensland birds—Queensland has ~630 bird species, of which ~20 are endogenous [all birds of paradise] of which they modeled 13), faulty weighting of their six ecosystems.
Essay exposed all the fatal ‘climate science’ flaws and misrepresentations
The vast majority of species, both oceanic and terrestrial, live or evolved in the tropics! Why hysterical alarmists are concerned about a small warming cycle and the subsequent expansion of the tropics is almost enough to beggar one’s belief!
Many of the species living in and around higher latitudes are more recently evolved; like orcas and polar bears. If only we could convince the orcas to deal with alarmists like they dealt with Megalodon!
One of David Attenborough’s TV series about the tropics contains the claim that “The tropics constitute 1% of the area of the Earth, but contains 50% of the species.” Heat can’t be all that bad for life!
Attenborough presented a well known dichotomy. Not new news. The harsher the environment, the fewer the species. Reason is simple, fewer ecological niches into which to differentiate. This has been taught in basic ecology since I took it about 1970.
I like this little chart from Bob, showing just how little of the oceans was actually “measured” until quite recently.
Always makes me wonder about where the actual temperature data from, say 1960 came from and how realistic they are.
Willis’ line of eddies starting off the Cape of Good Hope show up nicely on “earth”
https://earth.nullschool.net/#current/ocean/surface/currents/orthographic=75.48,-94.13,556/loc=75.482,-89.958
It looks like warm water from the Indian Ocean is being sucked into the circumpolar clockwise current of the Southern Ocean. After some turbulence off the coast of Argentina and the Falklands, it seems to come around for a second turn of a spiral. Like bathwater circling the drain.
The colours on this presentation indicate speed of the currents. If you change the overlay to temperature, the trend is not so obvious.
For those who didn’t accidentally discover as I did, the orientation of the globe can be changed by dragging the cursor around.
Did you notice that, wherever you click, the browser’s address bar changes to the co-ordinates of that point, and all the statistics (Temp, pressure, water content etc) in the bottom left corner displays for that locality?
I have my own GP saved as a link, instant weather updates from space! Well, almost instant for some things, others are longer term. You know the wheel zooms in, right 😉
One thing I give to the late not-so-great oceanographer Wally Broecker (inventor of the gross-oversimplification called “The Great Ocean Conveyor”) was that he did at least acknowledge that the Antarctic circumpolar current “serves as the great mix-master of the world ocean. It blends the NADW exiting the Atlantic with new deep water generated along the perimeter of the Antarctic continent and also with old deep waters recirculated back into the Antarctic from the deep Pacific and Indian Oceans. So efficient is this blending that the NADW entering from the Atlantic loses its identity before it passes even one half of a revolution around the Antarctic!”. (OCEANOGRAPHY-Vol. 4. No. 2-1991 79. NADW = North Atlantic Deep Water)
Great stuff as usual Willis, thanks.
Is there a reason why polar data, “polar amplification” is dispersed to the public in temperature anomalies? Ha ha yeah, no prizes for guessing the answer, and no prizes either for guessing why Antarctica is only mentioned by people who haven’t looked at the data for 15 years. At this point, actual scientific fraud, not borderline scientific fraud would be the answer.
It would take me a lot of time that I don’t have to get up to speed on that calculation but you may have it literally at your fingertips. I’m talking about the “Joule” anomaly at the poles versus the “Joule” anomaly in the tropics. You wouldn’t surprise me if Arctic amplification barely exists when measured in Joules.
…. and of course, I meant atmospheric temperatures, not sea surface temperatures. Sorry for my lack of clarity.
This post is more of a question then a comment:
Is the temperature of the permanent ice (some places 4 – 5 meters thick) that floats at the North Pole incorporated in the average temp of the Arctic Ocean?
This permanent ice must be way colder than the 28.8 F, needed for freezing salt water.
If you Google the question, you get this:
What is the temperature of the Arctic Ocean?
28.8 °F
That answer seems to only account for the liquid part, and probably discounts the frozen – very cold ice – part as not relevant for calculating the average temp of the Arctic Ocean.
Any thoughts on this?
Good question, Sailor. Generally, different groups use different measures. Some groups, like Berkeley Earth, give two measures as different datasets—temperature on top of the ice, and also water temperature under the ice. There’s no “right” way to measure it.
w.
Thanks for replying Willis. As you state: There’s no “right” way to measure it.
But isn’t that the broader problem: How an we really know/measure the average temp of anything globally, be it oceans or land? who can say with certainty what the temps were in 1880, and then claim we cannot allow it to increase by more than 2 C, by 2100,even if we could control it, which we cannot? The idea is beyond mad, but there are plenty people believing this. WUWT is my safe space, thanks!
That 28.8 degrees is the temperature at which the salt water starts to freeze. As it freezes the ice gets thicker and the water below it can no longer directly radiate to space. The air above the ice gets colder because the conductivity of heat through the ice decreases with increasing thickness. The ice increases in winter and decreases in summer. Also noted, CO2 builds up over the ice in winter and is completel absorbed by the open water in summer. There is no year-to-year accumulation. The year-to-year rise in concentration is the result of increased natural emissions from tropical oceans, not anthropogenic emissions. Natural emissions are 20 to 50 times more than anthropogenic emissions.
I do agree that natural emissions probably by far outstrips anthropogenic. But how do you explain that during the MEWP the CO2 level remained flat at 280 ppm, according to the Greenland ice core measurements? There should have been a rise during that time as well, no? Any explanation?
I’d be very interested to find out if ALL of the ice cores agreed on exactly 280 ppm or if there was some degree of difference between them? Also what thickness of ice/sample size represents the length of the entire MWP record?
In the graphs at the link below, there is a slight rise of CO2 around 1200 AD and slight dip from 280 around 1700-1800 AD (LIA)
https://www.co2.earth/co2-ice-core-data
I guess one could interpret that to mean that temperature variation and CO2 levels are minimally related.
So 275-284 ppm, allowing for an error range of, what 10% for sampling/reading error, is something like 250-300 (ish) ppm. Given that there were only a few samples taken within the MWP range, I’d guess that the ice was compressed immensely – down to something the thickness of a burger (or less most probably). So how much CO2 was squeezed out as the ice was compressed?
As to a relationship between CO2 and temperature – not absolutely linked I should imagine. Consider that as temperature rises, plants do better and natural CO2 increases. However, we haven’t seen a great increase in natural CO2 after the Minoan and Roman WP so maybe the duration of the warm periods has been too short to jumpstart greening and increase natural CO2? Given that natural CO2 has been bumping along just at starvation levels for most of this interglacial, perhaps the introduction of fossil fuel CO2 has been exactly what was needed – were we just 1 or 2 ice ages away from losing all life on this planet?
See I can do apocalyptic doom and gloom as well as a bunny-hugging climate enthusiast.
Willis, thank you another interesting post. You wrote:
“But like I said, I can do the math. So I converted the slow increase in exajoules of heat content into degrees Celsius of slow warming. “
My question is: didn’t they calculated the increased ocean heat from temperature data in the first place? I can’t think of another method of measuring these data.
Another question: do you agree that any warming must be either due to solar radiation or ocean mixing, since water doesn’t heat up by LW radiation? I assume that convective heat transfer by the atmoshere can’t explain these amounts of exajoules because the increased temperature difference would be far from be sufficient (or not?).
Arjan, yes, it was temperature to start with.
However, LW can assuredly leaves the ocean much warmer than it would be without the LW. See my post “Radiating The Ocean” for a full discussion.
w.
“Polar amplification is the phenomenon that any change in the net radiation balance (for example greenhouse intensification) tends to produce a larger change in temperature near the poles than the planetary average”:
NASA GISS temperature trend 2000–2009, showing strong arctic amplification (Wiki).
Oddly the Argo circum-Arctic ocean surface temperature data shows no trend from 2004 and in fact has been cooling to ~1400 m depth.
http://www.climate4you.com/images/ArgoCircumArcticSince200401%2055N-65N.gif
UAH Arctic shows GISS is a FAKE.. as always..
Only Arctic warming this century was at the 2015 El Nino Big Blob, all but gone
.
The turtle people at Stanford Woods Institute for the Environment
https://news.stanford.edu/press-releases/2021/04/08/illuminating-sea-turtle-mystery/
claim, via a press release, that “As the planet undergoes unprecedented climate changes, locations once considered impassable obstacles to species movements, like the Eastern Pacific Barrier, are being redefined. This, in turn, is shifting the distributions and migratory pathways of creatures ranging from sea birds to white sharks and presenting new conservation challenges.” One of the authors gave a nice interview on today’s CBC Quirks & Quarks, and the host is always glad to bring climate change into the equation. I was about to send her the link to Willis’ article, but decided not to. My experience with biologists who invoke future climate change is not positive. It seems most of them do not even think of the record of even relatively recent climate change.
NATURE article 2009:
Jellyfish help mix the world’s oceans. Marine creatures could stir up seas as much as do winds and tides.
“If swimming animals do affect ocean mixing substantially, climate modellers will face “a forbidding challenge”, says physical oceanographer Carl Wunsch of the Massachusetts Institute of Technology in Cambridge.” https://www.nature.com/news/2009/090729/full/news.2009.745.html
Surprisingly no one talks about the several ten-thousands of merchant ships navigation the sea daily and their impact on global warming since they move as motor ships with screws. The upper sea surface layer down to 20 meter is the most crucial part in the sea-atmosphere relation.
1 in china diversion cost us and world how many lives ?.
The Warmistas shout out the variation/increase of some miniscule, not diorectly measurable amount, of temperatures when the daily and yearly changes are orders of magnitude greater.
I could have sworn the alarmists told us that global warming would cause the Gulf Stream to shut down by now. 😉
Quote: ‘If the world’s creatures, both on land and at sea, were as temperature-sensitive as the alarmists would have us believe, those beings (and we humanoids as well) all would have gone extinct long ago.”
I’m no scientist but just follow fish-trawling vessels. If they operate in the same international waters and other spots, year after year, it’s because there are lots of fish in those areas that haven’t migrated.
Just as with your home, if there are too many people living in it, some leave and migrate elsewhere and even adapt to other areas. I figure it’s the same with all living creatures on this planet.
“I’ve long wondered how less-dense warmer water could mix downwards into denser cooler deeper waters”
Are you sure it is less dense? Salinity counts as well as temperature.
Water gets less saline away from the tropics, and if the Gulf stream wanders into less saline waters, warm water can sink.
So, a constant supply of cold, fresh water from the poles getting mixed in with old, evaporation-experienced water, less well as we go equatorwise, with
near totalgood deal of stagnation between the two longest landmasses.And then there are the little hotspots along most every coast. Harbour sensors? Something clogging the ones on/near the beach?
If this kind of measurement is to go by, no wonder they have to adjust so many of their other measurements, which hubris would eventually turn into measurements to fit the narrative.
Nick, I am pretty sure that the common range of salt concentration (outside a few places like the Mediterranean and the Red Sea) is not enough to overcome more than the density difference due to a change of a few degrees temperature. The deep convection areas in the north Atlantic (where the Gulf Stream goes to die) are very cold and dense, and the convection is very deep.
Your nicely colored map mostly shows where it rains a lot and were it doesn’t. Look at the West Pacific warm pool area… it has low salinity and high temperature, because there is a lot of rain. Those bright orange/red areas are NOT where salty surface water is sinking to great depth; the salty water is floating on top of much colder (and denser) deep water. Where the salt concentration is high is where there is a lot more evaporation than rain.
Alarmist and common sense are incompatable!
Willis,
Relatedly, I am studying a publication by 15 authors from the Australian Academy of Science, a veritable Cinemascope wide screen polychromatic production with 450 references.
https://www.science.org.au/supporting-science/science-policy-and-analysis/reports-and-publications/risks-australia-three-degrees-c-warmer-world
A repeated theme is that a warming globe will generate heat waves that are hotter, longer and more frequent than before. This includes marine heat waves. Here is the abstract of one reference by Oliver at el that they list to support this presumption:
“Marine heatwaves are important events in oceanic systems that can have devastating consequences for ecosystems, causing ecological changes and socioeconomic losses. Prominent marine heatwaves have occurred recently and attracted scientific and public interest, but comprehensive assessments of how these events have been changing globally is missing. Using daily satellite observations, daily in situ measurements, and gridded monthly in situ-based sea surface temperatures we identify significant increases in marine heatwaves over the past century. We further estimate future changes in marine heatwaves to the end of the 21st century, as simulated by CMIP5 global climate model projections. We find that from 1925 to 2016, global averages of marine heatwave frequency and duration have increased by 34% and 17%, respectively, resulting in a 54% increase in annual marine heatwave days. Importantly, these trends can largely be explained by the increase in mean ocean temperatures, rather than a change in variability. Future projections show significant, and accelerating, increases in MHWs properties into the 21st century with many parts of the ocean reaching a near-permanent MHW state by the late 21st century, regardless of emissions scenario considered (RCP4.5, 8.5). Comparison with simulations of a natural world, without anthropogenic forcing, indicate that these trends have emerged from the range of natural variability within the first two decades of the 21st century. This implies that the climate system has departed significantly from natural marine heatwave conditions under which ecosystems evolved, and therefore impacts on marine ecosystems can be expected to be widespread, significant and persistent.”
https://agu.confex.com/agu/osm20/meetingapp.cgi/Paper/650732
Willis, when I compare your article to this pair of papers, there is so much conflict of concepts and interpretations that I hardly know where to start. I can imagine that it I make a public criticism of this AAS paper, I will be told to shut up and read the cited literature, as if there is no more argument to be had.
I suspect that you have found yourself in a similar position at least once before now, so I will simply throw this material into the pot and say that you are a strong person to keep blogging as you do.
Geoff S
And we have just recently heard about “mega-plumes” that can cause transient heating of surface waters. Warm blobs?
Geoff,
Presumably this is all modelling and nobody was actually measuring annual marine heatwave frequency, duration and days back in 1925…..
Another question to consider: “What contribution to heat exchange (mixing) does the daily vertical biological migration make?” They bring their warm bodies down into colder water every day!
Clyde, if I understand my radiative climastrology correctly, it works like this: When those fishies rise from the ice cold depths, they cool the top layer of water, which means it cannot radiate heat, so it traps all the heat down on the bottom of the sea, causing the little tube worms to complain about itchy sweaters.
Hey, if it’s true for clouds, it must be true for all other fluids!
Further to marine heat waves, here is a projection graph from Oliver et al cited above.
It does not look plausible to me.
Geoff S
http://www.geoffstuff.com/marine_heat_oliver.jpg
That was THE most beautiful hockeyschtick I’ve ever seen. Boomerang? Phantasmagorical dramweave of a witch’s broom taking off? Like Granny Weatherwax, she had to take a long, straight run over somewhat lumpy ground, and then, next month sometime?? the entire thing suddenly shoots up into the far heavens.
But that one has also lapsed a bit, eh what, looks about 2005/9-ish? “Dread by 2015!!!” the caption probably said.
Willis, my understanding of mankind-created global warming is that the increase in heat in the oceans will have come from the atmosphere. The atmosphere has a mass of about 5E+18 kg. Assuming a specific heat capacity of about 1 and an increase in temperature of about 0.5degC since 1950 (up until 2013, IPCC AR5), the atmosphere has increased its total heat by about 2.5E+18kJ or 2.5E+21J. So there is enough extra heat in the atmosphere to cause the ocean warming you describe, if that is the cause and mechanism. Is this your understanding?
I have to ask the question.
Is this data “Raw” or manipulated in any way?
Well, it’s kinda complex, but basically the answer is “raw”.
w.
Climate is always changing and this includes ocean temperatures.
Ocean temperatures have varied substantially over the Holocene
doi:10.1016/j.yqres.2004.07.001 (caltech.edu)
Deglacial to Holocene Ocean Temperatures in the Humboldt Current System as Indicated by Alkenone Paleothermometry (wiley.com)
Microsoft Word – Thornalley_article (ucl.ac.uk)
Any attempt to describe current changes as alarming and human caused must distinguish such changes from continual natural warming and cooling.
It surprises me that you assume all ocean heat comes from the sun and that you ignore subsea volcanism and the huge contribution it can make to ocean temperature; as an example have a look at: Energy Unleashed by Volcanic Eruptions Deep in Our Oceans Could Power All of the United States (scitechdaily.com) . Maybe the mysterious “downwelling” of warmer water, is actually a manifestation of upwelling from the ocean floor.
Case, good question. Here’s the math.
The US uses about a hundred quads (quadrillion BTU, 10^15 BTU) of primary energy per year. This is about 29 petawatthours (PWh, 10^15 watthours) per year.
To convert this to ocean floor heating, we need to first divide by 8,760 hours per year. This gives a constant energy flux of 3.3 terawatts (TW, 10^12 watts).
Then we divide that energy flux by the total ocean area in square metres, which is 3.7E+14 square metres. This give us the final figure of 0.01 watts per square metre (W/m^2) of heat coming up from the ocean floor.
Since this is trivially small compared to radiative surface heating of ~160 W/m2 solar + ~340 W/m2 downwelling longwave infrared ≈ half a kilowatt per square metre, it’s ignored in all but the most detailed analyses.
My best to you,
w.
Willis
That approach provides an average for all the oceans, and is appropriate for generic geothermal heating arising from primordial heat in the core. Your figures 1 & 2 show hot and cold spots. To be comparable, you should probably divide by an estimate of the areas of spreading centers (and active seamounts), where the mega-plumes occur, and tag it “potential local heating from transient volcanic events.”
Thanks, Clyde. Scale is still the problem. Let’s say, for example, that spreading centers and seamounts are 5% of the ocean floor. Seems doubtful it’s that much, but OK. If there were zero heat coming from anywhere else on the floor, those areas would be putting out 20 times my calculations above … which is still a pathetic 0.2 W/m2. Lost in the noise.
w.
Willis
Recently, there was an article about NASA claiming that 0.5W/m^2 over a 15-year period was throwing the energy budget off balance.
https://wattsupwiththat.com/2021/03/25/claim-direct-observations-confirm-that-humans-are-throwing-earths-energy-budget-off-balance/
By comparison, 0.2 W/m^2 per year is the same order of magnitude as the 15-year period, or about an order of magnitude greater than the forcing that had NASA in a dither.
what we can see is the minimum around 1970 , but we cannot see the data before 1955 , because they didn’t exist before ! That’s the problem with the climate models , they are half blind !!!
Interesting. I think you found more evidence for your “Emergent” temperature regulation hypothesis.
If you derive the heat capacity of the oceans to 700 m depth vs the heat capacity of the entire atmosphere, the difference is roughly 293 times.
That is the oceans to 700 m depth have 293 times more heat capacity as the entire atmosphere.
So if an increase of (x) exojoules have been observed in the top 700 m of the oceans, and that is a 0.25 deg C rise in that water temperature, then either:
a) the air temperature should have risen by 293 x 0.25C or 73.4 C; OR
b) the emergent temperature regulation systems of the atmosphere simply ramp up the dissipation of that extra energy as per your hypothesis.
Or is my view too simplistic?
How does CO2 warm water that 13 to 18 micron LWIR can’t reach? The only mechanism CO2 has to affect climate change is through the absorption and radiation of 13 to 18 micron LWIR, and those wavelengths don’t penetrate the oceans, yet it is the ocean 50 m depth that is warming. That is due to visible radiation, not IR.
This is important in regards to Mr Eschenbach’s response to Case Smit.
How does 340W/m2 of LWIR warm below a couple of mms let alone to a depth of 700M?
AC, see my post Radiating The Ocean.
w.
“And that means that if a fishie or other subaquatic denizen goes up or down by ten metres or so, it’s already endured the dreaded quarter-degree temperature change”
Interestingly, this is consistent with the observed depth changes from one indicator of marine species movement:
https://www.epa.gov/climate-indicators/climate-change-indicators-marine-species-distribution shows that a select group of species have moved about 10 meters deeper on average over that time period.
[fixed typo in email-mod]
Excellent again, Dr Eschenbach
Re; “I keep reading about how fish are changing their locations in response to oceanic warming” do these alarmists even consider the possible effects of overfishing and fish stock depletion on their findings?
I’d be much more inclined to worry about fish stock depletion than global warming.
There does seem to be more pronounced sea surface warming along the east coast of the United States, from about Florida to Virginia. Could this result in more hurricanes hitting this area in summer, and more evaporation to feed nor’easters in winter?
Awesome work 👍 I actually learned something today!
“There’s a line of giant oceanic slow whirlpool-type eddies that I’ve seen before. They start at the southern tip of Africa and extend down under Australia.” That deserves an article of its own! I can see how there would be a line of cold water in the sea where the cold is being churned upwards in the surrounding background temp water, but why the warmer line? Why a line at all?
Unfortunate reification of data — it is unlikely that any particular spot in the seas, say a given cubic km of the Pacific Ocean, has really experienced a permanent, discernible increase in water temperature of any degree whatever.
That’s not to say that somewhere some spot of some ocean may have not warmed somewhat over some period of time – we see periodic warmings and cooling in the El Nino/La Nina cycle, and every year in the annual summer/winter cycle.
But one cannot make a truly scientific leap from a global map of “anomalies” to any real world experienced actuality. Mörner showed this over and over again with sea level and I suspect the same is just as true about ocean heat/temperatures.
Say what? Why is it unlikely that some spot has warmed in the longer term? Both satellite SSTs and Argo floats and CERES and scientific Nansen-bottle and other datasets show longer-term warming.
And I’d be VERY cautious about believing anything Nils-Axel says. He’s a good guy, but he truly believes that there is zero global sea-level rise, when it’s shown in literally hundreds of tidal gauges (including gauges with co-located GPS) as well as in satellite records.
He also claims he can discern very small changes in sea level from the wave-cut notches in South Pacific coral atolls … I lived in the South Pacific for years, and that’s not possible.
Regards,
w.
w. ==> We’ll have to disagree on both points….
Find me a place with a long-term sea temperature record that is accurate and dependable enough to show a long-term permanent-ish rise in temperature. Then I will admit that there is at least that one place . . .
You misrepresent Morner — he said no such thing. His prediction for sea level rise is “observationally based predictions of future sea level in the year 2100 will give a value of +10±10 cm (or +5±15 cm)” — well in line with the expected 8-12 inches predicted by others (except alarmists). [ https://www.sciencedirect.com/science/article/abs/pii/S0921818103000973 ]
Interesting how the warmest OHC anomalies are on the eastern side of the continents.