

In this blog post, I will show you how to use Percona Monitoring and Management (PMM) to capture per-process metrics in five minutes or less.
While Percona Monitoring and Management (PMM) captures a lot of host metrics, it currently falls short providing per-process information, such as which particular process uses a lot of CPU resources, causes Disk IO or consumes a lot of memory.
In our database performance optimization and troubleshooting practice, this information has proven quite useful in many cases: batch jobs taking much more resources than developers would estimate and misconfigured Percona XtraBackup or Percona Toolkit are among the most common offenders.
Per-process metrics information can also be very helpful when troubleshooting database software memory leaks or memory fragmentation.
You don’t know which processes cause you problems at the outset, so it is important to capture information about all of the processes (or specifically exclude the processes you do not want to capture information about) rather than capture information about selected few.
While capturing such helpful information is not available in PMM out of the box (yet), you can easily achieve it using PMM’s External Exporter support and the excellent Prometheus Process Exporter by Nick Cabatoff.
These instructions are for Debian/Ubuntu Linux Distributions but they should work with RedHat/CentOS based versions as well – just use RPM package instead of DEB
1: Download the process exporter packages from GitHub:
1 | wget https://github.com/ncabatoff/process-exporter/releases/download/v0.2.11/process-exporter_0.2.11_linux_amd64.deb |
2: Install the package
(Note: the file will be different depending on the platform and current release.)
1 | dpkg -i process-exporter_0.2.11_linux_amd64.deb |
3: Run the Exporter
1 | service process-exporter start |
4: Register Exporter with Percona Monitoring and Management
Assuming the current node is already monitored by PMM you just need one command:
1 | pmm-admin add external:service processes-my-host --service-port=9256 --interval=10s |
This captures process metrics every 10 seconds (adjust interval if desired).
Important note: due to some internal limitations, you need to use a different service name (“processes-my-host”) for each host. I suggest just adding the hostname to the descriptive name “processes” for simplicity.
5: Get Matching Dashboard from Grafana.com
While you can browse the data captured by the Advanced Data Exploration Dashboard, it is not any fun. I created a PMM-style dashboard and published it on Grafana.com. I based it on Nick’s original dashboard.
To add this dashboard to your PMM Server, click Dashboard Search on your PMM Server.

From there, click on “Import Dashboard”. Use 6033 as the Grafana.com Dashboard ID.

6: You’re done!
You should have data flowing, and you should be able to see the data on the graphs.
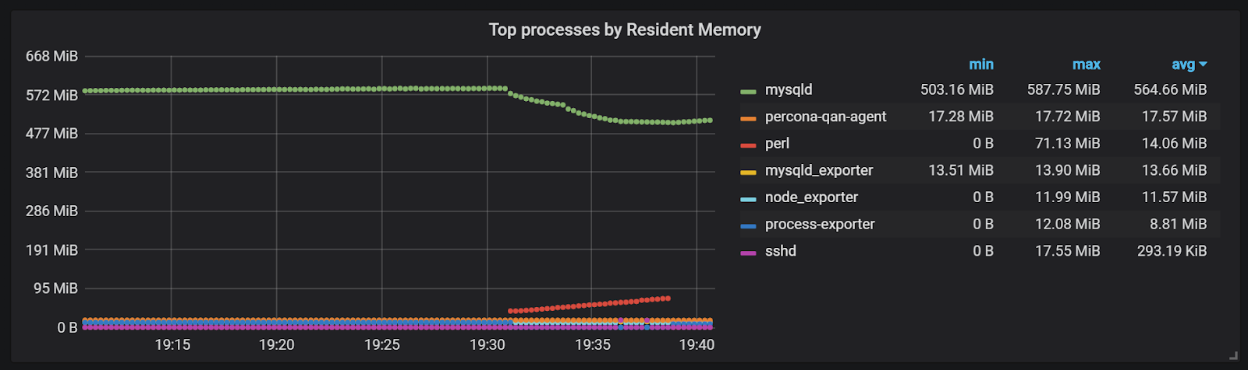
In this example, I have pt-query-digest (shown as Perl) parsing the log file and pushing MySQL Server away from memory.
Note, as you likely have many processes on the system, the graphs are designed to show only the top processes. All running processes, however, are available in the drop-down if you want to access the history for a specific process.
Let us know what you think. We are looking at how to integrate this functionality directly into Percona Monitoring and Management!


Great!
I cannot seem to find the answer to the error I am encountering. This is the command I am using:
pmm-admin add external:service process-exporter –service-port=9256 –interval=30s –verbose
These are the errors I am receiving:
{“error”:”scrape config with job name \”process-exporter\” not found”,”message”:”scrape config with job name \”process-exporter\” not found”,”code”:5}
{“error”:”{local IP}:9256: Get http://{local IP}:9256/metrics: dial tcp {local IP}:9256: i/o timeout”,”message”:”{local IP}:9256: Get http://{local IP}:9256/metrics: dial tcp {local IP}:9256: i/o timeout”,”code”:9}
Jeffery, can you check “http://{local IP}:9256/metrics” from the host? Is this URL accessible and provide some data?
Also check “pmm-admin list ” command so see what you already has
Hi Roma, thank you very much for your reply and I apologize for the long delay in responding. I can confirm that the “http://{local IP}:9256/metrics” link is working locally and when I call it using “curl” directly on the system I receive a lengthy reply that looks like the data I would expect from the process-exporter.
When I run pmm-admin list I only see the
linux:metrics' service, which is working. I am unable to get the service added using this command:sudo pmm-admin add external:service processes-my-host --service-port=9256 --interval=10s --verbose
With the –verbose` flag, I see this error show up during the process:
{“error”:”scrape config with job name \”processes-my-host\” not found”,”message”:”scrape config with job name \”processes-my-host\” not found”,”code”:5}
Hello again Roma, I feel a little bit silly. I turns out to have been a firewall restriction. Once I opened port 9256 between the PMM server and the client, it seems to have started working.
Is there a way to automate the dashboard import?
Federico, you can do this by Grafana API.
As an example you can see https://github.com/percona/grafana-dashboards/blob/master/misc/import-dash.py where we importing our dashboards to Grafana
Thank you for the input and the reference, Roma.