By Kirye
and Pierre Gosselin
It is a fact that land surface temperature records going back before 1900 globally are very few and sparse. Worldwide there are only 116 stations Version 3, unadjusted datasets that go all the way back to January 1880 – most of them are located in USA and Europe (northern hemisphere).
1 dataset per 3 million sq km
That’s just 116 stations for measuring the earth’s 510.1 million km². Obviously the data are nowhere near sufficient to allow any conclusions that have any degree of certainty.
Only a dozen for the entire southern hemisphere
What is astonishing is that of these 116 stations, less than a dozen are located in the southern hemisphere. Yes, 10 stations for 250 million sq km of earth surface. Discerning a hemispheric mean temperature from them would be something like counting the number of people living in Greenland and then extrapolating the earth’s population from it. In other words, the result is just a meaningless guess.
Former NASA researcher: Data too scarce, no certainty
So statements claiming that the Earth’s mean temperature for the time around 1880 is known are in truth fraught with huge uncertainty.
“This is nothing new,” wrote Japanese climate expert Dr. Mototaka Nakamura in an email to NTZ on the topic of earlier surface coverage.
“We simply did not have many observing stations in the 1800s and early 1900s. They can produce ‘new data sets’ and claim that they have ‘better data sets’ all day long, but they just can’t make any meaningful difference for periods up to 1980,” said the former NASA researcher.
Southern hemisphere
For the southern hemisphere we do have from NASA ten long-term, Version 3 unadjusted temperature datasets, going back to 1880. Today we will examine them to look at what they tell us.
4 of 7 Australia charts show cooling
Let’s begin with Australia. Here the large country down under has 7 such datasets going back to 1880, at the locations depicted by the following chart:
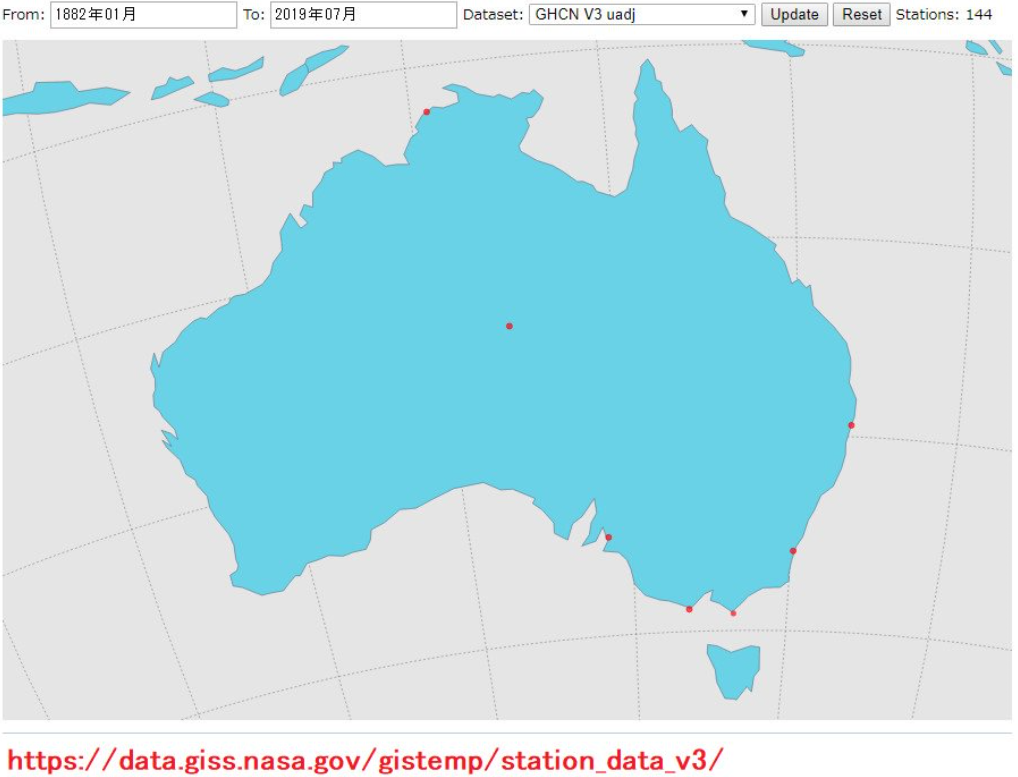
Note how the entire western part of the country is totally void of data.
To put it in perspective, Australia’s vast 7,692,024 square kilometers have been covered long-term by only 7 stations, which means an average of one station for every 1.1 million sq. km. – an area that is 3 times larger than Germany! By comparison today, the German DWD national weather service uses about 2000 stations to monitor the country’s weather conditions.
Plotting the data available from these 7 long-term stations, we get the following result:
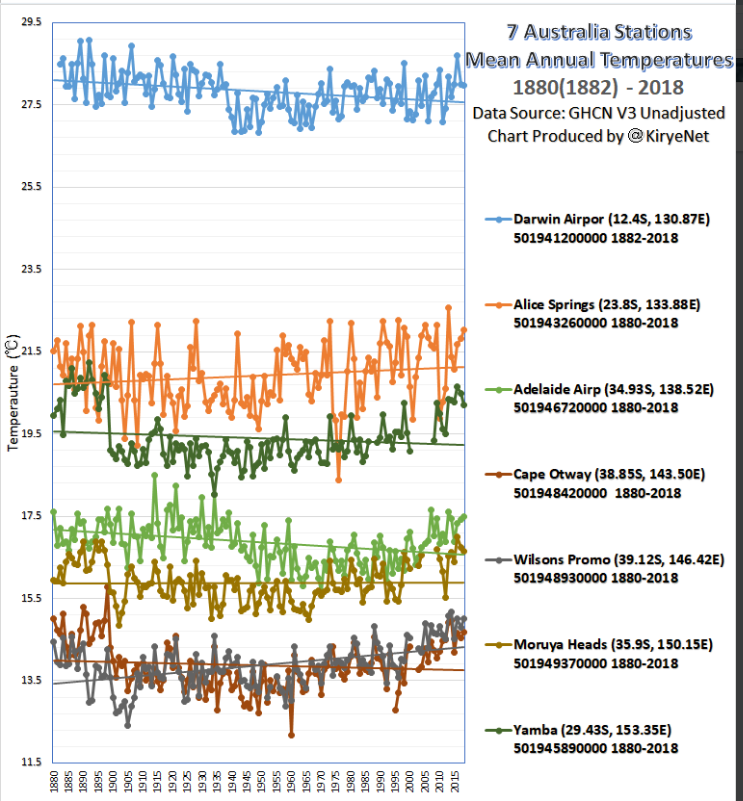
Here we see in fact that 4 of the 7 stations have a cooling trend, not something we’d expect amid all the alarmist talk of warming.
South Africa: Capetown shows no warming trend
The lone southern hemisphere Version 3 unadjusted dataset coming from Africa was produced by a station Capetown, South Africa. What follows is a plot of the data:
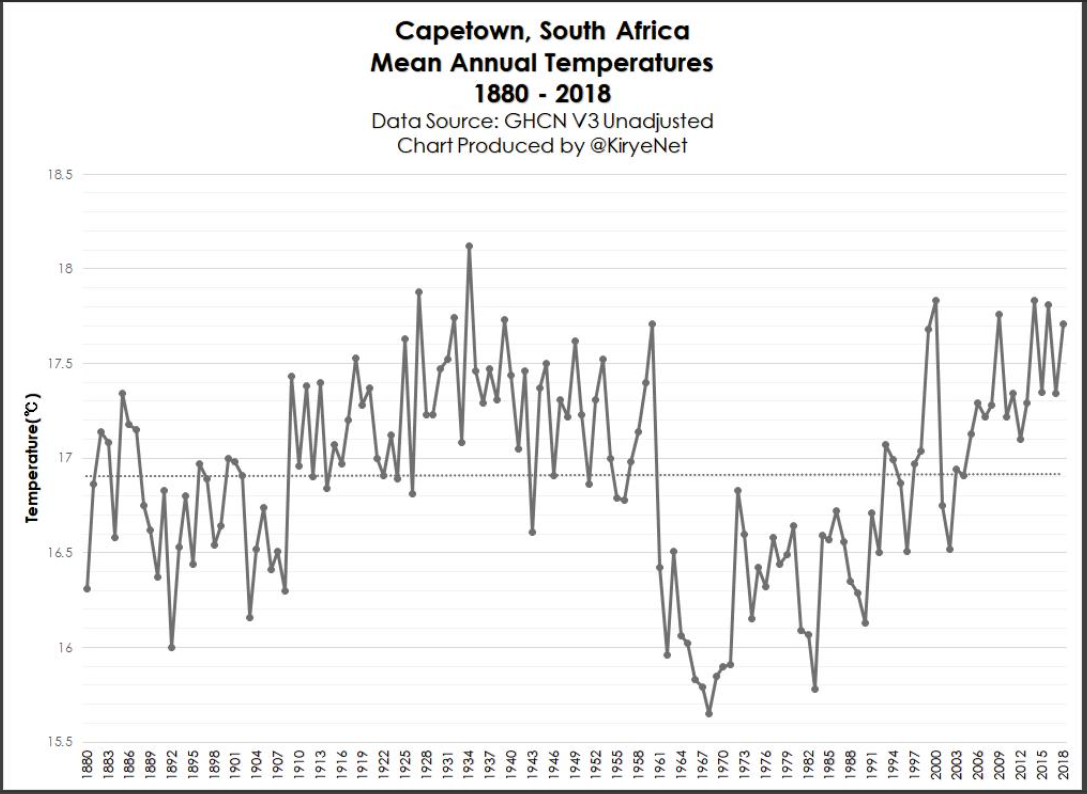
Here as well we see no warming since 1880. And notice the cyclic nature of the temperature changes. And it’s remarkable to see how strongly Capetown temperature behavior lines up with the AMO:
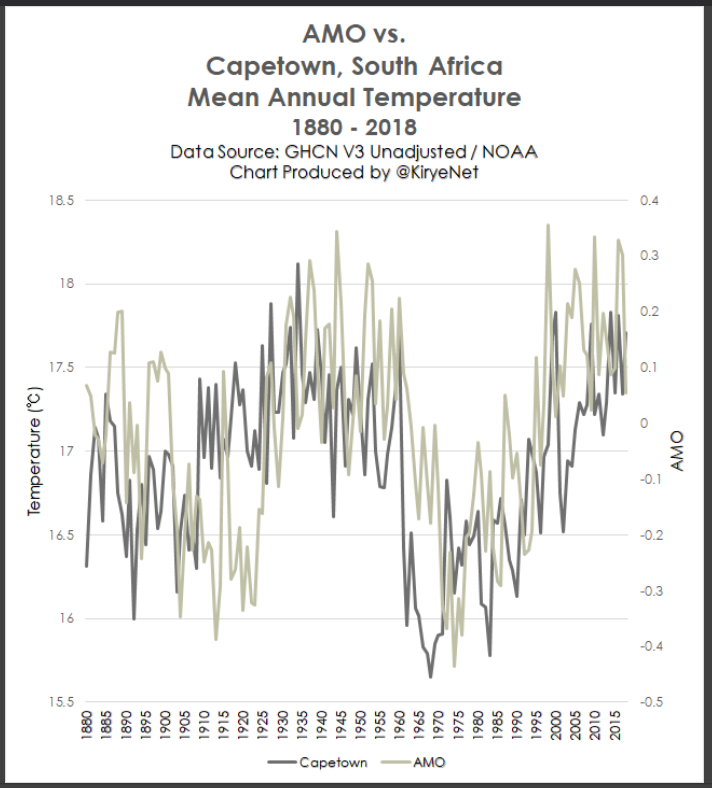
Of course the scientists at NASA altered the V3 unadjusted data and created a V4 “unadjusted” dataset, one whose plot is very different today and obscures the potential link to the AMO.
Argentina showed no warming
Like Africa, South America also has only one single Version 3, unadjusted dataset going back to 1880, located at Bahia Blanca, Argentina:
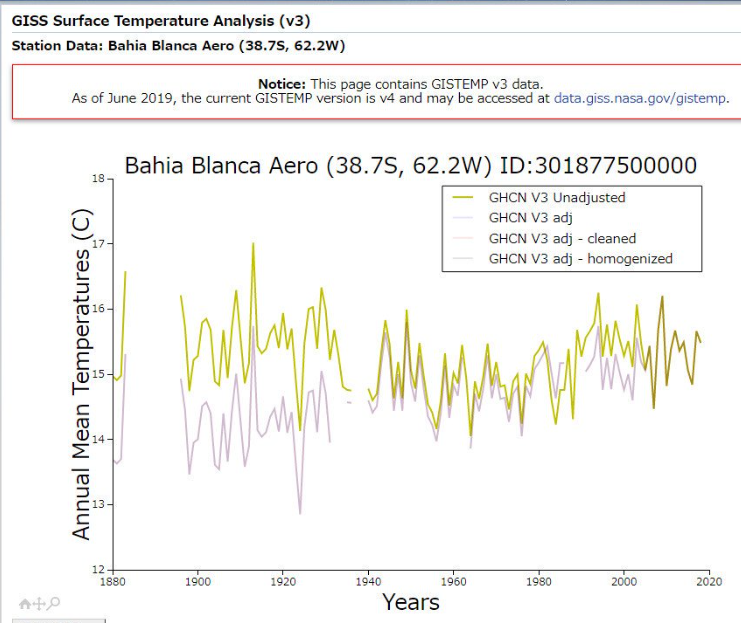
This data set also shows no warming since 1880, and warming only appears after NASA scientists when back and changed the data, as shown above.
Antarctica
Though the South Pole has no stations going back to 1880, a number of stations were set up starting in the mid 20th century by a variety of countries. Here’s what these datasets show since 1979:
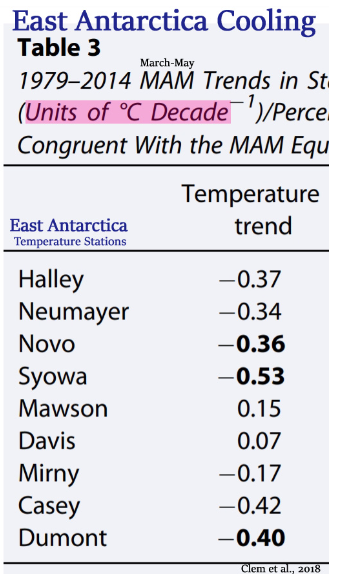
The East Antarctic stations show a lot of cooling and very little warming, according to a 2018 publication by Clem et al.
And at the Antarctic Peninsula, which we hear is supposed to be melting down:
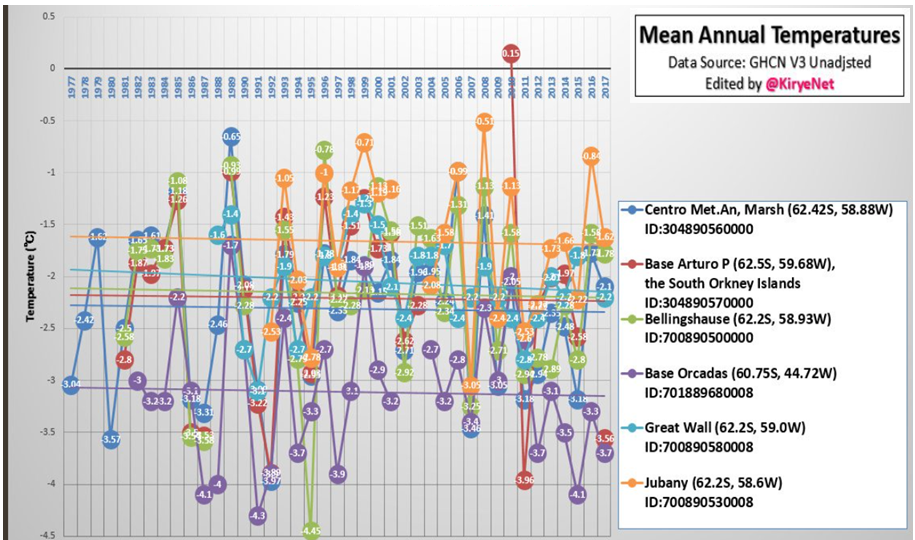
Here as well we see more cooling than warming. Clearly scientists would have an easier time supporting cooling.
Take-aways:
- The global surface temperature data going back to 1880 is far to scarce to allow any trend conclusions with any certainty.
- Data on the temperature history of the southern hemisphere before 1900 is practically non-existent.
- The data that are available support cooling more than warming.
- NASA finds warming only by altering the data.
- The data from the South Pole also support cooling more than warming.
Globally, the surface temperature data is inadequate in volume, and what we do have have been altered to fit a political agenda. The best we have are satellite data, and they go back only 40 years.


You may want to look at the temperature record of the preceding decade, 1870-1879. I believe that the austral summer of 1877 to 1878 may have been the hottest summer of the past two centuries.
In the American Midwest (winter)it was extraordinarily warm, with St. Paul, Minnesota experiencing the year with no winter:
http://climateapps.dnr.state.mn.us/doc/journal/wint77_78.html
“The winter of 1877-1878 — the so-called winter without a winter — was one of the most extreme and anomalous events in Upper Midwest meteorological history. Average temperatures at the St. Paul Signal Corps station were far above winter normals: 34 F in December 1877 (with an overnight minimum temperature of 45 F on 22 December), 22 F in January 1878, 32 F in February 1878 and 45 F in March 1878. As these values suggest, springlike temperatures prevailed throughout much of the winter, provoking the 2 March 1878 edition of the St. Paul Pioneer Press to comment that “….yesterday was the first day of spring, in theory, but in fact we have had the first days of spring nearly all winter….” More at the link.
In Australia, the summer of 1877-1878 may have been the hottest on record:
https://jennifermarohasy.com/2014/09/homogenisation-of-williamstown-temperatures-draws-attention-to-hot-newcastle-in-1878/
and
http://joannenova.com.au/2015/01/forgotten-extreme-heat-el-nino-of-1878-when-miners-yearned-for-the-years-when-theyd-knock-off-at-44-4c/
South America experienced extremely hot weather:
https://www.researchgate.net/publication/233922059_The_1877-78_El_Nino_episode_Climate_anomalies_in_South_America_and_associated_impacts
And in India, this was the worst drought since 1871:
https://www.tropmet.res.in/~kolli/MOL/Monsoon/Historical/air.html
There is a problem with that map, or the selection of data.
There was no temperature station at Adelaide AIRPORT in 1880. The Adelaide station was in the west parklands of the city, near the Observatory. It produced figures under the official Adelaide site was moved to the suburbs (there was an overlap period when the UNAdjusted figures showed the new site was warmer).
Lately the Adelaide site has been re-established near the original site.
The Alice Springs and Darwin stations were founded by Sir Charles Todd, the head of the Adelaide site. The airport name came after when the site got its own airfield.
There were Stephenson screens in Melbourne, Sydney and Brisbane in 1880. It is possible that Cape Otway & Wilsons Promentary in Vic. had records, as they would be obvious sites for the Victorian weather bureau to pick.
And, by the way, the Bureau of Meteorology (founded 1908) states that all records before 1910 are not relevant as possibly inaccurate. Readers wishing to get an idea of current practice might like to view
https://kenskingdom.wordpress.com/2019/08/21/the-wacky-world-of-weather-stations-no-45-newcastle-nobbys-nsw/
Ken is checking out current “high grade” cites using BoM specifications and cite plans, with Google maps.
Cape Otway Lighthouse started recording in 1861.
Wilson’s Promontory started in 1872
Yamba in 1877
Some lighthouse sites were upgraded in the 1960′s (Otway and Moruya Pilot Station were moved; in the case of Moruya a “few feet south”). These moves and upgrades have left detectable step-changes in data. (Jennifer Marohasy 2015)
[…] https://notrickszone.com/2019/08/23/earth-surface-temperature-data-too-scant-no-certainty-southern-h… […]
[…] https://notrickszone.com/2019/08/23/earth-surface-temperature-data-too-scant-no-certainty-southern-h… […]
[…] Earth Surface Temperature Data Too Scant, No Certainty. Southern Hemisphere Stations Show Cooling Si… […]
Just noticed that the extreme climate alarmist Prof Karoli is one of the authors. Maybe he is trying to redeem himself as more evidence becomes available that shows up the hoax about the effect of CO2. Karoli had to pull one of the papers of which he was a co-author because of hopeless statistics. I will need to read it thoroughly to see if it makes sense.
[…] See here. […]