Mid-June in Utah usually marks the tail end of the most fertile time of year for crops. In a typical year, snowmelt in April and May wets the soil, resulting in a burst of blooming flowers and crop growth.
“Usually we have a beautiful, green landscape right now,” said Dr. Jon Meyer, a research climatologist with the Utah Climate Center. “It’s one of my favorite times of year because we get green for six weeks — and then we go back to brown for the rest of the year.”
Not so this year. Drought has gripped the American West, and in Utah, more than 92 percent of the state meets the criteria for “extreme drought,” fueled by what Dr. Meyer described as “a deadly combination of record heat and record dry.” In a recent presentation on drought in the Southwest, Meyer showed a collection of grim indicators: high temperatures, little rainfall, low soil moisture, and finally, poor vegetative health.
This last indicator has become an important metric for climate scientists and meteorologists trying to understand how weather and temperature impact the health of crops, and as an extension, food security, food prices and the global agricultural market.
Tracking Crop Health
This week in the U.S., 216 million acres of crops are experiencing drought conditions and 76 million people are affected by drought, according to the National Integrated Drought Information System. Globally, more than 1 billion people, nearly one-sixth of the world’s population, suffer from chronic hunger and malnutrition, and drought is a major factor.
NASA and National Oceanic and Atmospheric Administration (NOAA) scientists have spent decades developing tools to help state and government officials plan for drought and food shortages. One of them is the Vegetation Health Index, or VHI. Using data from the JPSS program’s VIIRS instrument, first on the joint NASA-NOAA Suomi-NPP satellite and now on NOAA-20, the product shows crop health across the globe represented in color-coded maps. Green and blue indicate lush, healthy growth; red shows areas that are dry and sparse.


Left: The Vegetation Health Index map shows crop health in the Western United States from July 22, 2019.
Right: This is the same product from July 22, 2021. Credits: NOAA STAR
The Vegetation Health Index was created in the mid-1990s by a research scientist in NOAA’s meteorology and climatology division named Dr. Felix Kogan. In the past decade, the number of people using this product has jumped from about 2,400 in 2010 to about 69,000 in 2020, Kogan said.
Laura Haskell of the Utah Division of Water Resources coordinates the state of Utah’s official recommendation to the U.S. Drought Monitor map, which shows the drought status for each region of the United States, and plays an important role in decision-making involving agricultural reimbursements and other government assistance. Data from the Vegetation Health Index informs that recommendation, she said.
And it has a bigger role to play in what Eric Luebehusen, a meteorologist at the U.S. Department of Agriculture, calls “crop intelligence.” The USDA has a small but mighty team of meteorologists engaged in a major effort to develop estimates of crop production in more than 120 growing regions, covering 35 countries. They do this for major row crops, such as corn, wheat, sunflowers, soybeans, barley, cotton and rapeseed—and they rely on the VHI to help create these yield estimates.
What’s more, the research the VHI informs just might be protecting the price of your groceries. Knowing how crops are faring in other countries informs decisions about planting, food prices and foreign market exports, said Mark Brusberg, chief meteorologist for the USDA.
For example, said Brusberg, who monitors crops in Brazil, “if an area of the Southern Hemisphere is experiencing drought and there’s going to be a shortage of corn, it might impact prices in the U.S. as well, and farmers might decide to plant more corn here.”

This Vegetation Health Index map from mid-August, 2021 shows how regions globally are being impacted by thermal, or heat stress. Credits: NOAA STAR Vegetation Health Index
These estimates go into a monthly report that forecasts supply and demand for major crops called the World Agricultural Supply and Demand Estimates.
“The balance sheets maintained by the USDA that track production and trade not only help the market establish prices,” Brusberg said, “but they also provide valuable information to U.S. producers for decision making at the farm and ranch level.”
The Great Grain Robbery
The need for crop intelligence dates back to 1972. In July of that year, the Soviet Union purchased 15 million tons of wheat, corn, soybeans and barley from the United States at low subsidized prices. Russia was experiencing severe drought and needed foreign grain. But the massive purchase, which took the United States by surprise, depleted the country’s grain stocks and caused wheat prices to soar, resulting in a domestic food crisis.
Later nicknamed The Great Grain Robbery by congressional leaders, the event highlighted the need for global agricultural monitoring, and it just happened to coincide with a satellite that could provide just that: NASA’s Landsat 1.
Landsat 1 launched into space that same month, allowing for the first-ever view of drought and crop conditions from space. This convergence of events prompted NASA to team up with the U.S. Department of Agriculture (USDA) and NOAA to develop, in 1974, the first satellite crop production forecast: The Large Area Crop Inventory Experiment, or LACIE.
Dr. Forrest Hall was a project scientist for LACIE at NASA’s Johnson Space Center, and one of LACIE’s creators.
In the early days of Landsat 1, Hall’s team would print out gray-scale satellite maps of the world, tape them as a mosaic to the wall of the conference room and study them, drawing squares to locate fields. They trained algorithms to distinguish between the radiometric signatures of individual crops in the satellite data. Then they validated the maps themselves, tromping through corn, wheat and soybean fields in Ohio and Indiana to see if the crops were indeed growing as the models said.
It was a couple of years later that the LACIE program, an effort to provide global estimates of crop yields, began. This was considered a high-priority project by the U.S. government and the data highly sensitive. When they overestimated or underestimated, it showed up in the markets.
“We briefed President Ford at one point on the Russian wheat crop,” Hall said.
It was an exciting time, Hall added, and a lot of work. “We spent a lot of hours away from our families.”
Dr. Kogan was also well suited to the task of monitoring vegetation from space. He had been making crop predictions in the Soviet Union, using precipitation and temperature models. In fact, he correctly predicted in 1972 that the grain yield would be well under the amount needed to meet consumption needs. He moved to the United States because he wanted to do similar work, but globally, and incorporate data from satellites.
As the years passed and more satellites launched, the ability to do this kind of agricultural monitoring became increasingly important and vegetation health products increasingly advanced.
Observing Crops as They Grow
Like other vegetation maps, Kogan’s Vegetation Health Index uses a formula called Normalized Difference Vegetation Index, or NDVI. NDVI is calculated by measuring both the visible and near-infrared light that bounces off vegetation. Chlorophyll in a plant absorbs visible light but reflects near-infrared light. If the reflected radiation is greater in the near-infrared wavelengths than in the visible, then the vegetation in that particular pixel is likely to be greener and more lush.
But the VHI is unique in that it combines NDVI with temperature. Temperature gives insight into extreme heat or freezes that might damage crops. Because of this, VHI and other satellite-based indices also allow scientists to monitor different stages of the crops as they grow, which makes the resulting crop yield predictions more accurate.
Crops need certain ambient air temperatures for growth. Spring wheat, for example, needs a daily average temperature of at least 41 degrees Fahrenheit to grow, corn needs at least 50 degrees Fahrenheit, and cotton won’t grow until the daily average is closer to 60 degrees.

In Russia, lingering impacts from the Autumn drought on the winter wheat crop were evident in early Spring. This map shows the Vegetation Health Index in Russia on May 1, 2021. Credits: Agricultural Weather Assessments Group (USDA/OCE/World Agricultural Outlook Board)
In 2017, Luebehusen found that he could apply the VHI formula to the crop stage for a particular area in order to model the yield: corn in the silking stage in the Ukraine, for example. It was a game changer, he said.
“As long as you know when the crop was put in the ground, roughly, you can now estimate with a good degree of accuracy when the crop enters the key stages of development where weather matters the most,” Luebehusen said.
From the early days of the LACIE program, these global yield estimates grew out of an important interagency partnership between NASA, NOAA and the USDA. This partnership continues with the VHI product, as NOAA and NASA work together to launch and build the next satellite that will carry the VIIRS instrument, JPSS-2, which is slated to launch in 2022.
“If we didn’t have the VHI data, we’d be hosed,” Luebehusen said. “It’s become an integral part of our operations.”
Banner image: Left: Dr. Forrest Hall accepts a medal in 1978 for outstanding scientific achievement.
By Jenny Marder
NASA’s Goddard Space Flight Center, Greenbelt, Md. Last Updated: Aug 20, 2021Editor: Jennifer Fadoul
The maps will not download
Disable your ad-blocker and then refresh the page.
My adblocker never affected the maps and graphs before?
I looked at this page with this computer, and using an iPad and there is nothing about a map on either one of them.
It’s not an ad-blocker problem. Same result either way.
I’ve had a look at the page source and it aint HTML or even Javascript.
Needs to be rewritten and translared from whatever it was coided in to a public standard
Revisionist history: the purchase of subsidized crops cast as a robbery and reinvented with a NASA twist.
Economic recession and inflation of the early 1970s (and since) had more to do with the elimination of the gold standard, OPEC, and the (often Soviet-sponsored) political unrest in Europe and the Americas. NASA was more concerned with the Apollo program and fending off budgetary attacks from pro-agricultural subsidy, quasi-socialist congress critters than watching worldwide crop health.
[O/T historical note: Hitler’s specialist grains economist, Edgars Dunsdorf, escaped the NAZI state and later taught in Melbourne Uni, Australia. Grains economics and planning was, like many factors, critical to Hitler’s plans. In 1975, he published “The Baltic Dilemma” which describes the despicable decision of the leftist “Labor” Australian Government to give de jure recognition to the malign Soviet Union’s conquest of the Baltic countries.]
A study of WW2 gives one a deep appreciation of what is, and is not, important. In this case it lends support to NASA’s contention that the work, described in the story above, is actually important.
Interesting article. Refreshingly, they didn’t blame climate change and emissions of the precious air fertilizer for bad weather, not even once.
Too bad they didn’t mention how elevated CO2 is making crops more water-efficient and drought-resilient, helping to mitigate drought impacts.
Here’re a few rules of thumb to put global warming into perspective:
+0.5°C is about the temperature change you get from:
● an altitude / elevation decrease of 250 feet,
● or (at mid-latitudes), a latitude decrease of 30 miles.
In the American heartland, farmers can compensate for that much warming by planting about 3 days earlier in springtime.
I thought the American wheat belt had delays planting last spring because of cold weather.
A sensible man would not place these two thoughts in immediate juxtaposition.
The sale of wheat to the Soviet Union took the price of wheat in a loaf of bread from 3 cents to 4 cents. Rising union wages in the 1970s inflation made this insignificant in comparison. Oh, and most famine is the result of politics — rarely weather.
Kevin wrote, “most famine is the result of politics — rarely weather.”
That’s true now. But it did not use to be true.
Throughout human history, until very recently, catastrophic famines were common. Depending on your age, you might be old enough to remember when major famines were often in the news, in places like Africa and Bangladesh.
Anything that caused crop failures could cause famine, but the most common cause was drought.
But famines are rare, now, and the rising CO2 level is one of the reasons.
https://ourworldindata.org/famines
Famine used to be one of the great scourges of mankind, along with war and pestilence, the “Third Horseman of the Apocalypse.” But, for the first time in human history, major famines are fading from memory.
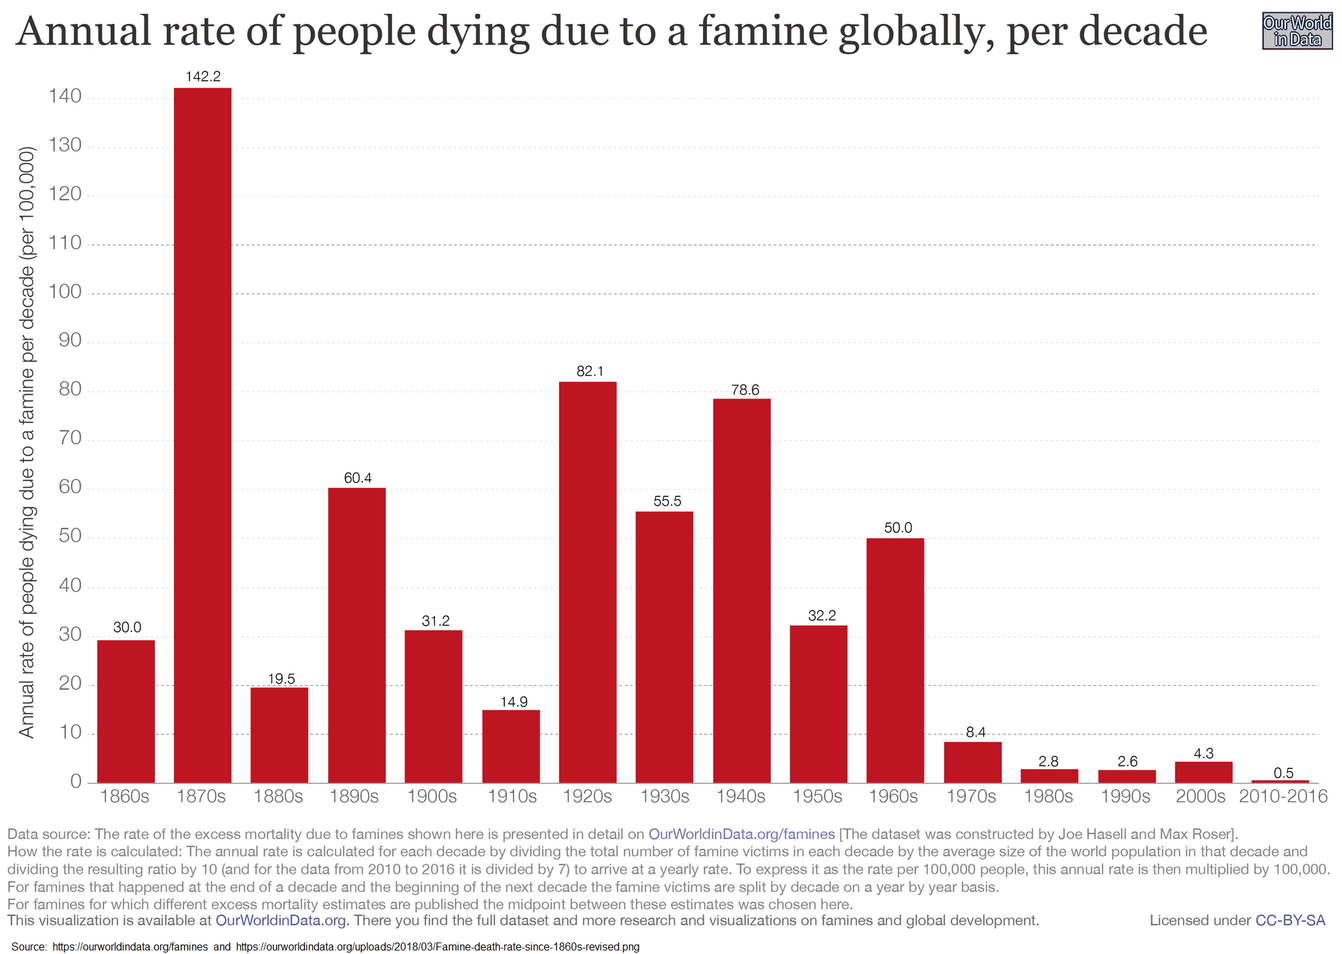
The importance is almost impossible to overstate. Compare:
● Covid-19 killed ≈0.05% of world population, so far.
● 1918 flu pandemic killed ≈2%.
● WWII killed ≈2.7%.
● The near-global drought & famine of 1876-78 killed an estimated 3.7% of the world population, when CO2 level (determined from ice cores) was ≈289 ppmv.
There are several reasons for the improvement, but one of the reasons is CO2 emissions. They’ve raised average atmospheric CO2 concentration by about 47%. That higher atmospheric CO2 concentration has increased global crop yields by an average of about 20%, and helped mitigate drought impacts, by making plants more water-efficient and drought-resistant, by reducing stomatal conductance. Here’s a paper:
http://www.sciencedirect.com/science/article/pii/S0168192310003163
Excerpt:
There’s a good chance the mid-West farmers will do really well this year. A lot of good looking corn and beans out there. We’ll find out in just a few weeks when harvest gets underway.
That is what we are seeing here in east central Kansas. Bumper corn crop and the soybeans are lush and green. Unless disaster hits it’ll be a bumper soybean crop as well.
Imagine how bad the vegetative index would look without higher CO2 making the plants more resilient.
And of course, if AGW is affecting droughts then it’s making them shorter and less severe, the actual trend.
Way to go AGW, high five.
This is a most interesting post.
Cause and Effect completely the wrong way roundism
Big Willyism
Big Sputnikism
Big Computerism
Wilful Blindness, Ignorance and Denialism
Self Importance-ism
These people have Got The Lot-ism and should be in jail
They are watching and allowing the entire US get turned into a new Sahara and are doing All The Wrong Things to stop it
If you want one figure-head, one name, one reason:
= The thoughts words and actions of Jim Steele – who we heard from recently.
I cried reading that self-promoting narcissism and perfectly deranged thinking.
How could anybody get anything So Wrong ##
silly question.
NASA do on a daily basis
Watching a bonfire burn, creating pretty pictures and self-importance out of it as they tacitly approve the throwing of petrol into it.
Is the work of people hell-bent on suicide.
Sometimes, I have No sympathy
## Hint/clue
Forests with closed canopies, despite daily thunderstorms with lightning strikes, Do Not Burn
Forests with holes in them do burn.
It is That Simple
How the he11 can Steele, how can anybody, not see that?
What is wrong with that guy, this place, the world?
What are we making a mountain out of a molehill with this week?
Drought in Utah….probably unprecedented.
Drought in the US looks kinda natural to me…
Drought isn’t something that occurs nationwide in the US .. it is highly regionalized, localized, actually. Within a given state, one county might be experiencing lower than normal precipitation, while the county next door is experiencing higher than normal precip, all the way from extreme drought to extreme wet.
Check out the updated precipitation map for the State of Colorado, produced by the “Colorado Climate Center” and you’ll see exactly that:
https://climate.colostate.edu/maps/precip_map_int.php?len=7days
“Drought isn’t something that occurs nationwide in the US”
It isn’t something that occurs nationwide in any country, with maybe some exceptions on the African continent.
This chart shows annual values of the Palmer Drought Severity Index, averaged over the entire area of the contiguous 48 states.
It was shown to give a broad overview of the cyclical nature of drought, I thought people on here would be able to understand that.
It won’t stop raining here in the central U.S. Not that I’m complaining.
Not saying it doesn’t happen, but famine isn’t what it used to be.
The corn crop in northern Portugal is looking great right now, these farmers know their corn and know how to grow it. Of course, it is all dent corn destined for animal feed and flour. Next year I plan to convince my very corn-savey neighbor to plant some sweet corn in a small section of one of his fields. This is one of the few things I miss living in Europe where corn is considered only fit food for livestock.
nice thought but the gmo dent muck will crosspollinate the good eating corn
I have thought of that, but the cross-pollinated corn won’t be used for seed but eaten fresh, so it won’t matter. I have observed and eaten cukes and squash that were the result of pollinators freely going from plant to plant in the garden. The resultant fruits were exactly what they were supposed to be and I didn’t save the seeds.
GMO has not effect on if it good to eat or not. All corn is GMO gene spliced or not. If you want to got back to eating nature corn be prepared for ears three inch long and and inch in diameter. Almost all food we eat is GMO gene splice or not, just in the past we used the slug hammer approach, introduce a gene smasher into the plant and see what we get, either nature exposure of many factors or by injecting virus, chemicals and disease. Gene splicing is just the new tool on the block and the useful idiot think the world is going to end. Just like the 1950 movies of what would happen from nuclear fallout, not were are not going to have kid whit horn from gene splicing food any more than we will have thirty foot ants. The real danger in the world is fool to plentiful and obesity, you know that a lot better the millions starving.
I personally like the Candy Korn sweet corn.
not a great lot of corn here mostly sweet for eating no gmo and not much maize
All corn you eat is GMO just not gene splice. Do you only eat the ancient Indian corn. If you don’t its been genetically modified.
All very well, but when are my greenhouse tomatoes going to ripen?
In west central Colorado the last six weeks of precipitation range from 1.75″ to 7.25″. Some places are experiencing drought, some not. Those amounts range from about 10% to 40% of the annual total.
Within 20 miles are large variations.
I live in Mesa in July and August we got a year worth of rain(above seven inches), the desert is green. Last year we got .2 of an inch, in the monsoon season. This year a complete turn around.
Utah?!
Utah is a very arid state and has been for millions of years.
Using Utah as an indicator for corn/plant health/growth is purposely duplicitous.
Perhaps the producers of this nonsense, NASA should have used corn health in less habitually arid states?
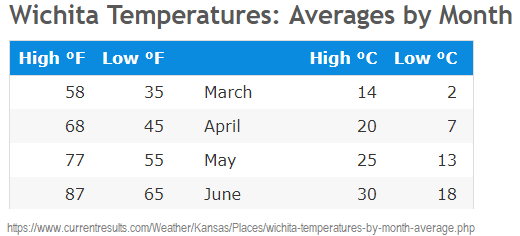
Utah is a generally arid state, but spring is usually the wet season, with the highest precipitation in March, April, and May. Farmers in Utah usually try to trap runoff from winter snow (in the mountains) and spring rains for irrigation use during the hot, dry summer, but last winter and spring were unusually dry (La Nina in place), and the snow on the mountains melted about two weeks earlier than usual.
According to the WUWT ENSO index, La Nina shifted to a weak El Nino during June, and has remained El Nino ever since. Salt Lake City got about triple its normal monthly rainfall in August (so far).
It’s also difficult to generalize about climate and rainfall in Utah, because rainfall can be very variable by region, with “hit-or-miss” thunderstorms in summer. In late July of this year, there was a summer “monsoon” in Arizona and southern Utah, with south winds blowing moisture out of the Gulf of California, hitting Arizona first, then southern Utah. While these bring much less rain than “monsoons” in India or southeast Asia, there were flooding rains in Cedar City and Moab in southern Utah in late July. Northern Utah got some rain during this period, but much less than southern Utah.
During El Nino years, the jet stream is farther south, and northern Utah can get heavy snow from weather fronts out of the Pacific Northwest.
Utah doesn’t grow much corn, but farmers there prefer crops that can get by with less water and can withstand the summer heat, as well as cattle ranching.
So, it called weather, I live in Arizona we have a monsoon season it may or may not rain it a desert. I also remember when I mover to western North Dakota, is semi-arid I move out June of 1980 it was brown and remained brown till August of 1981, During the time I live out there rain was scarce I had to vacuum the grasshoppers out of the engine compartment of my car. Farmer were dragging the topsoil out of the ditches back onto their fields. Drought happens that what we have to live with. As far as North Dakota wheat crop losses were at the most in a wet year fields of wheat were burned because the vomitoxin made it unsalable.
Mods, on this and other postings on WUWT, the images have not been showing up. This is a new condition. Any ideas?