To those of us who think things never change, these last few weeks have come as a bit of a shock. Maybe things will never be the same again.
But let’s imagine pupils go back to taking GCSEs and other qualifications at the end of Key Stage 4 and school performance tables are restored after a one-year hiatus.
Roll forward to 2025. Because no one took Key Stage 2 tests in 2020, Progress 8 can’t be calculated. What to do?
Change the prior attainment measure
One obvious answer is to do nothing. After all, there are well-known issues with Progress 8 and what can be inferred from it.
The alternative is to use a different baseline. Many schools administer CAT tests at the start of Year 7, for example. However, scaling up to a full national collection of CAT (or any other set of standardised tests) is unlikely to be a good use of anyone’s time following the disruption.
But we also have a full set of national Key Stage 1 data in the bank.
Clearly this is far less satisfactory than using Key Stage 2 data. For starters, there is a nine year gap between Key Stage 1 and Key Stage 4.
Secondly, there will be missing data for a small but not insubstantial number of pupils who arrived in England during Key Stage 2.
Thirdly, teacher assessment levels are not as granular as test results.
Finally, there are comparability issues between the Key Stage 1 results of infant schools and all-through primary schools.
KS1 to KS4 value added
To examine whether Key Stage 1 could be used as a baseline for Progress 8, I went back to the 2018 Key Stage 4 data for pupils in state-funded mainstream schools and linked it to their Key Stage 1 data. Around 4% could not be linked to Key Stage 1 data.
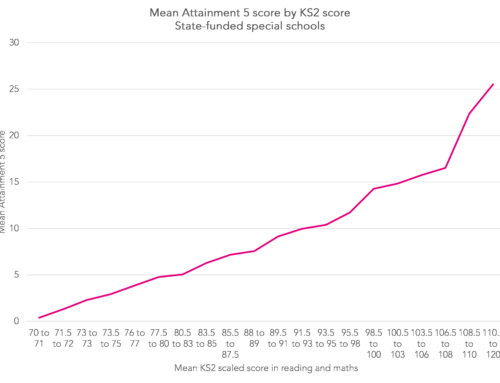
The table below shows how the correlation between Key Stage 1 and Key Stage 4 results compares to that between Key Stage 2 and Key Stage 4 results.[1] For my analysis, I used standardised Key Stage 1 results – that is, the results have been put onto a common scale with a mean of zero and a standard deviation of one.[2]

I then ran a simple Key Stage 1 value added model based on standardised Key Stage 1 score and a flag to indicate whether the school at which KS1 tests were taken was an infant/first school or an all-through primary/middle school.[3]
We can calculate each school’s mean value added score and compare it to its 2018 Progress 8 score. For the purposes of comparability, I recalculated Progress 8 so that it is calculated just for those pupils with KS1 results. The chart below shows this comparison.
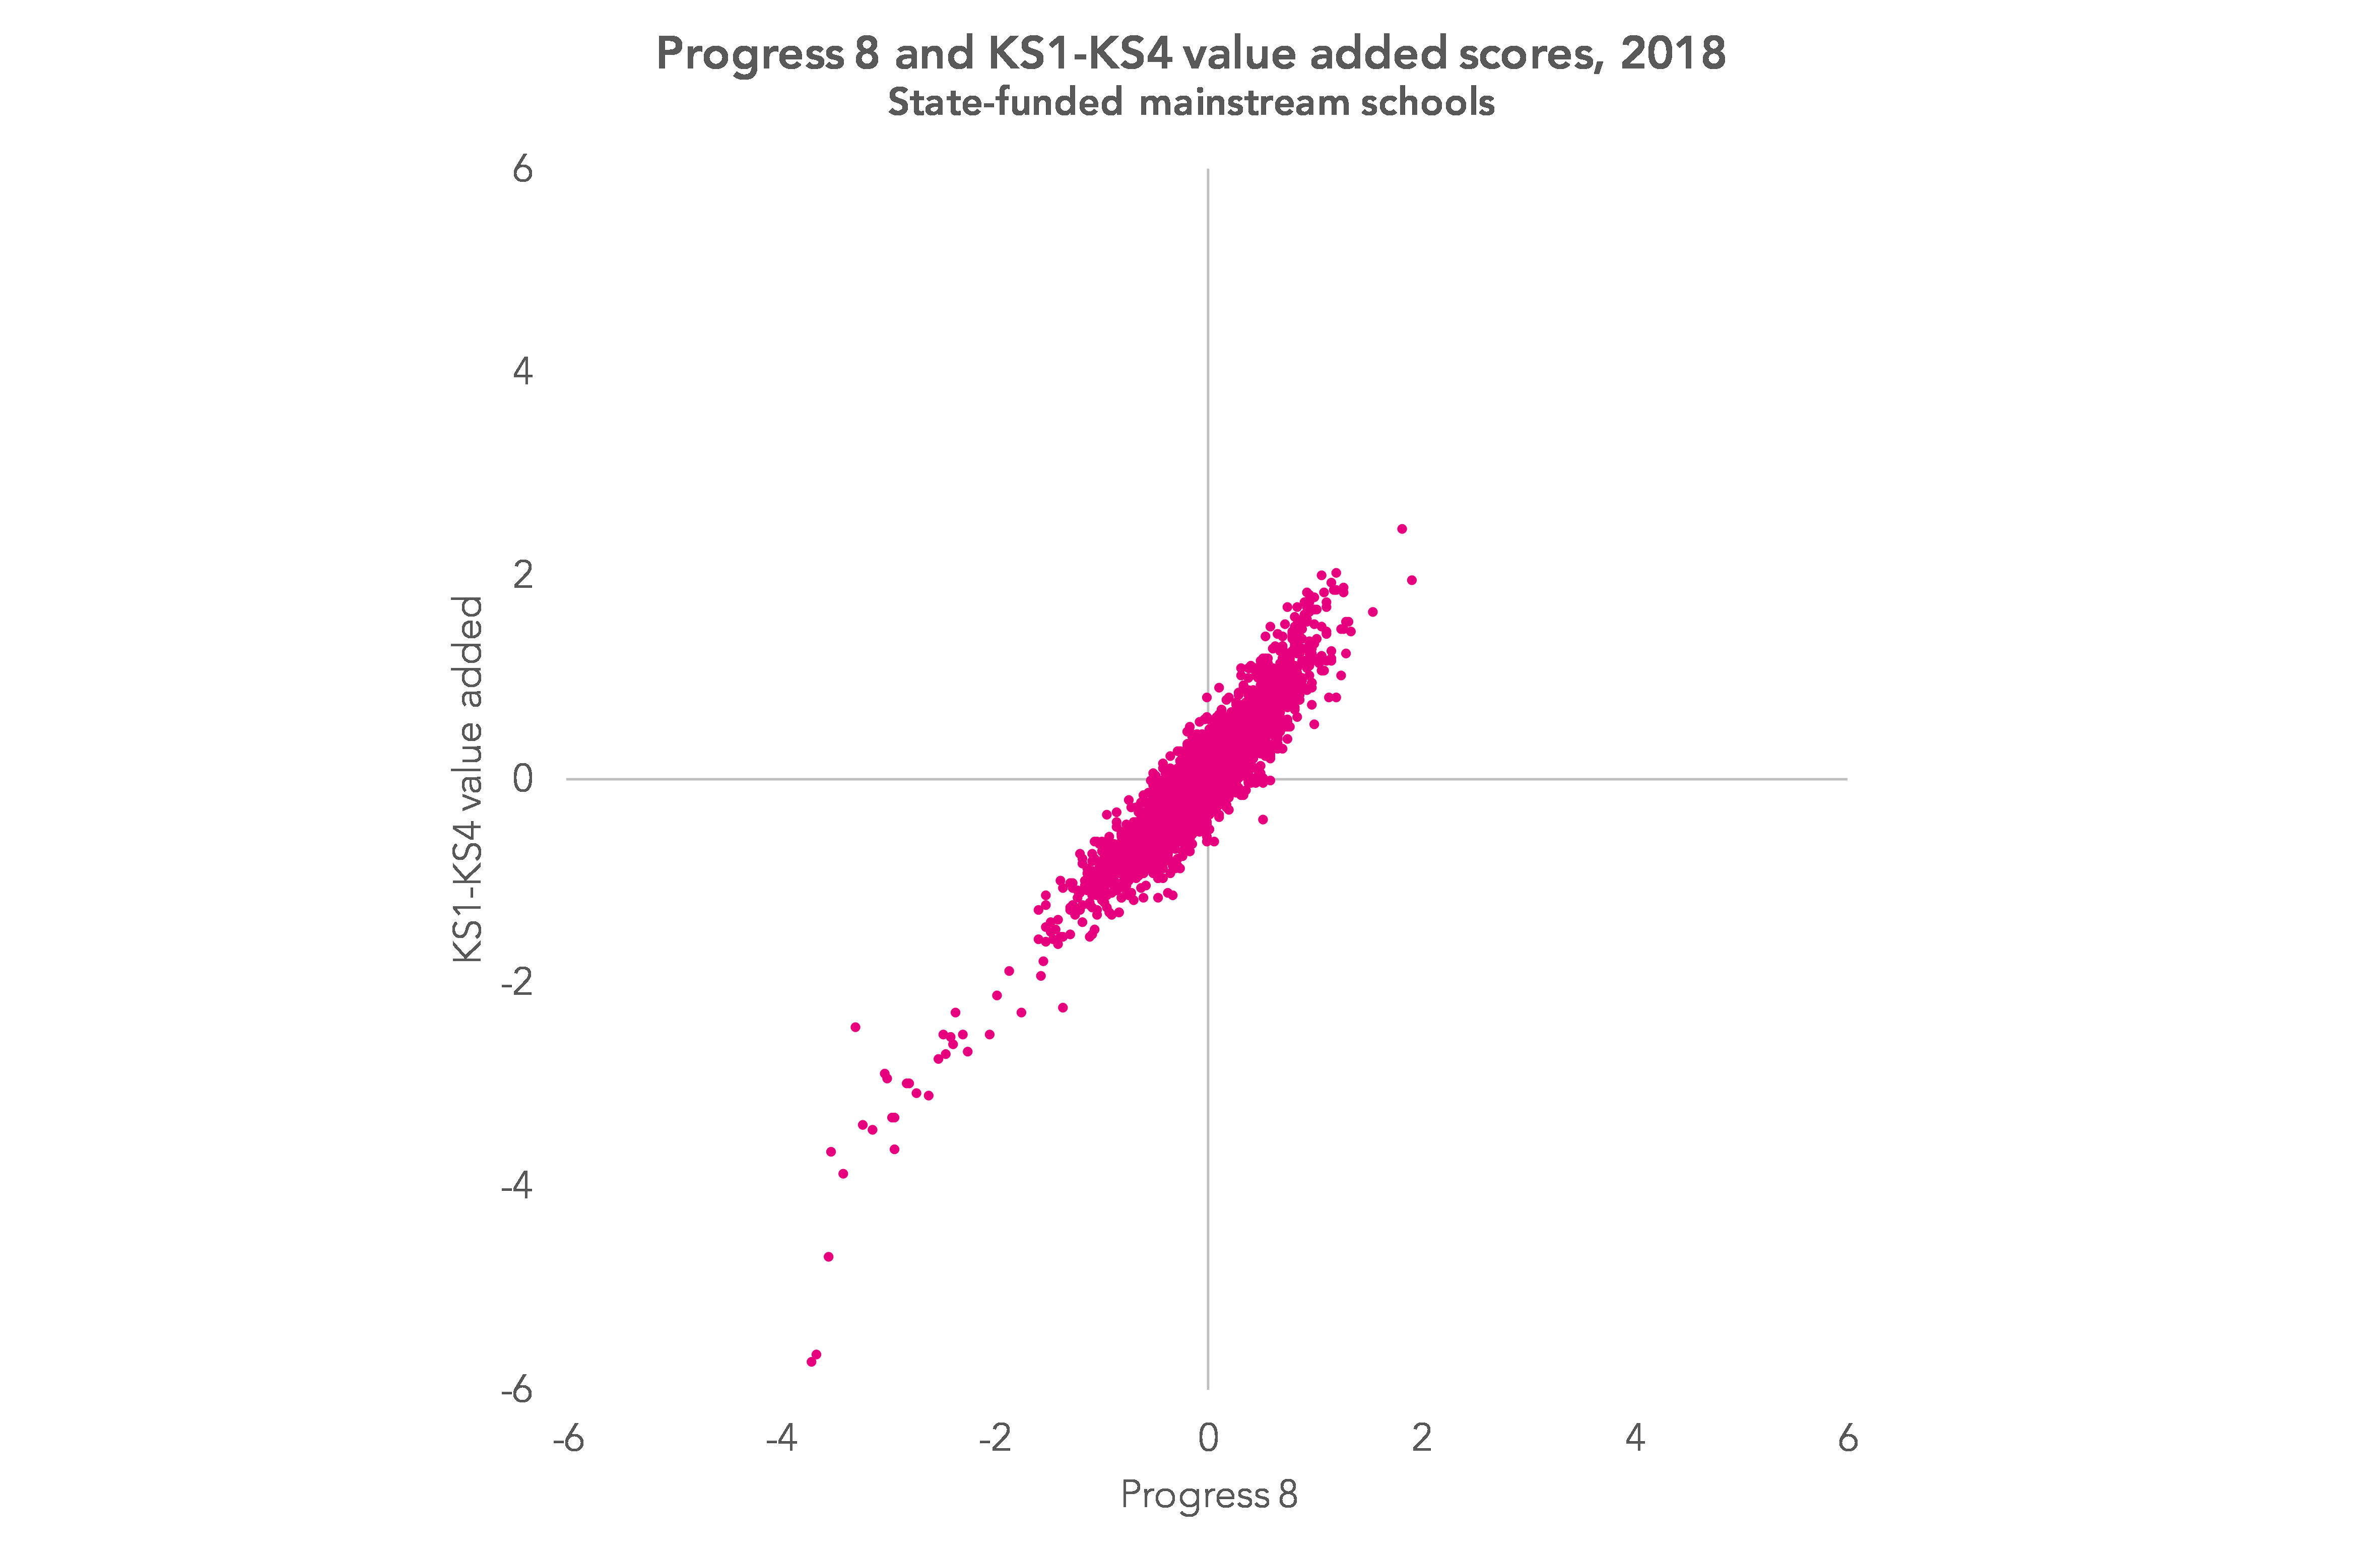
The correlation between the scores at school level is high (r=0.93). It remains high (r=0.91) even if we remove the outliers (scores below -2 or above +2). In fact, these correlations are higher than that between a school’s 2018 Progress 8 score and its 2019 Progress 8 score (r=0.86).
Nonetheless, this masks some quite large differences for some schools. A total of 150 schools (about 5%) change by more than 0.5, equivalent to half a grade per subject. Another 700 schools (just over 20%) change by more than 0.25. But in 1,700 cases (over half), the change is less than 0.16, which for reasons I set out here, I consider a small difference.
Schools in London appear to be particularly affected, with 10% changing by more than 0.5 and another third changing by more than 0.25. The chart below shows the picture regionally.
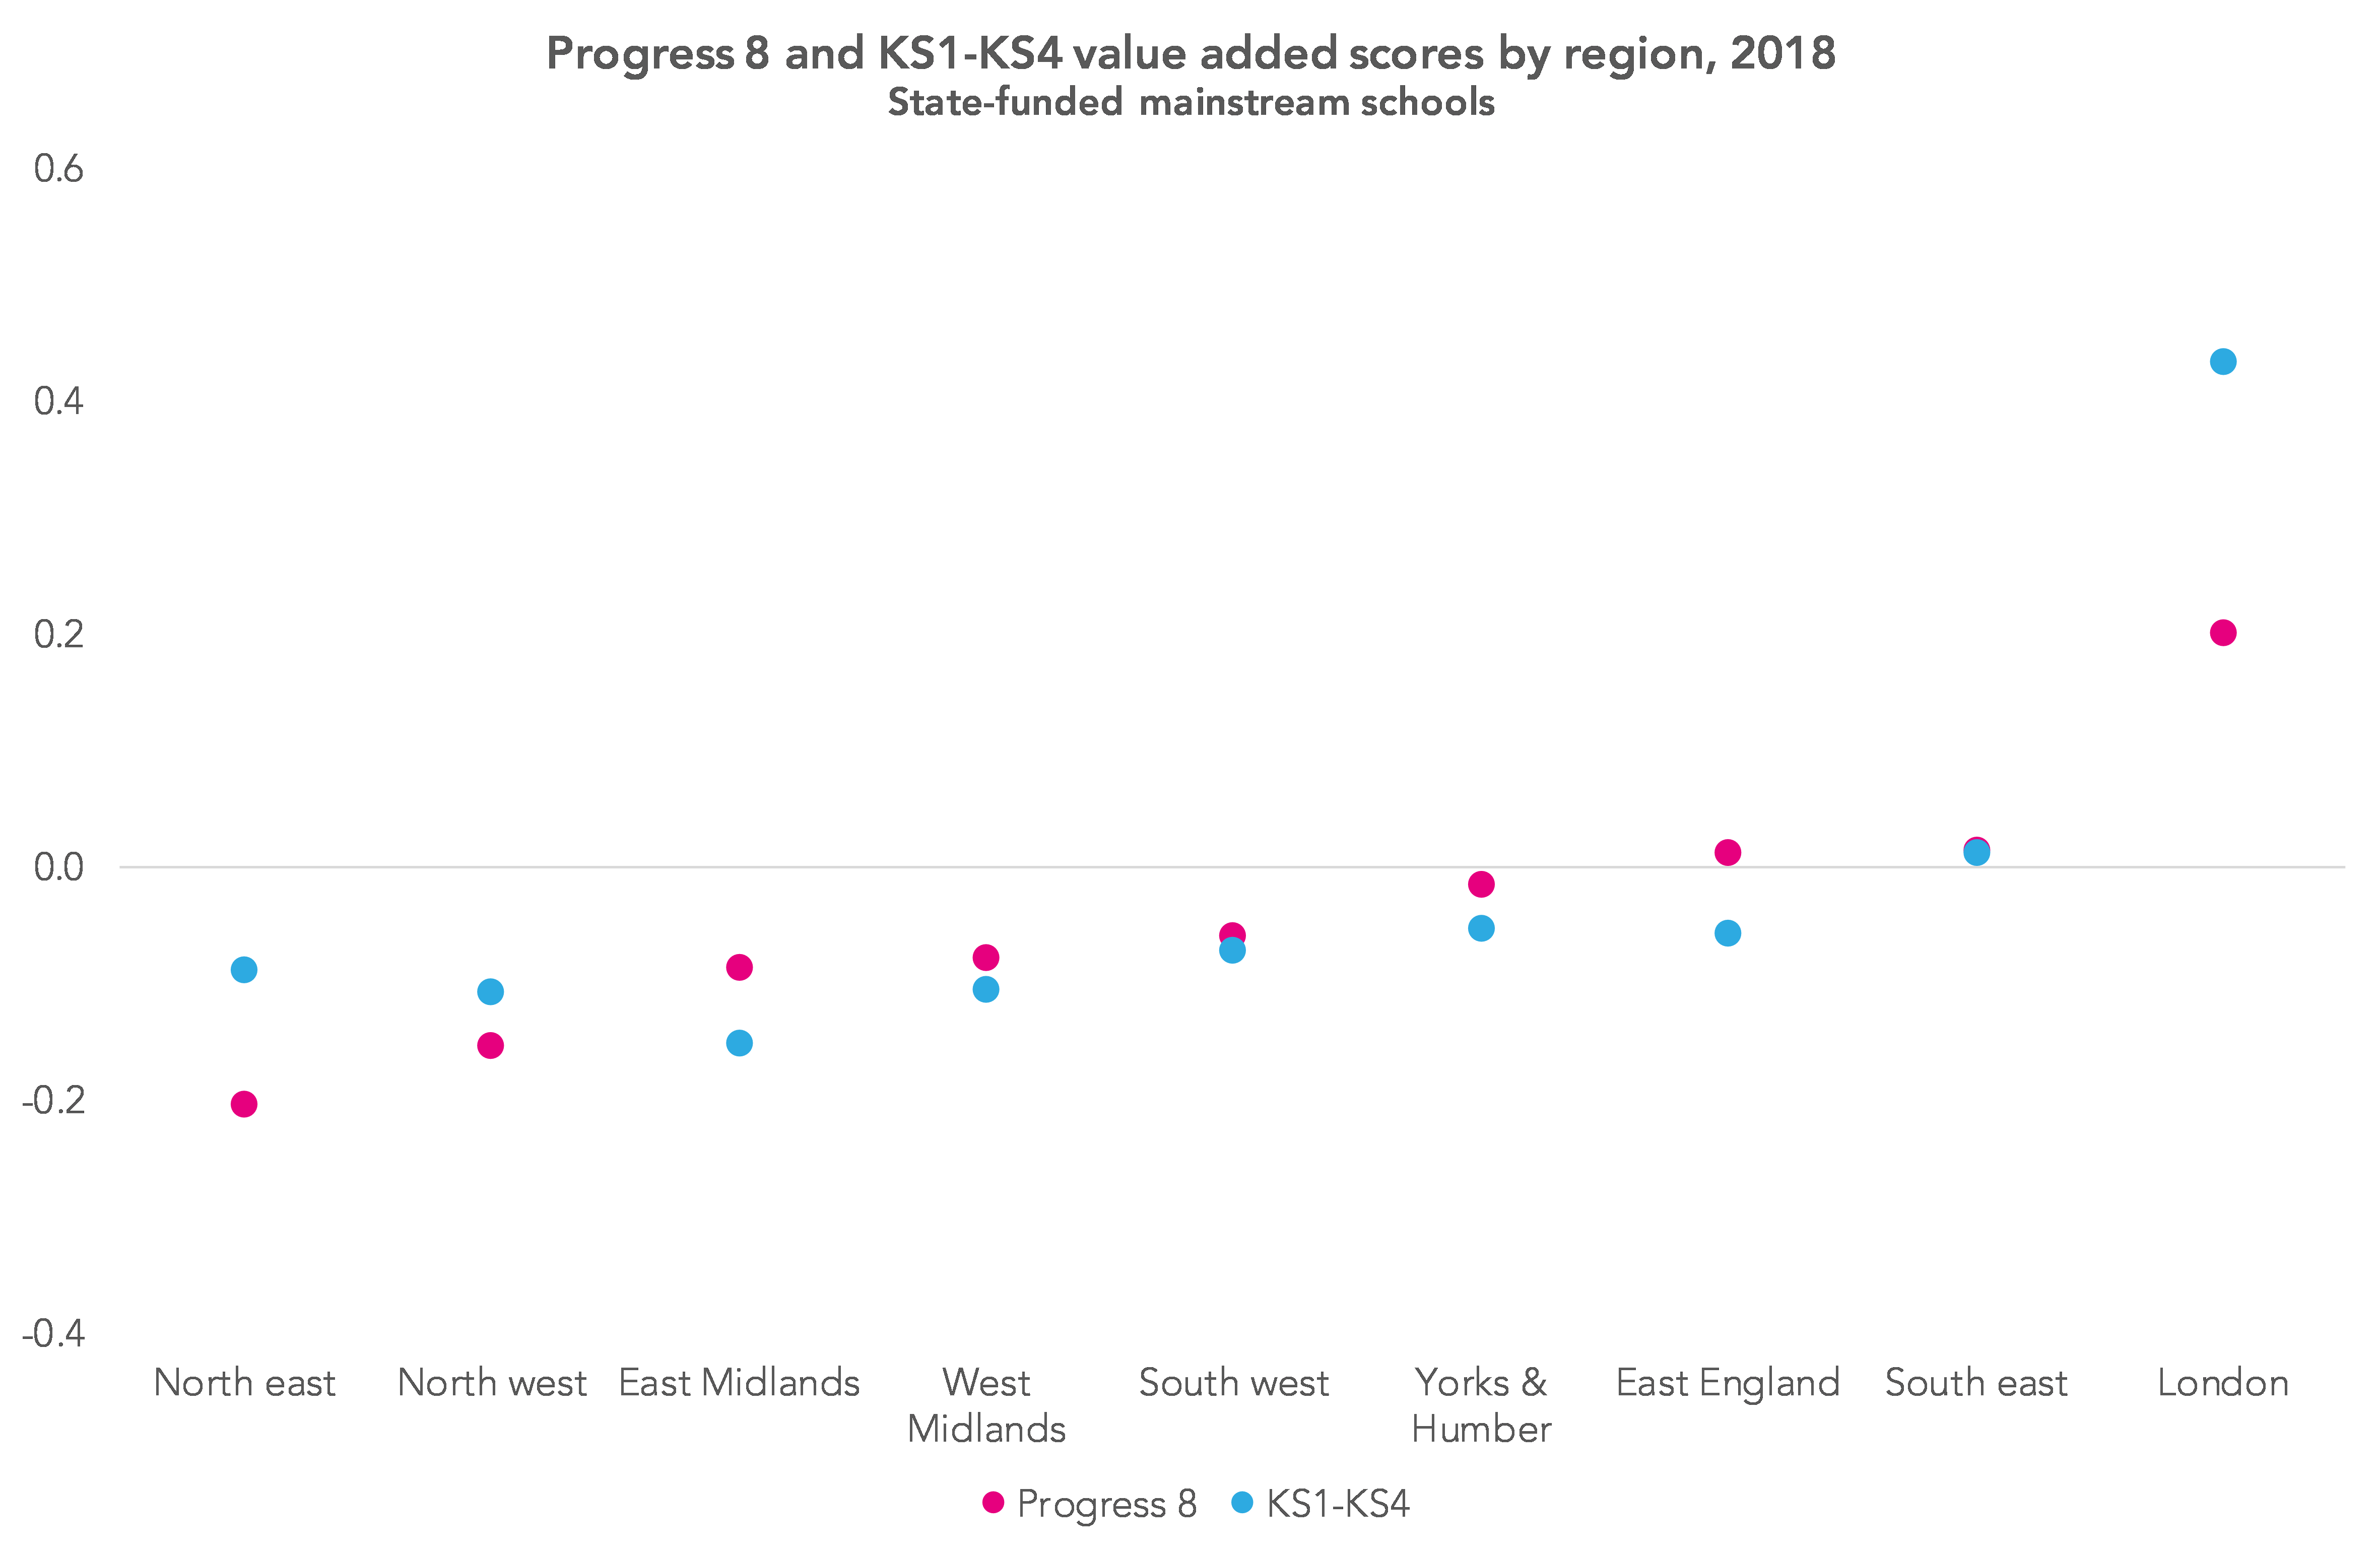
Part of the reason for this is that value added at Key Stage 2 in London tends to be higher. The same is true to a lesser extent for schools in the north east. In other words, these scores that I have calculated contain an element of value added from Key Stage 1 to Key Stage 2 as well as from Key Stage 2 to Key Stage 4.
Room for improvement
So what we have here is a way of calculating an alternative Key Stage 4 value added measure that produces results that are more similar to Progress 8 than perhaps you might expect for many schools.
It is possible that the model could be improved.[4]
But nonetheless it would probably still be considered unsuitable for school performance tables even if it produced results that more closely mirrored Progress 8. Just because a measure could be produced doesn’t mean it should.
It may well still be a useful measure to support school self-evaluation for the majority of schools. And, perhaps if schools in London are left to one side, using Key Stage 1 attainment as a baseline may provide Ofqual with useful statistical evidence when setting GCSE grade standards in 2025.
Want to stay up-to-date with the latest research from FFT Education Datalab? Sign up to Datalab’s mailing list to get notifications about new blogposts, or to receive the team’s half-termly newsletter.
1. The correlation between Foundation Stage total score and Key Stage 4 results is weaker still, at 0.632.
2. Standardisation is done by calculating percentile ranks for literacy (reading and writing) and maths and transforming the percentile ranks to the normal distribution. The average of the standardised scores for literacy and numeracy are then averaged.
3. The model fits a cubic line for standardised Key Stage 1, a flag for whether a school is infant/middle and an interaction between the flag and standardised Key Stage 1.
4. I also ran a two-stage model where I first predicted pupils’ Key Stage 2 results on the basis of Key Stage 1 results and pupil characteristics (gender, age, ethnicity, disadvantage, local authority at Key Stage 1) and used the predictions from this model as the basis of a Progress 8-style calculation. But this did not perform any better than the simpler model in terms of regional variation or school-level correlation with Progress 8.

“But let’s imagine pupils go back to taking GCSEs and other qualifications at the end of Key Stage 4 and school performance tables are restored after a one-year hiatus.
Roll forward to 2025. Because no one took Key Stage 2 tests in 2020, Progress 8 can’t be calculated. What to do?”
This article tunes in to a national debate about what life will look like after Covid-19. There is a growing consensus that it must be different in terms of the fundamental economic model, the nature of work and work-life balance. So too for education, in which case the best answer to your question “What to do?” is surely ‘nothing’.
Your article points out some of the many flaws in using SATs at KS1/KS2 as baselines for calculating ‘Progress 8’ But Progress 8 was invented to drive our marketised education system, which really does have to go.
Schools do need to evaluate their effectiveness and the Progress 8 indicator is completely useless for this purpose, so it needs to be consigned to the history of very bad educational interventions.
You are too dismissive of CATs. Not only are their correlations with GCSE higher than SATs, GL Assessment provide masses of sound data for using them for school and department evaluation purposes. This is too important a role for a commercial private company so we need to go back to something closer to the old NfER model.
You are right about KS2 SATs results incorporating KS1 progress. Where there are infant and junior schools, the latter’s KS2 SATs results are always lower because the pressure of league tables inflates the KS1 SATs of the infant schools. This is hopeless as a sound basis for any evaluation of school effectiveness.
All this and more is discussed in my my article
https://rogertitcombelearningmatters.wordpress.com/2016/10/27/more-problems-with-progress-8/
Hi Roger. I certainly didn’t intend to be dismissive of CATs- I think it’s extremely powerful. The point I was trying to make was that a full national collection of data in Year 7 (CAT or any other standardised test) by DfE might not be a good use of schools’ time, especially if it was just to calculate a performance measure in 5 years time. On another matter, in the KS1-KS4 value added measure I calculated I adjusted for differences between infant-only and all-through primary schools.