Michael Kile
What a treat. I had not been so flummoxed since reading Alan Sokal’s scholarly hoax over two decades ago: “Transgressing the Boundaries: Towards a Transformative Hermeneutics of Quantum Gravity”.
That the latest World Weather Attribution (WWA) post, Rapid attribution analysis of the extraordinary heatwave on the Pacific Coast of the US and Canada June 2021, has twenty-one contributors from prestigious research groups around the world gave it even more piquancy.
The WWA post, alas, is neither hoax nor parody, but the real deal: a collaboration – in record time -“to assess to what extent human-induced climate change made this heatwave hotter and more likely”. Whether “human-induced climate change” – whatever that is – was present at all was not on the menu.
So it’s down the rabbit hole of questionable-cause logical fallacies in search of an answer: post hoc ergo propter hoc: ‘after this, therefore because of this’; “since event Y followed event X, event Y must have been caused by event X”; or if you prefer, cum hoc ergo propter hoc: ‘with this, therefore because of this’.
A rooster crowing before sunrise does not mean it caused the sun to rise. A lot of roosters crowing before a big conference, however, could cause an increase in the flow of money into the Green Climate Fund. Cock-a-doodle-do.
Whatever the case, we clearly need a New Law of Climate Change:
Climate alarmism (CA) increases exponentially as time, T, to the next United Nations Conference of the Parties (COP) or atmospheric Armageddon (AA) declines to zero; where CA is measured by the frequency of MSM and social media amplification occurring in a specific period of observation, P.
As for the “extraordinary heatwave” last month, when competition with COVID threatens to steal your thunder, it pays to be as quick as greased lightning to trumpet panic and hyperbole. The paint was barely dry on June, 2021, when WWA concluded that while:
an event such as the Pacific Northwest 2021 heatwave is still rare or extremely rare in today’s climate, yet would be virtually impossible without human-caused climate change. As warming continues, it will become a lot less rare.
You might wonder how WWA could distinguish “human-caused climate change” from weather over such a short period; and determine “how much less severe” the heatwave “would have been in a [computer-generated] world without human-caused climate change.”
Well, it used published peer-reviewed methods to analyse maximum temperatures in the region most affected by the heat (45–52 ºN, 119–123 ºW).
Yet “the Earth is large and extreme weather occurs somewhere almost every day.” So which EWEs merit an attribution study? WWA prioritises those that “have a large impact or provoke strong discussion, so that its “answers will be useful for a large audience.”
For WWA the heatwave was a “strong warning” of worse to come:
Our results provide a strong warning: our rapidly warming climate is bringing us into uncharted territory that has significant consequences for health, well-being, and livelihoods. Adaptation and mitigation are urgently needed to prepare societies for a very different future. Adaptation measures need to be much more ambitious and take account of the rising risk of heatwaves around the world, including surprises such as this unexpected extreme…… In addition, greenhouse gas mitigation goals should take into account the increasing risks associated with unprecedented climate conditions if warming would be allowed to continue. (media release, 7 July, 2021)
It included two qualifications:
It is important to highlight that, because the temperature records of June 2021 were very far outside all historical observations, determining the likelihood of this event in today’s climate is highly uncertain.
Based on this first rapid analysis, we cannot say whether this was a so-called “freak” event (with a return time on the order of 1 in 1000 years or more) that largely occurred by chance, or whether our changing climate altered conditions conducive to heatwaves in the Pacific Northwest, which would imply that “bad luck” played a smaller role and this type of event would be more frequent in our current climate.
Yet WWA still concluded that:
In either case, the future will be characterized by more frequent, more severe, and longer heatwaves, highlighting the importance of significantly reducing our greenhouse gas emissions to reduce the amount of additional warming.
This kind of science might be alright as an academic game with complex computer models. During the past decade, however, so-called “rapid attribution analysis” has moved outside its core business into climate politics.
Researchers have become activists. Gaming uncertainty is the only game in town and the profession knows how to play it. Its media releases are a key driver of the UN’s multi-trillion dollar “ambition” to monetize “climate change” and greenmail the developed world.
Did WWA assess all the factors, including natural variability? Not according to the Cliff Mass Weather Blog:
Society needs accurate information in order to make crucial environmental decisions. Unfortunately, there has been a substantial amount of miscommunication and unscientific hand-waving about the recent Northwest heatwave. This blog post uses rigorous science to set the record straight….It describes the origins of a meteorological black swan event and how the atmosphere is capable of attaining extreme, unusual conditions without any aid from our species.
It ultimately comes down to the modelling. Is it meaningful or meaningless? WWA’s “validation criteria” assessed the similarity between the modelled and observed seasonal cycle, and other factors. The outcomes were described as “good”, “reasonable” or” bad”.
All the “validation results” appear in Table 3 of the WWA analysis. Of the 36 models used, the results from nine were deemed “bad” (25%), 13 were “reasonable” (36%), and the remaining 14 “good” (39%).
In a 2009 paper by Reno Knutti, et al., Challenges in combining projections from multiple climate models , the five authors stressed that: “there is little agreement on metrics to separate “good” and “bad” models, and there is concern that model development, evaluation and posterior weighting or ranking are all using the same datasets.”
In what other field would it be legitimate to select only the models merely considered “good”, or to average them in some way, then claim the process produces an acceptable approximation to the truth and reality? Imagine how the public would react to a COVID vaccine with an efficacy of only 39%.
How did we get to this point? It all began with ACE, the Attribution of Climate-related Events initiative. ACE’s inaugural meeting was held in Boulder, Colorado, 26 January 2009, at the National Center for Atmospheric Research (NCAR).
ACE released a four-paragraph statement. Its mission would be: “to provide authoritative assessments of the causes of anomalous climate conditions and EWEs”, presumably for the Intergovernmental Panel on Climate Change (IPCC).
ACE’s “conceptual framework for attribution activities” would be: “elevated in priority and visibility, leading to substantial increases in resources (funds, people and computers).”
Everyone had to sing from the same song-sheet:
A consistent use of terminology and close collaborative international teamwork will be required to maintain an authoritative voice when explaining complex multi-factorial events such as the recent Australian bushfires”.
Three years later, Dr Peter Stott, now Hadley Centre Head of climate monitoring and attribution, again stressed the importance of reining in mavericks and having a unified “authoritative voice”; this time in a conference paper.
“Unusual or extreme weather and climate-related events are of great public concern and interest,” he noted, “yet there are often conflicting messages from scientists about whether such events can be linked to climate change.”
All too often the public receives contradictory messages from reputable experts. If the public hears that a particular weather event is consistent with climate change they may conclude that it is further proof of the immediate consequences of human-induced global warming. On the other hand, if the public hears that it is not possible to attribute an individual event, they may conclude that the uncertainties are such that nothing can be said authoritatively about the effects of climate change as actually experienced.”
Do not confuse them with chatter about uncertainties. Imagine the furore if too many suspect that nothing “can be said authoritatively about climate change”. Yes, change is what the planet’s climate and weather do and have always done; but we can’t tell them it’s impossible to make predictions given all the complexity.
As for seeing EWEs as having anything other than a human cause, WWA, ACE and the Net Zero Carbon Club prefer to look the other way. They are determined to ensure no “conflicting messages” emerge about “climate change”.
This influential 2020 paper (ten authors) – A protocol for probabilistic extreme event attribution analyses – actually includes tips onhow to “successfully communicate an attribution statement”.
The eighth and final step in the extreme event attribution analysis is the communication of the attribution statement. All communication operations require communication professionals….. Communication here concerns writing a scientific report, a more popular summary, targeted communication to policy makers, and a press release. We found that the first one is always essential; which of the other three are produced depends on the target audiences….For all results it is crucial that during this chain the information is translated correctly into the different stages. This sounds obvious, but in practice it can be hard to achieve.
For struggling communicators, the authors offer some helpful suggestions:
A 1-page summary in non-scientific language may be prepared for local disaster managers, policy makers, and journalists with the impacts, the attribution statement, and the vulnerability and exposure analysis, preferably with the outlook to the future if available. The local team members and other stakeholders in the analysis can be invited to be points of contact for anyone seeking further clarification of contextual information, or they may be brought closer into the project team to collaborate and communicate key attribution findings.
The press release:
should contain understandable common language. Furthermore, we found that after inserting quotes from the scientists that performed the analysis, people gain more confidence in the results. This may include accessible graphics, such as the representation [below] of the change in intensity and probability of very mild months in the high Arctic as observed in November–December 2016, (van Oldenborgh et al., 2016a).

Social media: it “can be used to amplify the spread of attribution findings and contribute to public discourse on the extreme event being studied. Social media can help to reach younger audiences (Hermida et al., 2012; Shearer and Grieco, 2019; Ye et al., 2017). Social media monitoring and analytics can also be used to assess awareness and the spread of attribution findings” (Kam et al., 2019.
As for the text, WWA noted some intriguing “research into the efficacy of different ways to communicate results and uncertainties to a large audience.”
For instance, van der Bles et al. (2018) found that a numerical uncertainty range hardly decreases trust in a statement, whereas a language qualification does decrease it significantly. We also found that communicating only a lower bound, because it is mathematically better defined in many cases, is not advisable. In the first place a phrase like “at least” was found to be dropped in the majority of popular accounts. Secondly, quoting only the lower bound de-emphasizes the most likely result and therefore communicates too conservative an estimate (Lewandowsky et al., 2015).
What goes around comes around. Here we have a paper by cognitive psychologist, Professor Lewandowsky, et al., Seepage: Climate change denial and its effect on the scientific community
Vested interests and political agents have long opposed political or regulatory action in response to climate change by appealing to scientific uncertainty. Here we examine the effect of such contrarian talking points on the scientific community itself. We show that although scientists are trained in dealing with uncertainty, there are several psychological reasons why scientists may nevertheless be susceptible to uncertainty-based argumentation, even when scientists recognize those arguments as false and are actively rebutting them.
If real uncertainty– the alleged driver of Lewandowsky’s “seepage” and “ambiguity aversion” – has “arguably contributed to a widespread tendency to understate the severity of the climate problem”, and indeed to question its alleged severity, is it not a better outcome than pervasive confirmation bias and a multi-trillion dollar heist?
Nature is tricky too, and indifferent to our attempts to understand and control it. While the extreme summer heatwave was affecting the Pacific Northwest of North America last month, “global warming” apparently took a winter vacation in continental Antarctica.
Antarctica New Zealand, (ANZ), the government agency responsible for that country’s activities in Antarctica, issued this media statement on 16 June, 2021:
This winter Antarctica is freezing, no surprises there– but it’s colder than usual. As midwinter approaches on Monday, Antarctica is two degrees away from recording its coldest temperature ever!
According to ANZ’s Chief Scientific Advisor, Professor John Cottle:
This week the temperature at (Dome Fuji Station) – that’s (2400km) away from Scott Base plunged to -81.7C (record is -83.0C),
These temperatures are being caused by positive SAM (Southern Annular Mode) and a strong polar vortex.
It’s good news for this year’s sea ice, and will mean lots of sea ice growth. Sea ice is frozen ocean water that floats on top of the sea.
Dome Fuji Station is 3,810 metres above sea level and located on the second-highest summit of the East Antarctic ice sheet, at 77°30′S 37°30′E.
Antarctica’s coldest recorded temperature at ground level is -89.6°C at Vostok station on 21 July, 1983, but the Dome Fuji reading last month is close.
One swallow does not a summer make, of course, nor do a few unusually cold – or hot – days say much, if anything, about “climate change”.
Antarctica’s hottest day? Not so fast.
Ironically, a few days ago, on July 1, 2021, the World Meteorological Organization (WMO) recognized a new record high temperature for the Antarctic “continent” of 18.3° Celsius on 6 February 2020 at the Esperanza station (Argentina). (See the latest on-line issue of the Bulletin of the American Meteorological Society.)
The Antarctic Peninsula (the northwest tip near to South America) is among the fastest warming regions of the planet, almost 3°C over the last 50 years. This new temperature record is therefore consistent with the climate change we are observing.
Yet temperatures at the “northwest tip near South America” tell us next to nothing about the Antarctic continent itself, but that’s another story.
WMO’s expert committee:
stressed the need for increased caution on the part of both scientists and the media in releasing early announcements of this type of information. This is due to the fact that many media and social media outlets often tend to sensationalize and mischaracterize potential records before they have been thoroughly investigated and properly validated.
If only……
Michael Kile
11 July 2021
Western European heatwaves are clear as a bell. Brief Saharan plumes like in summer 2019 can only happen with low indirect solar driving negative NAO conditions with a meridional circulation pattern. There are several very similar examples in the 1880-1890’s.
The longer major heatwaves are all faster solar wind driving positive NAO conditions. It’s all a cause and not a product of climate change. This covers four out of the five hottest UK summers in the last 50 years:
https://www.linkedin.com/pulse/major-heat-cold-waves-driven-key-heliocentric-alignments-ulric-lyons/
Ulrich Lyons:
You mention “the brief Saharan plumes” of summer 2019
According to “Data:GIssSurfaceTemperatureAnalysis, their 250 km temperature map for July of 2019 shows France to be HOTTER than the Sahara region. How do you explain this?
Also, the cause of the warming was due to a stalled high pressure weather system, which is always associated with higher temperatures.
I have no idea why they form, but some persist for months, or years . Is this consistent with your solar wind explanation?
“Also, the cause of the warming was due to a stalled high pressure weather system, which is always associated with higher temperatures.”
And lower than normal temperatures at similar latitudes in other regions. That is the nature of the meridional circulation pattern. What air mass replaced the plume from the Sahara?
“I have no idea why they form, but some persist for months, or years”
Negative NAO conditions, else they could not form.
I can only point out to the fact, that most of “our” understanding of the GHE IS based on a logical fallacy. Well, the is next to some decisive and erroneous simplifications. And I think it is quite a tragedy how no one in the “critical” community could figure this out on his own and how reluctant people are to learn about their mistakes.
Anyhow, the GHE in reality looks something like this..
And the erroneus logic is described here..
https://greenhousedefect.com/the-beast-under-the-bed-part-1
Two simple questions related to the “GHE in reality” (your words) flow chart: clouds and GHGs are shown removing a total of 165 W/m^2 of power flux (per their negative signs), so:
Question 1: 355 W/m^2 (from the surface) minus 165 W/m^2 equals 190W/m^2 going to TOA, not the 240 W/m^2 indicated on the flowchart . . . is this just bad math or was something left out of the flow diagram?
Question 2: Since your flow chart is assumed to represent a time-averaged steady state flow process, where are the accumulating energies associated with clouds 80 W/m^2 of continuous power flux absorption and GHGs 85 W/m^2 of continuous power flux absorption being “stored” over time?
Now, you were saying something about “erroneous logic” . . .
Question 1: That is what the article explains. What the chart represents is the simple fact that clouds and GHGs are overlapped, by about 50W/m2. So a total GHE of 115W/m2 (= 355-240) is composed of 30W/m2 due to clouds only, 50W/m2 due to clouds AND GHGs overlapped, and 35W/m2 due to GHGs only. In fact the inability to deal with redundancy is one of the main flaws in “climate science”.
Question 2: Well the question seems a bit odd. The GHE is not a matter of energy flux in the first place. It is about the emission altitude and with it the emission temperature. So the higher up the emission level, within the troposphere at least, the less emissions occur.
If you have any more logical issues, you are welcome.
Ahhh, so what you’re saying is your “GHE in reality looks something like this” flowchart really does NOT represent reality since it is missing the “overlapped” “redundancy” (WTF?) shared by clouds and GHGs in addition to missing the emission altitude & emission temperature effects on
energypower flux values . . . power flux values that you yourself included in your diagram and had to go to lengths to explain how to interpret, whereas your answer to my Question 2 now asserts “The GHE is not a matter of energy flux in the first place.”Got it!
Again, the GHE is NOT about energy fluxes. It is about emission altitude and lapse rate(!), which in itself is not a flux of energy. The numbers above represent how much clouds and GHGs elevate emission altitude, lower emission temperature and thus emissions relative to surface emissions.
You do not need to understand it, in fact I could not care less..
I was brought up on stories of the dirty thirties. I suppose it depends on how you define ‘extremely rare’. For my parents and grandparents, severe heatwaves were all too common.
The Great Sandhills of southern AB and Sask are grasslands, have been so for a couple decades
Before that, was like the Sahara
Before that, grass
People should look up John Pallisar
In my AO in the northern part of my state, it’s been in the 50s and 60s since the snow finally melted by April 29, and now it sometimes reaches 80F. Sometimes. Cool nights are good sleeping weather, but sometimes, I’d like it just a tad warmer.
Earth is cooler with an atmosphere.
The GHGs need special energy upwelling from the surface radiating as a BB.
I have demonstrated by experiment how/why that is not possible.
Concede
Or
Refute
The ENTIRE greenhouse gas, man caused climate change, global warming controversy rests on the ASSUMPTION that the earth’s surface upwells 396 W/m^2 of long wave infrared energy as what is called a black body. A black body is a perfect absorber and emitter, i.e. it absorbs all the energy that strikes it and in turn radiates all of that energy.
That assumption is wrong.
Here’s why.
“The principle of science, the definition, almost, is the following: The test of all knowledge is experiment. Experiment is the sole judge of scientific “truth.””
Richard P. Feynman, “Six Easy Pieces”
https://principia-scientific.org/debunking-the-greenhouse-gas-theory-with-a-boiling-water-pot/
The non-radiative heat transfer processes of the contiguous participating atmospheric molecules prohibit the surface from upwelling LWIR as a BB and supplying the “extra” energy required by the GHGs to warm as advertised.
Greenhouse theory converts surface temperatures however measured into an upwelling power flux, W/m^2, ASSUMING that surface radiates as an ideal BB.
That ASSUMPTION, as demonstrated by experiment, is WRONG!!
ALL the rest is moot handwavium.
(Do NOT continue this anymore or I will be forced to delete it all) SUNMOD
Oh dear….
Principia-scientific again.
I know you know it’s verboten here.
For very good reason.
It is the only repository for sky-dragon slaying climate physics.
Hint:
There are no sky-dragons.
And
They dont need ‘slaying’.
Blog rules:
“Concede
Or
Refute”
Problem is that the refutation (which is easy) is never accepted by said (such as you) sky-dragon slayers.
So what is the point of us trying?
Sorry, but already the definition of emissivity is wrong..
“Emissivity = LWIR/Total Emergent”
No, emissivity is the rate of emissions relative to a blackbody with the same temperature. Also emissivity will correspond to 1-reflectivity at each respective wavelength, if transmissivity can be ignored.
It is painful to watch, since surface emissivity is indeed an important issue and it is not 1, but you will not sort out the physics like this. And at least with water we do know spectral hemispheric emissivity (the one that matters!) is about 0.91. So surface emissions will be about 355W/m2, not 390 or something..
https://greenhousedefect.com/what-is-the-surface-emissivity-of-earth
Spot on. However that IR is absorbed in a few metres over water in tropical oceans.
The majority of heat transport from tropical ocean surface is through latent heat. That heat fuels the heat engine that pumps water high into the atmosphere where it eventually solidifies in the temperature range 270 to 220K; releasing IR to space. The majority of OLR released above tropical oceans with precipitable water above 45mm is from the atmosphere above 270K.
On the flip side, that solidifying water reflects sunlight. Surface thermal equilibrium is achieved at 32C. Open ocean surface can never exceed 32C and regulates to 30C average due to convergence.
Atmospheric water is a cooling agent when TPW is above 45mm and a warming agent when TPW is below 45mm. So water as a radiative gas or solid play a role but there is no “Greenhouse Effect” warming the surface. Atmospheric water is a net cooling agent. Easy to verify by observing top of atmosphere energy balance over the oceans. You will find that atmospheric water above 45mm results in net cooling while atmospheric water below 45mm results in net warming.
“The earth is cooler with an atmosphere.” No, the earth is cooler and warmer with an atmosphere ….cooler during the day and warmer at night ….which provides a more livable average temp…..unlike the moon.
On a net basis the planet is cooler with the current atmosphere. In fact, water vapour in the present atmosphere limits ocean surface temperature to 30C and the distribution of surface water and orbital geometry results in average ocean temperature of 18.5C.
Suppose that we have an airless disk orbiting the sun and one side permanently faces the sun. Suppose also that the disk is a good insulator. If the sunward side is 200 degrees K and the shaded side is 0 K then the average is 100 K.
Suppose now that we have the same situation except the disk is a good thermal conductor and radiates the energy it receives equally from both sides. Because radiation is determined by the fourth power of the temperature, the average temperature will be something like 168 K.
So, just by distributing heat, you get a significant increase in the average temperature.
I leave it to you as an exercise to calculate the average temperature of the moon. Hint: it’s lower than the Earth’s average surface temperature.
Certainly true for the existing atmosphere.
The art of Propaganda is the most valued skill in ‘climate science’ these days.
The press release is formulated before the 1st sentence of the research report has been written
How else can they achieve the necessary rapid response?
It’s just like obituaries for famous people. Once celebrities reach a certain age, their obituaries are written up and put on the shelf, ready for rapid response. Most are probably only briefly reviewed and possibly slightly updated to choose between some boilerplate options that explain the circumstances of the actual death.
So it is with the weather porn as well.
The recent [type of event] in [place] has been conclusively determined to have been certainly caused by human-caused climate change, blah blah woof woof.
Hi Rich.
I can personally attest to the fact that obituaries for public figures are pre-written.
In my first job in newspapers, I had to spend many hours on slow news days proof-reading obituaries.
Got some interesting insights into the subjects that I would otherwise have not known however.
All knowledge is beneficial.
Poor saps need ‘attention’, ‘help’ and Dopamine.
Call Girls are good source of all those things, can we organise any?
Money better spent than on Heat Pumps that’s fo’sure
yes yes yes!!!!- ‘Heat Humps‘ are what’s needed.
haha – yes, I like that one 😀
(finger waggers will assert that ‘you should not laugh at your own jokes‘.
They can Take a Hike just like this lot proclaiming here. Y not laff, how else do you know if t’joke’s funny or not?
Are these folks Tedious or what)
A salutary medical analogy for the climate alarmists:
A doctor, who examines a patient and diagnoses incorrectly, may prescribe treatment that is either harmful or even deadly.
A compassionate doctor will be happy for his patient to seek a second opinion before starting a dangerous course of treatment.
They both push the vaccine.
Personal case in point.
I was being treated for rheumatoid arthritis for several years when the experienced Rheumatologist finally came to the conclusion that I had a chronic bacterial infection in my left wrist not RA. He retired and the new doctor, fresh out of school, simply decided I needed to be on Humira for the RA. I insisted she read the previous doctors notes. She called me uninformed. I was not able to be put on Humira due to a positive Quantiferon test for TB. She refered me to an Infectious Disease doctor to get rid of the laten TB so I could then go on Humira. Fortunately for me, the ID doctor knew the old RA doctor and trusted his diagnosis. She sent me to a hand surgeon for a biopsy. The hand surgeon decided to do a debridement instead of a simple needle biopsy due to the large mass in my wrist. They found my wrist was indeed compromised by a MAC infection. Again fortunately for me, the treatment for latent TB and MAC is the same, Azithromicyn, Rifampin and Ethambutol antibiotics. TB treatment length 4 months, MAC treatment length 12 months. After 2 1/2 months all is good so far. Kidney and liver function tests all OK. The swelling is almost gone, I have full motion of the wrist and no other signs of any RA. .Best of all, the two TB/MAC antibiotics are specific for those bacteria and do not do damage to my gut bacteria.
Why on Earth would anybody sane vote your contribution down?
Stephan Schneider’s remarks about uncertainty in climate studies and the dangers to the “narrative ” that he addressed to academics in their dual roles of scientist and activist come immediately to mind. “Climate Scientists (TM)” have clearly gone over entirely to one side of the “difficult choice” he described.
Another perspective is that the dual role of “scientist and activist” has essentially been transformed into activist with an academic title.
They are on a mission to “save the world” (like the Progressives new mission of “saving Democracy”) and the end (to them) clearly justifies the means.
The Dark Side of the Farce!
As is always the case in Scientology, it’s HOW you present the gobbledygook not the contents of said gobbledygook
And yes, that is a scientific term
CliSciFi practitioners.
In sales it is: “You don’t sell the steak, you sell the sizzle”.
Climate alarmists have been successfully selling the sizzle for more than a decade.
If one wants to “maintain an authoritative voice” the first order of business should be to establish an authoritative voice.
The Climate Cult never achieved that, and have gone downhill from day one.
High probability (>97%)
To “maintain an authoritative voice” one must always stick to the truth without evasion, exaggeration or bias. CliSciFi does all three and throws in lies.
Spencer’s 4th Law: The coefficient of veracity of an academic research publication varies inversely with the square-root of the number of authors.
The simple fact is that around 12,000 years ago Earth exited a glacial period and began warming naturally (i.e., without any impact of human emissions of CO2), consistent with its entry into the current interglacial period know as the Holocene.
Earth continuously warmed and reached an interval of peak atmospheric temperature, commonly known today as the “Holocene Optimum”, during an interval covering some 6,000-8,000 years ago . . . still no human emissions of CO2 to worry about. Since that peak-temperature interval, the Earth naturally cooled off . . . although there is open scientific debate over whether or not Earth globally has recently (last 250 years) returned to the range of Holocene Optimum atmospheric temperatures.
Consistent with Earth’s natural warming, again starting around 12,000 years ago, global sea-levels rose some 60-70 meters (200-230 feet) to present-day levels . . . sea-level rise reached rates as high as 45 mm/yr averaged over a thousand years prior to 6,000 years ago, which should be compared to today’s (last 30 years or so) average SLR of just 3 mm/yr.
Facts matter, or at least should . . . especially for those wanting to blame “global warming” on human emissions of CO2.
Joseph Goebbels would beam with pride at his acolytes in the WWA collaboration in their use of the Big Lie propaganda technique.
(note: the quote’s are the English translation from Hitler’s Mein Kampf, a technique of propaganda that Goebbels put into practice to great effect.)
The Big Lie technique used by the WWA collaborative is of course, as Michael Kile points out, was whether human-induced CC “was present at all was not on the menu“. The WWA assumed an outcome at the outset what the set out to test.
Excerpt from my paper
CLIMATE CHANGE, COVID-19, AND THE GREAT RESET Update 1d
“Rode and Fischbeck, professor of Social & Decision Sciences and Engineering & Public Policy, collected 79 predictions of climate-caused apocalypse going back to the first Earth Day in 1970. With the passage of time, many of these forecasts have since expired; the dates have come and gone uneventfully. In fact, 48 (61%) of the predictions have already expired as of the end of 2020.”
Climate doomsters have a perfect NEGATIVE predictive track record – every very-scary climate prediction, of the ~80 they have made since 1970, has FAILED TO HAPPEN.
Fully 48 of these predictions expired at the end of 2020. Never happened! Never will!
What are the odds at 50:50 per prediction?
3.6*10^-15 = 0.0000000000000036
There is a powerful logic that says no rational person or group could be this wrong, this utterly obtuse, for this long; they followed a corrupt agenda, and they lied again and again.
The ability to predict is the best objective means of assessing scientific competence, and the global warming alarmists have NO predictive track record – they have been 100% wrong about everything and nobody should believe these fraudsters – about anything!
This is the only new Law in the universe, published in early 2020.
Suggested Edit: Delete the word “Virtually”.
“MACRAE’S MAXIM”:
“VIRTUALLY EVERY SCARY PREDICTION BY GLOBAL WARMING ALARMISTS IS FALSE.”
Best regards, Allan
Allan ‘Rug up’ Macrae, not even wrong since 2004. You called me a liar on an earlier thread but when I pointed your howler…crickets. You’re an all-caps fake.
The big difference in 2020 is the hundreds of record-cold events all over the world. as listed at Electroverse.net.
We predicted this cooling in 2002 and we were correct.
In contrast Loydo’s warmist comrades have made almost 100 false predictions of
global warming catastrophes, not one of which has happened.
Loydo’s climate clowns are masters of false alarm – wolves stampeding the sheep for financial and political gain.
SOUTH AMERICAN CROPS HEADED FOR CATASTROPHE AS ANTARCTIC BLASTS PERSIST
July 19, 2021 Cap Allon
Production numbers continue to be slashed every time a new forecast is released. As it stands –and before the latest rounds of polar cold hit– 88% of Brazil’s corn is already in “poor or average condition” … with a further “significant reduction expected”.
“In fact I stated in 2002 that cooling would start circa 2020 – and it has…we correctly predicted this cooling based on low solar activity.”
But it cooled more in 1999, 2007, 2011 and 2017 than in 2020. How did you fail to predict those larger drops?
Bigger drops in 1984,1989, 1992 too. You cherry-pick the latest drop and tell people to “rug up”? lol There is only on Maclown.
See my posts about from Electroverse.net – more record cold events.
Loydo continues to mislead. Who pays him to post his drivel?
“Who pays him to post his drivel?”
Allan, I’m sure you already know this, but it bears repeating: when you stick a pig you can expect him to squeal.
Loydo is a bot, crudely programmed by the IPCC and the WEF.
AI is still in its infancy – long on the A (Artificial) and short on the I (Intelligence).
We should be nicer to Loydo.
– SPCM (Society for the Prevention of Cruelty to Machines)
Misleading? How? I’m just quoting you and reading off a graph.
DMI DATASETS REVEAL ARCTIC SUMMERS WERE WARMER BACK IN THE 1950S/60SJuly 19, 2021 Cap Allon
Daily mean temperatures in the Arctic have been holding BELOW the 1958-2002 average for the entirety of the 2021 melt season (so far) — another real-world reality the MSM won’t tell you.
Remember that “terrible” NW heat wave – that lasted only ~4 days. We got it here in Calgary, and temperatures were in the mid-30’s C (35C = 95F).
Today at 9am it was 14C – that’s 57 F and that is COLD.
If the alleged warming was CO2-driven, someone must have sucked out all the atmospheric CO2 in just a few days!
🙂
Right. You don’t even know the difference between climate and weather but you think you’re qualified to pontificate about a global climate change conspiracy. You need help.
I claim that sunrise causes cars and traffic and sunset abolishes them. It works very well during a few weeks of the year, but hey. Or I could claim that morning traffic slowly causes the sun to rise in the winter and vice versa in the summer. As long as you are willing to simply alter the relationship to suit the situation, there is no wrong answer.
If you hypothesize that there is a 8 to 12 hour lag, then you would be justified in claiming that morning traffic causes sunset. That is why Occam’s Razor is important as a guiding principle.
I once proved that humans are telepathic beings. Because every morning they appeared on the motorway to meet me when I went to work. How did they know I would be there if not by telepathy?
Why would the World Wrestling Association be commenting on climate change? Everyone knows they are completely fake!
“Why would the World Wrestling Association be commenting on climate change? Everyone knows they are completely fake!”
Alleged man-made catastrophic global warming is also completely fake – so where’s the problem?
In this Brave New World, the wokerati just fabricate lies and shout them loudly. and the imbeciles believe them.
“Politics is the art of looking for trouble, finding it everywhere, diagnosing it incorrectly and applying the wrong remedies.” – Groucho Marx
When I was at McGill in the 1960’s, there were over a dozen different Marxist parties. We categorized them into two groups: the angry, violent Groucho Marxists with their ugly, greasy-haired women, and the Harpo Marxists, with their “peace and love” mantras and their beautiful flaxen-haired women.
Marxism made simple!
The Groucho Marxists are the leaders – they want power for its own sake at any cost, and typically are sociopaths or psychopaths. The great killers of recent history, Stalin, Hitler, Mao, Pol Pot. etc. were of this odious ilk – first they get power, then they implement their crazy schemes that do not work and too often kill everyone who opposes them.
The Harpo Marxists are the followers – the “sheeple” – these are people of less-than-average intelligence who are easily duped and follow the Groucho’s until it is too late, their rights are lost and their society destroyed. They are attracted to simplistic concepts that “feel good” but rarely “do good”.
George Carlin said: “You know how stupid the average person is, right? Well, half of them are stupider than that!”
One can easily identify many members of these two groups in the global warming debate – and none of them are “climate skeptics”.
I have a better law: “The intensity and number of climate reports and general media climate hysteria intensity is inversely proportional to the time remaining to the next climate conference.” In the US less intense events occur when approaching a vote in the congress for climate issues. Other minor events occur before the off year elections for congress, and much larger events before presidential elections. While the possibility of approaching infinity is there, most generally saturation is reached when the allotted time is filled excluding commercials, and other money making media vehicles.
Before the heatwave hit I saw on the jet stream map that a big loop was coming up from Mexico. It then reached the coast and lodged over Oregon. This is a classic solar minimum pattern.
During solar minimums the Rossby wave are often very loopy and jet stream blocking events are more common. Remember during the last solar minimum the Great Moscow Heatwave in 2010? That was a jet stream blocking event which cooked Moscow for a month.
The NW of the US has the Rocky Mountains. They are as good a way to block a jet stream loop as the Urals east of Moscow.
Last solar minimum the climatistas screeched about global warming re the Moscow heatwave, with no plausible explanation of how CO2 can cause an increase in such things every 11 years.
Sadly I can’t give an archived jet stream map for the NW heatwave as the excellent CRWS jet stream site is now retired after the death of Prof. David Dempsey last year. Maps were archived and timestamped each 6 hours and could be individually linked to show such things as the NW US jet stream pattern for the heatwave.
Anyone who has truly studied climate history knows that it is now time for the next big ice age, which is caused by one of the Milankovitch Cycles. I am talking about the one which affects the shape of earth’s orbit around the sun and makes it more elliptical. Recall that marvelous planetary conjunction between Jupiter and Saturn last December, followed by a brutal cold February and cool spring. A more elliptical orbit cam make the winters longer and colder, the summers shorter and hotter. The long, cold winters allow for ice buildup on the northernmost continents which then does not have the chance to melt in the summer.
The typical climate cycle, roughly speaking, is 10,000 years of warmth and 90,000 years of ice age. We have had our 10,000 years of warmth; the little ice age in the 1600’s was the coldest earth has been in the past 10,000 years. Think about it!
The only pursuit more sketchy than climate science is attribution science. I find it hard to believe that it could be taken seriously by anyone.
“would be virtually impossible without human-caused climate change”
In 1979, Charney proposed a range for climate sensitivity using a small handful of climate models of the day. The “Charney Range” hedged his bets with a 3-fold range (1.5 to 4.5 degrees C average surface temperature rise per doubling pCO2) and let’s not forget the average surface is 75% uninhabited ocean surface. Charney is not exactly informative, but it was a start and gave the research community something to work on.
Charney made it clear that regional detail was non-existent at the time, but held out hope for the future: “At present, we cannot simulate accurately the details of regional climate and thus cannot predict the locations and intensities of regional climate changes with confidence. This situation may be expected to improve gradually as greater scientific understanding is acquired and faster computers are built.”
The Charney Range has never been reduced or improved, despite a well-funded research effort over the last 40 years. Given that climate research has drawn a blank on the most basic task of quantifying climate sensitivity (for the average surface), what basis can there be for a claim to attributed any particular event to CO2 emissions?
Inability to improve on the Charney Range helps to put these overblown claims in context.
Exactly.
Climate ‘science’ has had one job for the past ~ 40 years.
Epic FAIL.
There is climate change. The Southern Hemisphere has been cooling since perihelion has occurred after the austral summer solstice in 1585. The flip side is that the northern hemisphere is now warming up. This has nothing to do with CO2.
Within two millennia, the next glaciation of the land masses around the North Atlantic will begin as the rate of evaporation from the tropical Atlantic Ocean and snowfall over land overtakes the rate of ice melt.
Making CO2 the scapegoat for all notable weather events excludes observation of real changes occurring.
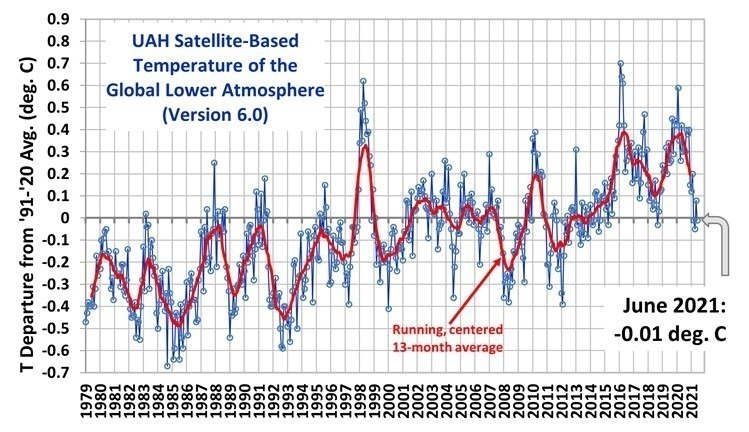
Here is simple proof that they are wrong – UAH global temp for the past few months have been close to ZERO variation from the late 20th century average. How could global warming have caused a heat wave, when global temps have been back to “normal” for months ?
Easy, just as the extreme cold in Texas a few months ago was a sign of global warming. CAGW causes both heating and cooling, and if the temperatures are just near average, we can say the two cancelled each other out. Kind of like the weather in Europe…if it’s hot, obviously that’s global warming, if it’s cold, it’s because the Gulf Stream is slowing down, due to global warming. No need for objective falsification in this theory, darn it!
In his seminal work, Downs describes why the Alarmists “must” keep cranking up their terrorism’s volume/danger:
1. The pre-problem stage. This prevails when some highly undesirable social condition exists but has not yet captured much public attention, even though some experts or interest groups may already be alarmed by it. Usually, objective conditions regarding the problem are far worse during the pre-problem stage than they are by the time the public becomes interested in it. For example, this was true of racism, poverty, and malnutrition in the United States.
2. Alarmed discovery and euphoric enthusiasm. As a result of some dramatic series of events (like the ghetto riots in 1965 to 1967), or for other reasons, the public suddenly becomes both aware of and alarmed about the evils of a particular problem. This alarmed discovery is invariably accompanied by euphoric enthusiasm about society’s ability to “solve this problem” or “do something effective” within a relatively short time. The combination of alarm and confidence results in part from the strong public pressure in America for political leaders to claim that every problem can be “solved.” This outlook is rooted in the great American tradition of optimistically viewing most obstacles to social progress as external to the structure of society itself. The implication is that every obstacle can be eliminated and every problem solved without any fundamental reordering of society itself, if only we devote sufficient effort to it. In older and perhaps wiser cultures, there is an underlying sense of irony or even pessimism which springs from a widespread and often confirmed belief that many problems cannot be “solved” at all in any complete sense. Only recently has this more pessimistic view begun to develop in our culture.
3. Realizing the cost of significant progress. The third stage consists of a gradually spreading realization that the cost of “solving” the
problem is very high indeed. Really doing so would not only take a great deal of money but would also require major sacrifices by large groups in the population. The public thus begins to realize that part of the problem results from arrangements that are providing significant benefits to someone—often to millions. For example, traffic congestion and a great deal of smog are caused by increasing automobile usage. Yet this also enhances the mobility of millions of Americans who continue to purchase more vehicles to obtain these advantages.
In certain cases, technological progress can eliminate some of the undesirable results of a problem without causing any major restructuring of society or any loss of present benefits by others (except for higher money costs). In the optimistic American tradition, such a technological solution is initially assumed to be possible in the case of nearly every problem. Our most pressing social problems, however, usually involve either deliberate or unconscious exploitation of one group in society by another, or the prevention of one group from enjoying something that others want to keep for themselves. For example, most upper-middle-class whites value geographic separation from poor people and blacks. Hence any equality of access to the advantages of suburban living for the poor and for blacks cannot be achieved without some sacrifice by middle-class whites of the “benefits” of separation. The increasing recognition that there is this type of relationship between the problem and its “solution” constitutes a key part of the third stage.
4. Gradual decline of intense public interest. The previous stage becomes almost imperceptibly transformed into the fourth stage: a gradual decline in the intensity of public interest in the problem. As more and more people realize how difficult, and how costly to themselves, a solution to the problem would be, three reactions set in. Some people just get discouraged. Others feel positively threatened by thinking about the problem; so they suppress such thoughts. Still others become bored by the issue. Most people experience some combination of these feelings. Consequently, public desire to keep attention focused on the issue wanes. And by this time, some other issue is usually entering Stage Two; so it exerts a more novel and thus more powerful claim upon public attention.
The post-problem stage. In the final stage, an issue that has been replaced at the center of public concern moves into a prolonged limbo—a twilight realm of lesser attention or spasmodic recurrences of interest. However, the issue now has a different relation to public attention than that which prevailed in the “pre-problem” stage. For one thing, during the time that interest was sharply focused on this problem, new institutions, programs, and policies may have been created to help solve it. These entities almost always persist and often have some impact even after public attention has shifted elsewhere. For example, during the early stages of the “War on Poverty,” the Office of Economic Opportunity (OEO) was established, and it initiated many new programs. Although poverty has now faded as a central public issue, OEO still exists. Moreover, many of its programs have experienced significant success, even though funded at a far lower level than would be necessary to reduce poverty decisively. Any major problem that once was elevated to national prominence may sporadically recapture public interest; or important aspects of it may become attached to some other problem that subsequently dominates center stage. Therefore, problems that have gone through the cycle almost always receive a higher average level of attention, public effort, and general concern than those still in the pre-discovery stage.
http://fbaum.unc.edu/teaching/articles/Downs_Public_Interest_1972.pdf
Its media releases are a key driver of the UN’s multi-trillion dollar “ambition” to monetize “climate change” and greenmail the developed world.
The Science has an agenda. The global cabal seeks to subvert and enslave, rob and impoverish, command and control, defeat and destroy. Climate Alarmism is one of many weapons they wield.
In the case of the Great Heat Wave, however, the effect of this weather anomaly was minuscule. Three hot days were minor. There was no disaster. The alleged handful of deaths were mis-attributed. There has been no lasting impact. It came, it went, and was no big deal. The Great Heat Wave did less damage than a typical winter storm, and much less than a hurricane, flood, tornado, or earthquake. A big yawn. Much ado about nothing.
So it is just word salad telling the same lies about climate and weather. Yawn.
There is something I could not understand.
Imagine the Earth without any greenhouse gases. There is perfect energy balance. The incident solar energy is exactly equals to radiated energy. Now let’s add greenhouse gases to the atmosphere. Temperature will rise and now radiated energy become greater than incident energy?
“Climate Change”; The gift that keeps on taking.
From the article: “Our results provide a strong warning: our rapidly warming climate is bringing us into uncharted territory ”
The problem with that claim is we are *not* experiencing a rapidly warming climate, and we are nowhere near uncharted territory. This is a figment of alarmists imagination.
The truth is the Earth has cooled about 0.6C since the 2016 temperature highpoint.
UAH satellite chart:
Was there ever the slightest hint of doubt that the heat wave in question would be attributed to “human caused climate change”? Of course not.
In the extremely unlikely event that models might have indicated that the heat wave was not related to human activity, despite Herculean efforts of paramaterization, I think we can safely assume that the study would not have seen the light of day.
The fundamental precept of the Attribution Branch of the Bad News Factory is – any weather event that causes discomfort, inconvenience, property damage, injury or loss of life (i.e. anything that’s not totally benign) MUST be attributable to human caused climate change. And the level of uncertainty in a weather-event attribution is inversely related to the severity of the event being attributed.
does climate science predict more heatwaves and more extreme rain events? I think it does… and here they are.
“Climate science” aka climastrology predicts a lot of things, and nope, they are not here, despite your most fervent desire for them to be.
I wish people would stop calling them “models” and start calling them what they are: “software”.
It would be much easier for people to understand that complex software only says what you want it to say. Nothing more, nothing less.
That the latest World Weather Attribution (WWA) post, Rapid attribution analysis of the extraordinary heatwave on the Pacific Coast of the US and Canada June 2021, has twenty-one contributors from prestigious research groups around the world gave it even more piquancy.
Wanna take a bet on whether they had it made up already years ago and just needed to fill inn dates and places?
“prestigious research groups” By whose claim and standard?
Oddgeir
I keep asking myself two questions:
Why does this august blog accept the term “global warming” purely in terms of atmospheric temperature change, without considering the enormous differences between 100 degree F air with 70% humidity content, as often occurs in pre-monsoon Delhi , and the same 100 degree F with only 15% humidity, typical of Death Valley? Is enthalpy even a concept any more?
Why let slide the use of the Celsius scale when describing temperature differences in terms of percentage change, when the same percentage change on the Kelvin scale is much lower for the same difference?
Since the size unit is the same for both C and K, a 2 degree change from 100 to 102 in Celsius is obviously 2%, but in Kelvin it’s only 375/373 = 0.5%. Not nearly as scary.
So…wattsupwiththat?
Here is one to add to your collection. It’s a pity he died before the era of global warming clap trap.. Arthur Paul Pedrick – Wikipedia