Alongside the primary school league tables, Key Stage 2 multi-academy trust performance measures have been published today.
These follow the usual basis of only including schools that have been with a MAT for a minimum of three years, and weighting school results by the (capped) length of time schools have been part of the MAT and pupil numbers.
FFT Aspire
MATs: you can find more in-depth analyses for you and your schools in FFT Aspire.
Not an FFT Aspire user?
Learn more here.
Comparing one trust’s progress scores with another’s isn’t overly meaningful – in large part due to the fact that context isn’t taken into account in these progress scores. Trusts that operate mostly in areas with high English as an additional language rate, for example, are more likely to achieve high progress scores.
But comparing the reading, writing and maths results of a given trust should be more meaningful, given, to a great extent, it will be the same pupils counted in each measure.
The chart below shows the reading, writing and maths progress scores for the 30 primary MATs that had more than 500 pupils at the end of KS2. A score of +1 equates to pupils on average being one scaled score point above what would be expected given pupils’ KS1 results.

In the case of many trusts the spread of progress scores is relatively small. There are a few trusts where the spread is much greater though: 2.9 scaled score points between writing and reading progress scores at the L.E.A.D. Academy Trust; 2.4 points between the same measures at E-ACT; and likewise 2.3 points at the Park Federation.
It’s worth saying that the DfE publishes confidence intervals for all KS2 progress scores. It describes these as “a proxy for the range of scores within which each school’s underlying performance can be confidently said to lie“.
Even when taking the upper limit of the confidence interval for reading and the lower confidence interval limit for writing, the gap between results for these two subjects still looks relatively large: 1.9 scaled score points in the case of the L.E.A.D. Academy Trust, 1.4 points in the case of E-ACT and 1.3 points in the case of the Park Federation.
This suggests that some trusts could boost progress scores by healthy amounts if reading results were brought up to the same level as writing results.
Sponsored academy writing scores[1]
One thing that stands out to us in the above is that in quite a few cases progress in writing is higher than it is in reading and maths.
We’ve looked into this further, and sponsored academies seem to be more likely to have writing progress scores that are higher than their reading and maths progress scores than is the case for other types of school. See the chart below.

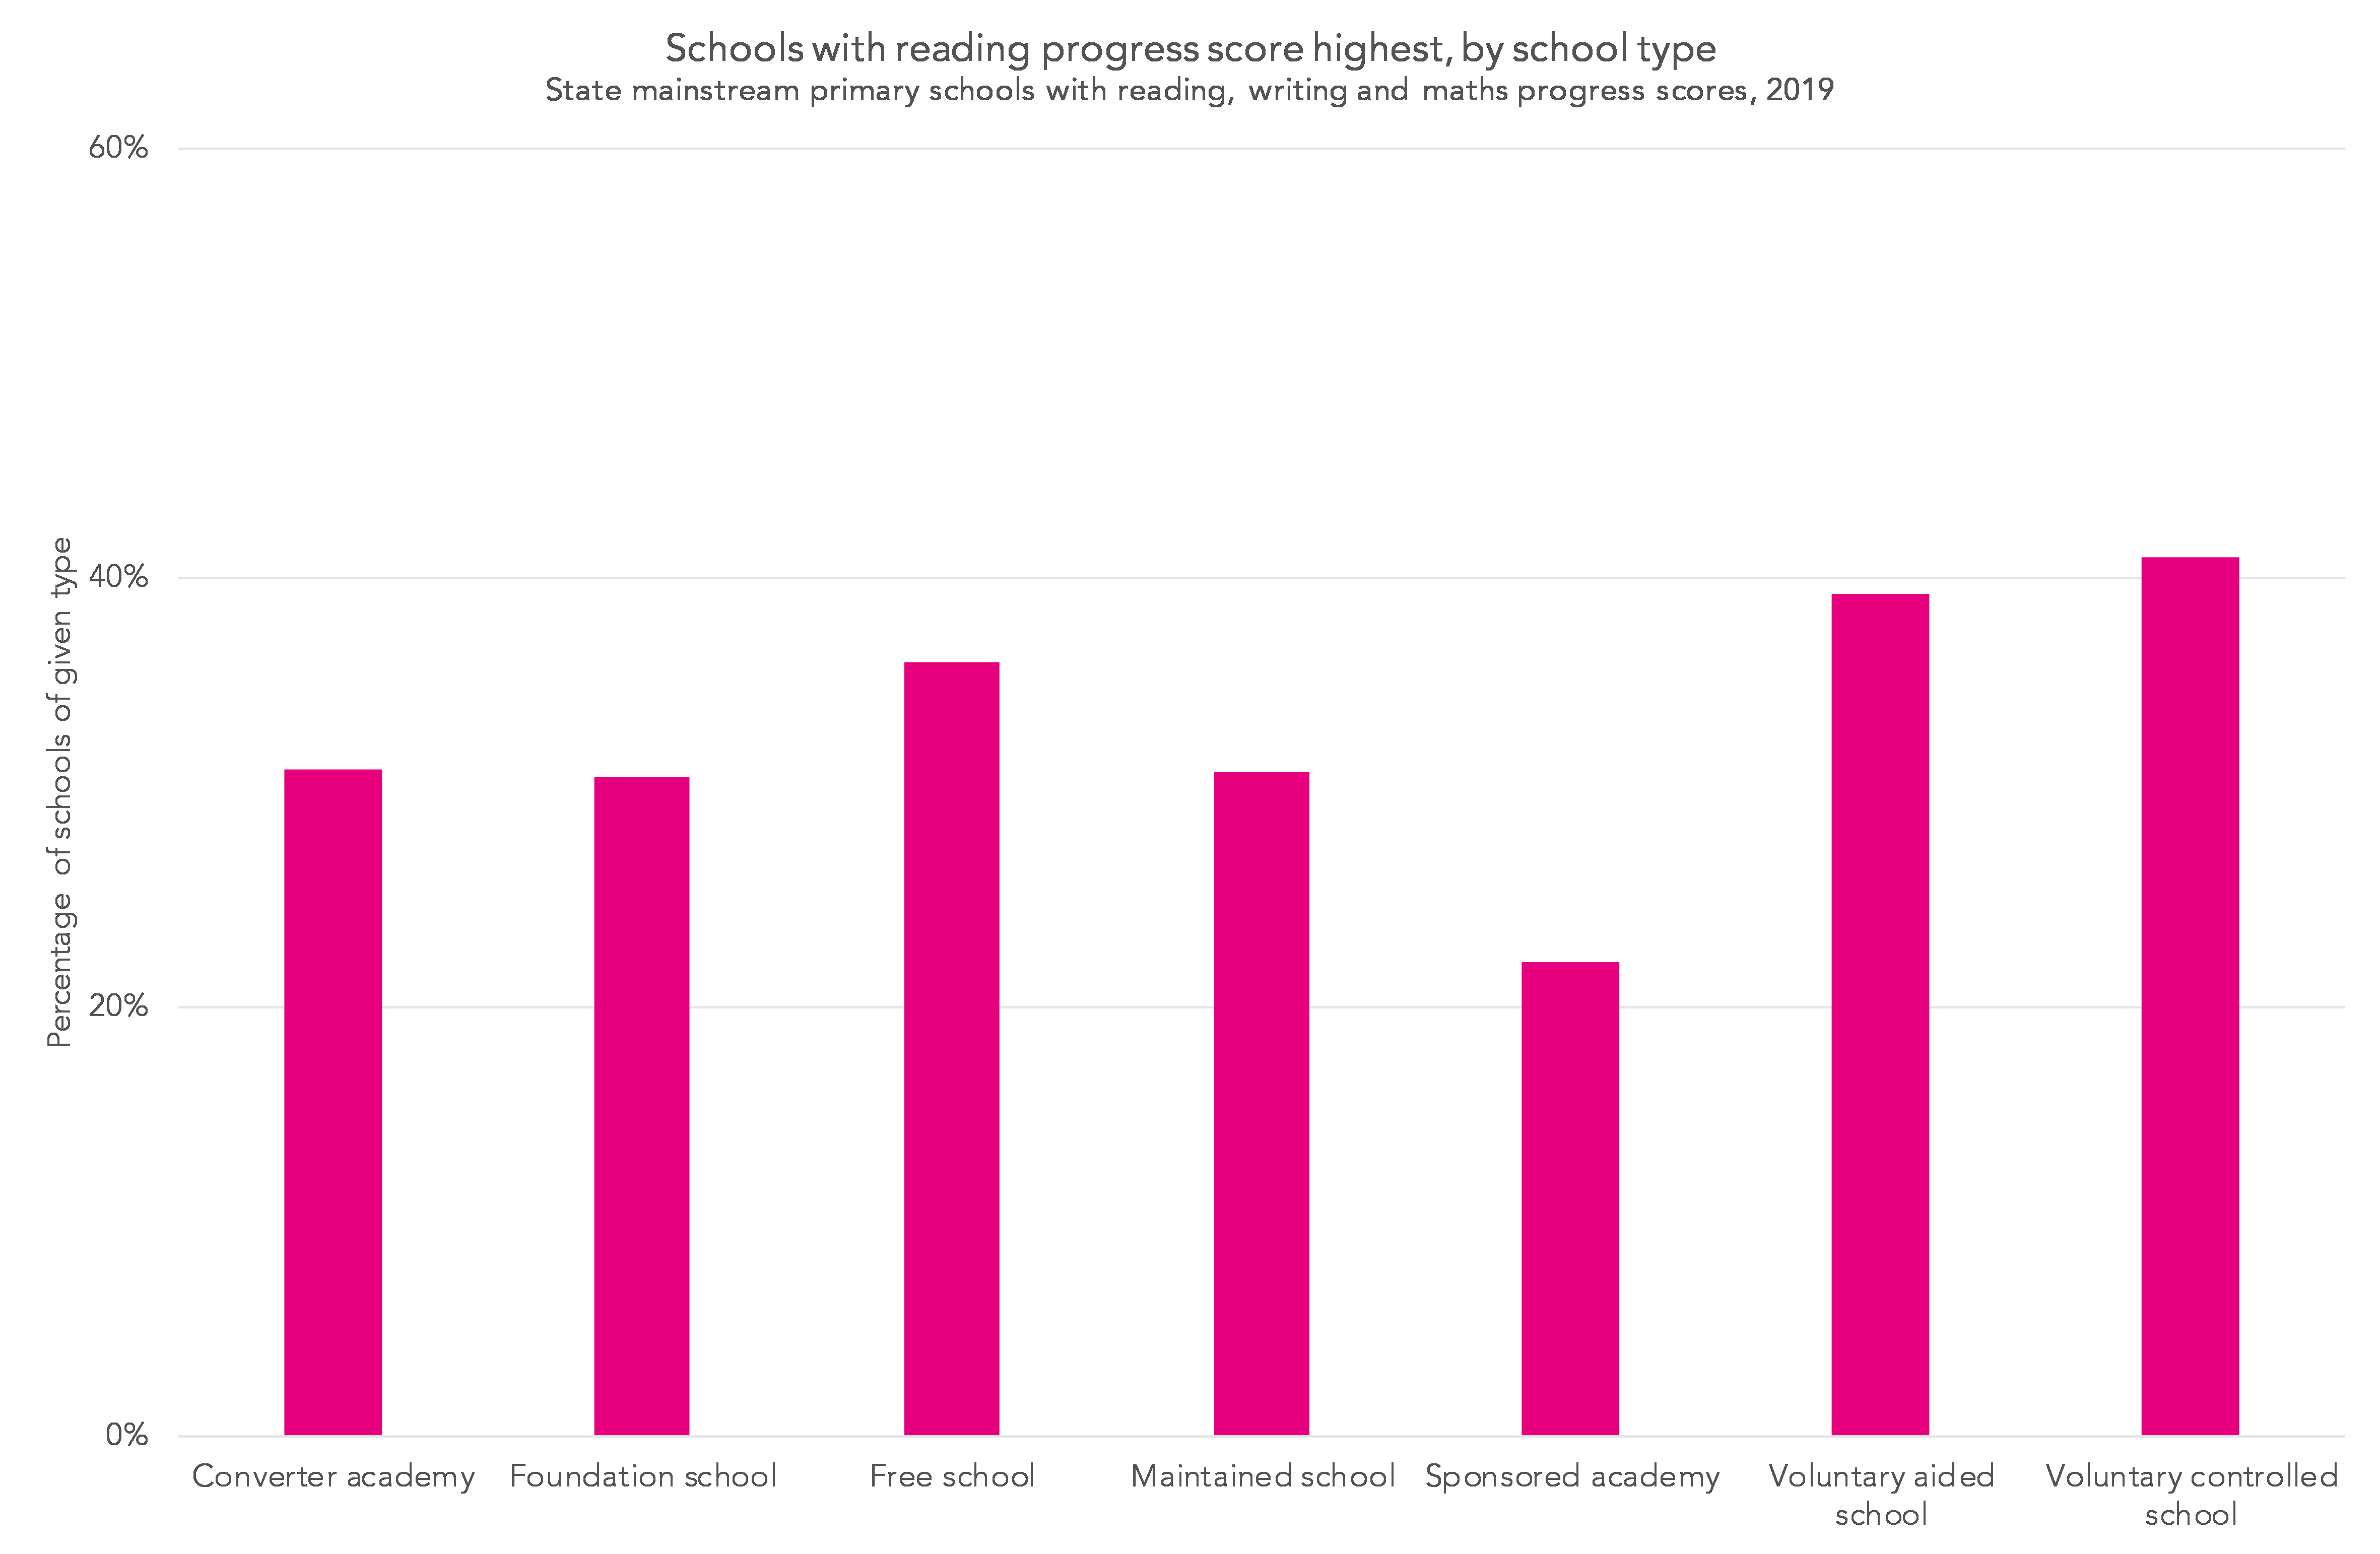
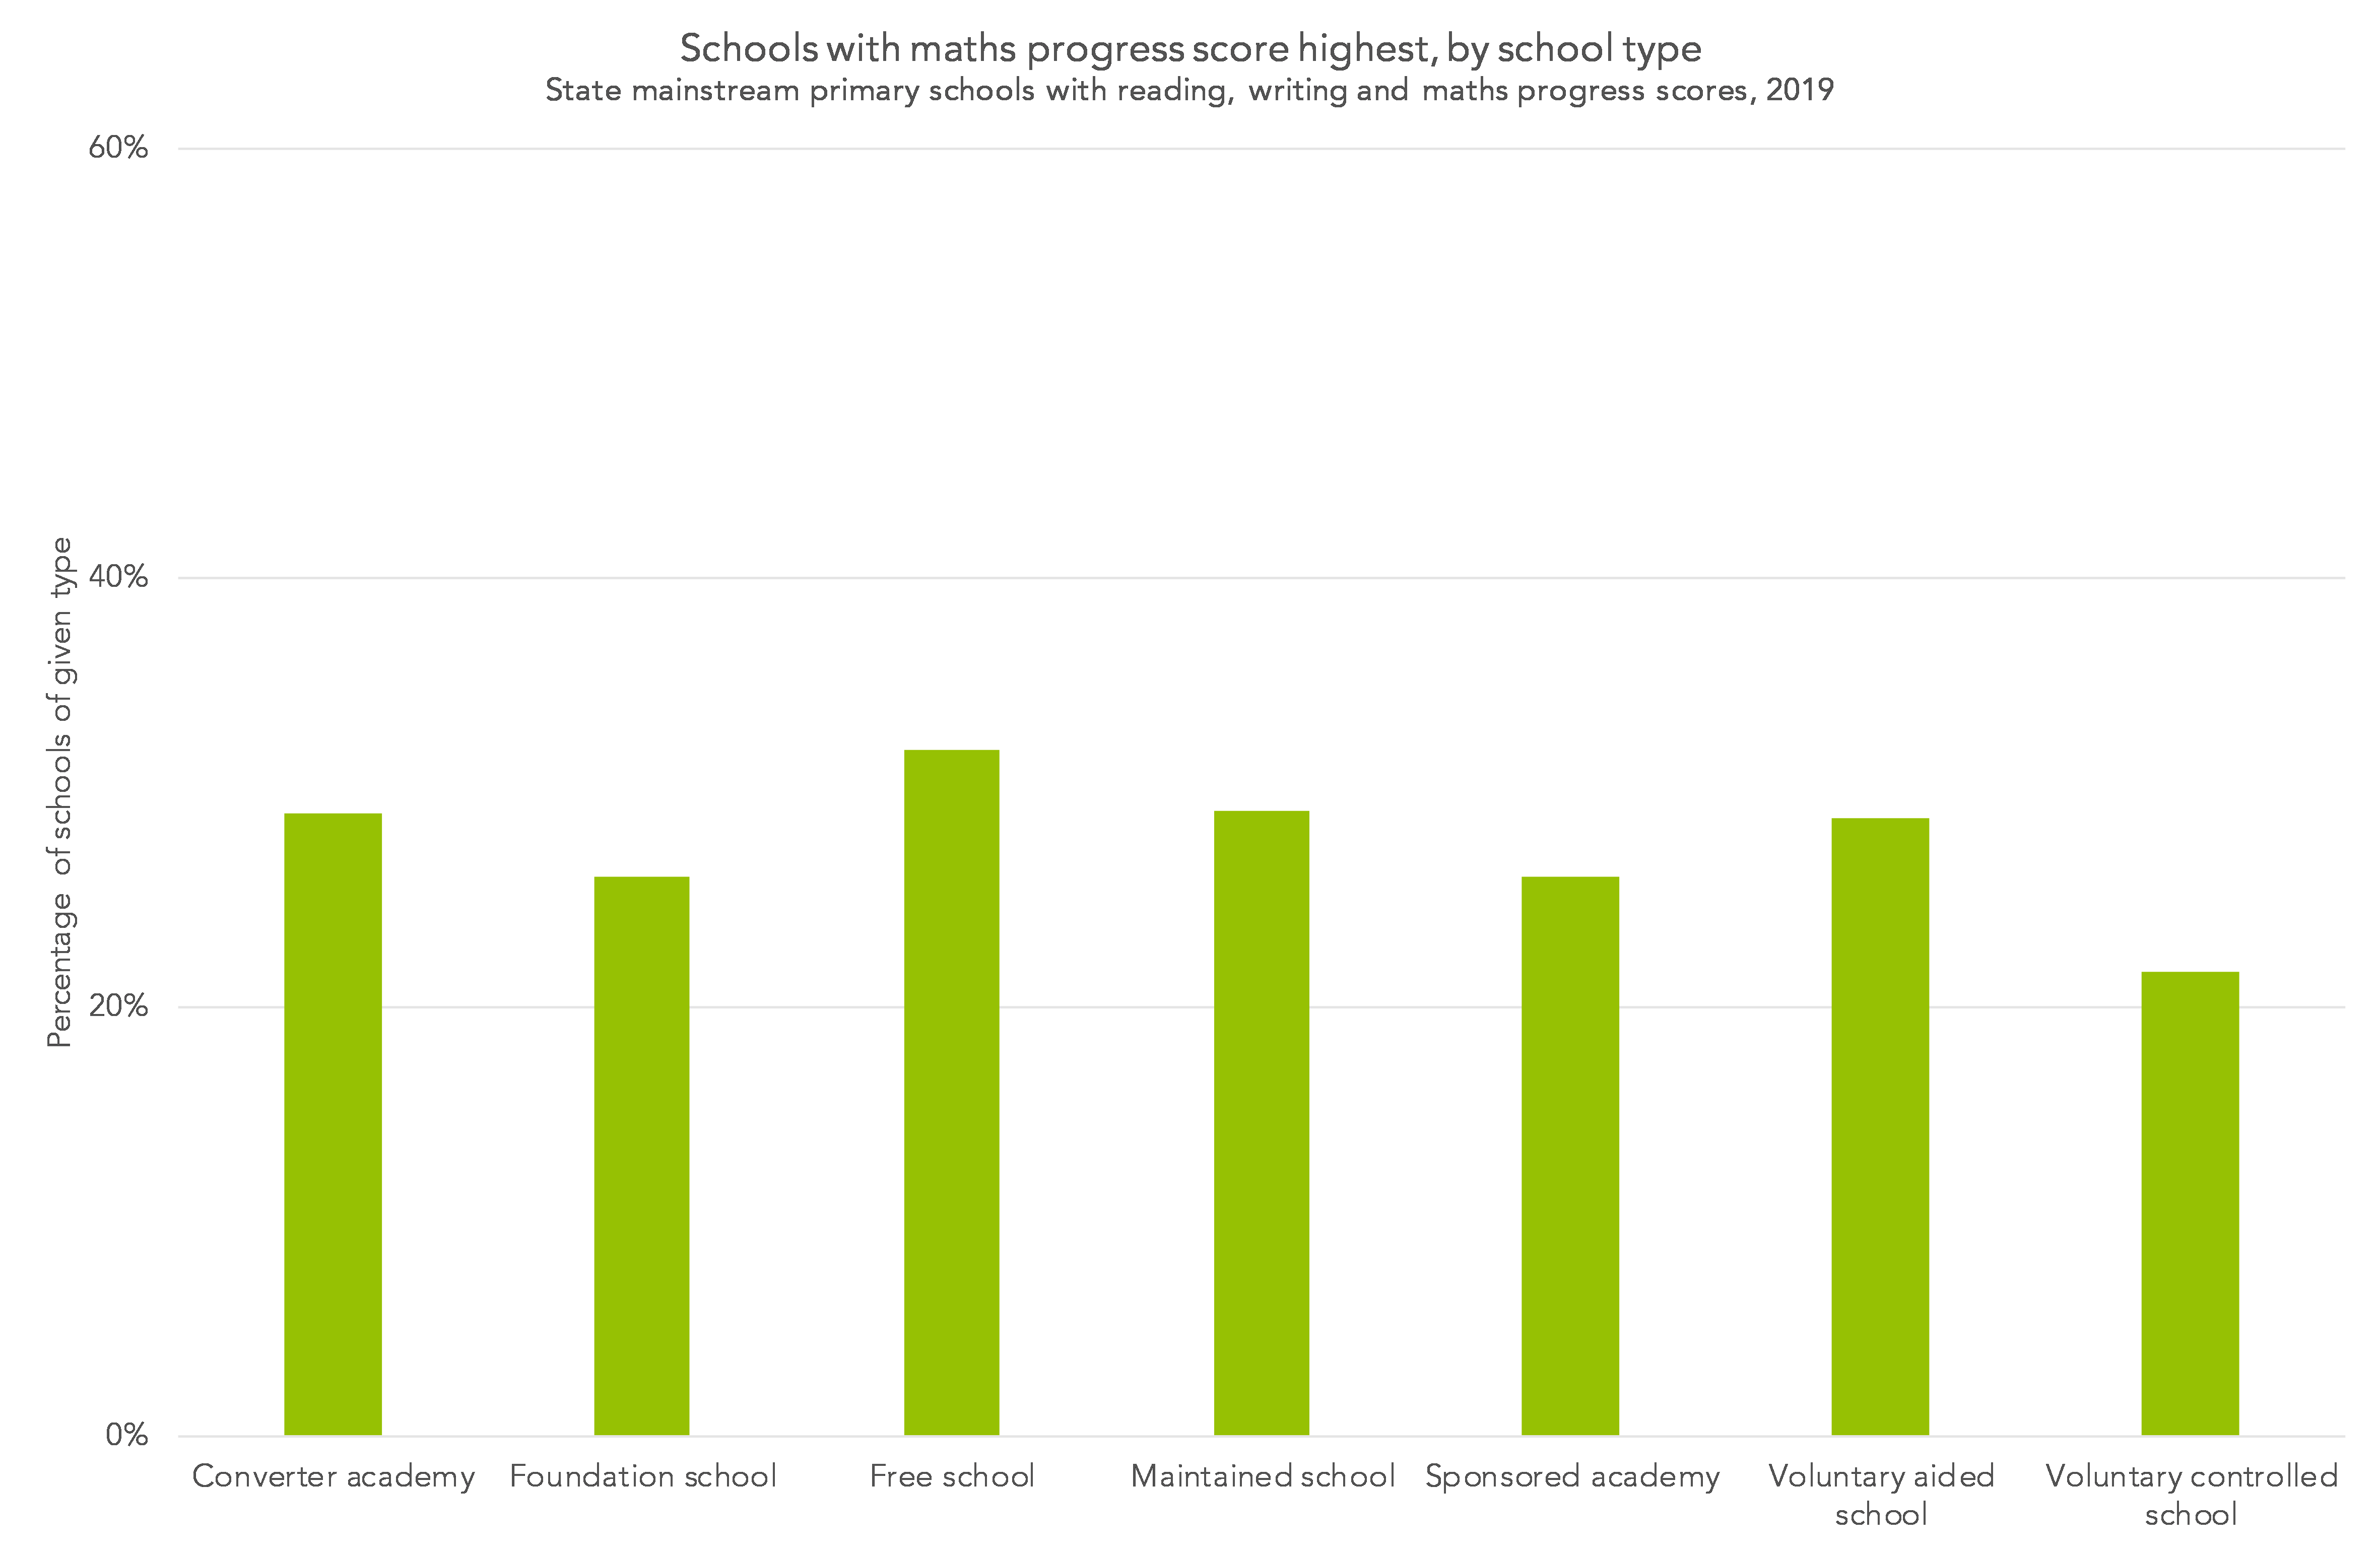
For comparison’s sake, here are charts which show the percentage of times when each type of school has its highest progress score in reading, and in maths.
Given writing is evaluated by way of teacher assessment rather than test, this does spark some concerns for us. From this data, there’s no way of saying whether sponsored academies are putting particular effort into boosting children’s writing, or whether in some cases performance in writing is inflated. It warrants some attention from moderators and from the DfE.
Want to stay up-to-date with the latest research from FFT Education Datalab? Sign up to Datalab’s mailing list to get notifications about new blogposts, or to receive the team’s half-termly newsletter.
1. This section was added to the original post at 13:30 on 13 December.

The common disparity between reading test results and writing assessments in schools with high disadvantage rates has been going on for a long time, but there is a possible counter-narrative … which is that in a lot of those schools children can underachieve in tests because they lack resilience and coping strategies, and so if they’re not having a good day on the day of the test then their test scores will suffer … whereas teacher assessment isn’t so reliant on a high-pressure one-off test and allows those children a better opportunity to demonstrate what they are really capable of.
I’m not saying that’s always the case and that when you see a school where the writing results outstrip reading and maths by a mile you shouldn’t at least be concerned about it, but it’s something to consider at least!
Thanks for the comment, Stephen – important point.