
In 2020, Weather Dependent Renewables (Wind and Solar Power) made up 58% of all power generation installations in the three Nations, DE UK FR. Together they contributed about 24% of the power generated at a productivity / capacity percentage of 19.7%.

These three major Nations: Germany, the United Kingdom and France, (DE UK FR), account for more than half of the Weather Dependent Renewable, energy generation installations across Europe. These Nations cover an area of about 1.1 million square kilometres about a quarter of the land area of the EU(27). It extends from 43°N to 58°N and 6°W to 13°E. The three Nations are predominantly in Northern Europe.
A data set accounting for their hourly and daily power output from 1/12/2019 to 31/11/2020 is used to examine the comparative performance of power generation in these three Nations. The overall comparison between the combined generating installations and the power output they achieve is shown below.
Notable points from these graphics:
- the Weather Dependent Renewable installations in 2020 amounted to some 60% of all generation capacity across DE UK FR, and nominally they contribute ~24% of the DE UK FR power.
- 17% of the installed DE UK FR generation technologies still produce substantial CO2 emissions from Coal, Lignite, Biomass and Natural Gas and these CO2 emitting generation technologies remain responsible for ~33% of the DE UK FR power output.
- the use of this combination of CO2 emitting technologies produce more than ~2.5 times the CO2 emissions that would have been emitted by simply burning Natural Gas alone for the same power output.
- Nuclear energy across DE UK FR still produces 35% of the power, even though the 8GW of that Nuclear power is scheduled for its final closure in Germany early this decade.
- France is the predominant Nuclear power exporting ~6GW of its excess power to other European nations. Those recipient Nations are wholly dependent on these power inputs to maintain their grid supplies. Nonetheless, apparently France is intending to cut back on its Nuclear generation and substitute it with Weather Dependent Renewables.
Contrasting the power production in the three Nations: DE UK FR
The graphics below indicates the extent of installed generation technologies and their level of productive output:


Notable points from these charts:
Germany ____________________

In 2020, Weather Dependent Renewables (Wind and Solar Power) made up 69.8% of all power generation installations in Germany.

- Germany as a result of its “die Energiewende policy” its Weather Dependent Renewable installations have now reached ~70% of its whole installed generation capacity but those Weather Dependent Renewables only contribute ~33% of its power annually:
- Onshore Wind power productivity/capacity average since 2008 18.9%
- Offshore Wind power productivity/capacity average since 2008 33.6%
- Solar Photovoltaic productivity/capacity average since 2008 10.3%
- Combined Weather Dependent Renewable productivity/capacity average since 2008 15.3%.
- Germany’s power generation is supported by ~20% of CO2 emitting generation from its installations using Hard Coal, Lignite, Biomass and Natural Gas, but these technologies are responsible for 45% of the power produced.
- The CO2 emissions from this combination of fuels could have been reduced to more than one third if Natural Gas had been exclusively instead.
- Germany still has a substantial fleet of Nuclear power stations, but as a result of a political decision, after the 2011 Fukushima nuclear accident, Nuclear generation in Germany is scheduled to close completely within a very few years.
- Germany has been increasing it Coal and Lignite generation in anticipation of the closure of these non CO2 emitting Nuclear facilities. It has reopened some closed Coal-fired plants, realising that closure of these base load power producers would further increase the fragility of its power grid.
- 5% of Germany’s power is produced by Hydro power with limited pumped storage
- in spite of its “die Energiewende policy” Germany still has the highest CO2 emissions/head in Europe at ~8.38 tonnes/head.
- Germany depends on transfers from France and other European countries for ~4% of its power. On occasions Germany’s Renewables over produce in comparison to its demand and this excess power has to be shed or sold at negative prices overseas.
- Germany, alongside Denmark, (also heavily committed to Wind Power), now has the highest electricity prices in the developed world.

UK ____________________

In 2020, Weather Dependent Renewables (Wind and Solar Power) made up 58% of all power generation installations in the UK.

- the UK Weather Dependent Renewable installations now amount to ~58% of its total installed generation capacity but only produce 26% of its power:
- Onshore Wind power productivity/capacity average since 2008 25.6%
- Offshore Wind power productivity/capacity average since 2008 32.2%
- Solar Photovoltaic productivity/capacity average since 2008 9.6%
- Combined Weather Dependent Renewable productivity/capacity average since 2008 21.9%.
- The UK has made a large commitment to Offshore Wind power and is meeting significant local resistance to further Onshore Wind installations.
- the UK power generation is supported by ~46% of CO2 emitting generation from Natural Gas and Biomass: the UK CO2 emissions from Biomass, mainly from the Drax power installations , (burning mainly wood chips imported from America), these CO2 emissions effectively cancel out any CO2 savings from the use of all other Weather Dependent Renewables.
- the UK still has an ageing fleet of Nuclear power stations most of which will be closed this decade. Some replacements are in train with Hinkley point due to open in 2023: there is still no UK wide commitment to the installation of local Small Modular Reactors, which could be manufactured in the UK.
- because of geographic limitations in the UK, only ~5% of UK power is produced by Hydro generation, there is some limited pumped storage.
- as a result of the earlier UK dash for Gas policy the UK has reduced its CO2 emissions / head since the 1990s to below the European average at 5.46 tonnes/head in 2019.
- the UK depends on other European countries, mainly France, for ~8% of its power.
- the UK has a virtually nil operating margin for overall power generation.
- The UK dependence on power imports should be regarded as an existential National emergency.

France ____________________

In 2020, Weather Dependent Renewables (Wind and Solar Power) made up 31.7% of all power generation installations in France. Together they contributed about 9.6% of the power generated at a productivity / capacity percentage of 18.3%.

- the French Weather Dependent Renewable installations now amount to 37% of its installed generation capacity, but they only contribute ~11% of its power:
- Onshore Wind power productivity/capacity since 2008 21.5%
- Solar Photovoltaic productivity/capacity since 2008 12.2%
- Combined Weather Dependent Renewable productivity / capacity since 2008 18.2%
- France has not installed any Offshore Wind generation.
- French power generation has limited CO2 emitting generation from Biomass and Natural Gas producing only about 6% of its power output.
- France still has a massive, but now ageing fleet of Nuclear power stations, these were progressively installed as a reaction to the oil price shock of the 1970s.
- there is still no major commitment for their replacement, but current policy seems to be to reduce the successful French Nuclear fleet from the current 75%+ down to ~50% of French power generation.
- this fleet reduction would of course limit the present French ability to supply its excess power overseas, particularly to the UK and Germany.
- the UK depends on France and other European countries for ~8% of its power
- the UK has a virtually nil operating margin for power generation overall this import dependence should be regarded as an existential National emergency, especially since Brexit.
- in addition, ~14% of French power is from Hydro generation with some limited pumped storage.
- as a result of the earlier long-term French Nuclear policy, since the oil price shock of the 1970s, France has reduced its CO2 emissions / head to below the Global average at 4.26 tonnes/head: France thus has the lowest emissions / head of any developed Nation.
- France now has the lowest electricity prices in Europe.

DE UK FR Weather Dependent Renewables Progress and Productivity / Capacity
The installation and power output progress from 2008 onwards of DE UK FR Weather Dependent Renewables is shown below:

The consequent history of DE UK FR Weather Dependent productivity / capacity is shown below: essentially there has been only marginal productivity advance since 2008 and overall it remains in the region of 20%, (1 day in 5 overall).

The measured annual Weather Dependent Renewable productivity / capacity percentages for the major European proponents of are shown below:

In other words Weather Dependent Renewables produce roughly one fifth of their Name plate rating in the course of any year and this level of productivity / capacity has improved very little since 2008.
The consistently poor performance is in Italy where there is a preponderance of Solar PV installations. Spain, (where they had previously fraudulently generated Solar power at night), had a largely Onshore wind power fleet, but Spain has recently added a further major Solar Power commitment, and accordingly the Spanish previously high productivity has fallen abruptly. UK productivity is sustained by its large proportion of Offshore Wind power. The high proportion of Solar Power in Germany has maintained their poor productivity: Germany and the UK are the darkest and cloudiest nations in Europe.
This post is a 2020 update of information provided in the 2019 post referenced below.
DE UK FR Weather Dependent Renewable performance

The above diagram shows the gross variability on a daily basis of the output from Weather Dependent Renewables across the DE UK FR Nations. It amply shows:
- the variability of combined Wind output affected by changing weather patterns over the year ranging from ~5% of daily generation to more than 30%.
- even though the territories are geographical disparate there is daily coordination throughout the year between Onshore and Offshore Wind generation.
- there is minimal Solar PV production in the winter months October – March.
- even so in the more productive summer months there can still be substantial performance variability of Solar PV power from one day to the next.
- there is some useful coordination between Wind power with lower productivity in the summer months and the higher Solar PV productivity in the summer. This of course ignores that fact that Solar PV productivity falls off rapidly in the evenings at times of higher demand.
However it is only when the performance of Weather Dependent Renewables is assessed on an hourly basis or even at a finer grain that the true extent of their Intermittency and variability becomes clear.
Combined Hourly Power Performance Germany, the UK and France
The wide range of Weather Dependent Power output is clear below. In addition the precipitous nature of the power output changes is also obvious. Generally there is consistent coordination between Onshore and Offshore Wind output. The rapid rate of change of power output creates massive control problems for those responsible for the maintenance of the essential consistent quality of the electrical grid. Europe-wide wind droughts can be seen to have occurred at various extents throughout the year.

The combination of the Wind power output across the three Nations DE UK FR might be thought to smooth out the variability of Weather Dependent Renewables, however the data from some selected months in 2020 shows that the assertion that “the wind is always blowing somewhere”, is a fallacy. A static low wind high pressure area may well encompass the UK and the near continent for extended periods at any season.
The following plots for the selected months of January, April, July and October show Weather Dependent Renewables production as a percentage of total power output for those months. They usefully detail the intermittency and variability inherent in Weather Dependency.
January 2020 _____________
In that peak demand winter month there was poor Wind Power performance particularly from 20-25 January. Solar PV power added vey little and very intermittent power, with poor Solar provision in the evenings, the time of peak demand

April 2020 _____________
Solar PV contribution is ramping up early in the month but their were notable setbacks of Wind power 7-12 April and 23 -28 April.

July 2020 _____________
Solar PV contribution was significant if intermittent, at its peak hours providing more than 30% of all power generated. But still falling off to nil at peak load times in the evenings.

In July 2020 there was a long period with a significant loss of Wind Power from 7-24 July. For 16 days in July 2020 installed Wind power accounting for 40% of the DE UK FR generation fleet, Wind power output output fell to below 10% of total power generated across the region.
October 2020 _____________
The diminution of Solar PV power can be seen as the Autumn advances. Wind power is more productive but even so there were two shorter occasions of 2 days each when its output fell to less than 10% of total DE UK FR generation

Weather Dependence leads to Intermittency and Variability
Wind power
In the event of significant high wind, Wind power has to be curtailed to protect the equipment from damage. The extent of the very significant Wind drought across all the DE UK FR territories in July 2020 is shown in the hourly data plotted below:

Wind power output is often limited by low wind speeds as well. Using power output from Wind generators as a proxy for wind speed and thus the likely curtailment of Renewable Energy output the following graphic shows the occasions of likely overspeed curtailment and periods of low productivity due to low wind speeds on an hourly basis.
Although storage solutions, such as batteries, might be able to combat such intermittency, it should be noted that the apparently massive battery storage capacity installed in South Australia at a cost of ~US$130 million can sustain the South Australian grid for its population of 1.7 million for about 10 minutes. So, battery storage, at a scale necessary to support the power user of DE UK FR at whatever cost, could not compensate for a Wind drought of some 10 days as occurred in July 2020.

Solar performance
A direct Solar PV comparison for a few winter days showing the an equivalent summer six day output shows that in Winter Solar PV energy provides about 1/6 of the output as in summer and the extent of the dark periods in the Northern winter. It also is crucial to note that even in summer fall off of Solar power is significant even in the evenings and that nil production occurs at all at night. In addition the significant overproduction can occur around midday in Summer and that overproduction will be curtailed or sold to neighbouring countries at a negative price and thus wasted when it exceeds the power demand.

Its seems that the proponents and the government mandators of subsidies for Renewable Energy, particularly Solar PV power in Europe choose to ignore:
- the annual productivity / capacity percentage of Solar PV in Europe persistently remains at only about 10%.
- the “duck curve” of Solar PV production means that Solar PV production normally falls off in the evening, just at the time of likely peak demand
- Solar PV energy production diminishes at least 6 fold from Summer to Winter. Winter is the period of higher demand
- Northern Europe, particularly the UK and Germany are cloudy regions. Other locations such as California may achieve higher Solar productivity by as much as a further 50% to achieve up to 15% annual productivity / capacity percentage.
Conclusions
An excellent way to undermine Western economies is to render their power generation unreliable and expensive. That objective of Green thinking is progressively being achieved by government policies throughout the Western world, but without popular mandate.
- Weather Dependent Renewables now represent ~60% of power generation fleet of the three Nations, but with 70% in Germany and much less in France
- These DE UK FR Weather Dependent Renewables provide an overall productivity / capacity percentage of less than 20%.
- with such high levels of Weather Dependent Renewables and with the progressive elimination of base load power generators both the UK and Germany are standing into danger because their power grids are becoming increasingly fragile for lack of base load power.
If the objectives of using Weather Dependent Renewables were not confused with possibly “saving the planet” from the output of the UK’s and Europe’s relatively minor and diminishing proportion of CO2 emissions, (for electricity generation, less than 25% of 1.1%, the UK 2019 portion of Man-made Global CO2 emissions), their actual cost, in-effectiveness and their inherent unreliability, Weather Dependent Renewables would have always been ruled them out of any engineering consideration as means of National scale electricity generation.
The annual UK CO2 emissions output is well surpassed just by the annual growth of CO2 emissions in China and the Developing world. It is essential to ask the question what is the actual value of these Western government mandated excess expenditures to the improvement of the environment and for the possibility of perhaps preventing virtually undetectable temperature increases by the end of the century, especially in a context where the Developing world will be increasing its CO2 emissions to attain it’s further enhancement of living standards over the coming decades.
Reducing CO2 emissions in just the Western world as a means to control a “warming” climate seems even less relevant when the long-term global temperature trend has been downwards for last 3 millennia, the world is entering a Grand Solar Minimum, which is likely to last for several decades and as the coming end of our current warm and benign Holocene interglacial epoch approaches.
The context in 2020-2021
In spite of all the noisy Climate Propaganda of the past 30 years, in Spring 2020 the world faced a different but very real economic emergency from the reactions to the COVID-19 virus pandemic.
That Emergency, with the world facing the loss of many citizens as well as global economic breakdown, should put the futile, self-harming and costly Government mandated attempts to control future climate into stark perspective. This real Emergency clearly shows how irrelevant concerns over probably inconsequential “Climate Change” in a distant future truly are.
Data sources
This post gratefully uses the following data sources:
- German Renewables and generation data provided at hourly intervals
- United Kingdom Renewables and generation data at 5 minute intervals, condensed to hourly intervals
- France Renewables and generation data at 15 minute intervals, condensed to hourly intervals
- For the progress and scale of EU(28) installations by the end of 2019, EurObserver’ER publish their Renewable Energy “Barometers” for each type of Renewable generation annually, as yet unavailable for 2020, for an example see:
EurObservER-Wind-Energy-Barometer-2020.pdf
Meanwhile in China, countries receiving foreign aid and/or belt and road agreement finance and construction from Chinese sources and other UN designated “developing nations” new coal fired power stations are being commissioned every year and many more planned for construction for years to come.
Each potentially operational for 50 years and with preventative maintenance many more years, 80 at least.
Emissions increasing, developed nations emissions reduction schemes pointless, expensive and economic vandalism.
So who benefits, “build back better” agenda manipulators of course.
Take a knee for-profit.
Without profit, little worthwhile gets done.
When people invest their money, why shouldn’t they get a return on that investment?
I notice that a lot of the doom and gloom climate change research papers are written by Chinese authors whose research is sponsored by the PRC. Strange the the PRC never has climate change protests despite its extensive use of fossil fuels. Has Greta ever pointed this out?
““So who benefits, “build back better” agenda manipulators of course.”
Meanwhile China is building coal plants in the third world countries and making them indentured servants.
Griff will be along soon to state this is all rubbish and fake. For me it made interesting reading especially the data that shows massive installed capacity of “unreliables” constantly underperforms being propped up by conventional generation sources.
And often also propped with government-taxpayer subsidies and other protection from financial failure due to real output average: Capacity Factor
I know where you’re coming from, Dennis, but please, guvments have NO money, IT’S ALL TAXPAYERS’ money!!!!
And taken at source too. Every year I get a statement from the ATO here in Australia that shows me where all my taxes were spent. Makes for depressing reading.
I’ve fixed that for myself but not paying taxes any longer, except for fuel excise and GST. Tax-free superannuation is wonderful!
If you work, you pay tax. Tax-free super? Sounds like you are very wealthy and have a good tax agent. Or you just fake it.
Why would I need to fake it? Superannuation is tax-free after retirement in Australia.
The nameplate capacity and the capacity factor are both meaningless unless it’s dispatchable or there is 100% battery backup.
Undoubtedly, much of the energy that is produced, is produced at a time when it isn’t needed and they have to pay someone to take it.
During 2020, wind and solar produced 20 % of the electricity in Sweden but only 4 % was needed, the rest was exported at a price lower than the production price and in many cases at negative prices (so we had to pay to get rid of the surplus electricity). The overproduction of wind electricity destablises the grid increasing the risk for grid collapse which would mean that the entire country will be without electricity for some time. During cold winters (high pressure) there is hardly any wind, less than 5 % of installed capacity. So bottom line is that wind and solar is very expensive and increases the risk for grid collapse.
There definitely will be a “climate emergency” if England and Germany continue with their demented Dance of Doom; lots of Germans and Brits will have to decide between eating and heating as prices soar and reliability drops! Trying to emulate Commifornia’s energy grid and generation fleet is as crazy as copying the public decency standards of the once great City by the Bay!
Without a return to sanity in climate policy and energy production, the Western democracies are going to become 2nd or even 3rd World nations!
Tsk Tsk; England and Gt. Britain are not the same thing.
And, indeed, Britain and the United Kingdom are not the same thing. 😉
Being born in the UK, on government forms I love using all three of the terms UK, England and British where possible.
The energy emergency will be solved
Like the Irish potato famine they will starve
Climate agenda unchanged – just a few million dead brits and germans
The Chinese Communist Party and the Russians need the West to divest from nuclear power so they can consume the uranium reserves.
China is also heading towards mining Helium-3 on the Moon, “the perfect fuel” they call it.
They are going to mine a fuel for a fusion reactor that for the last 60 years has been forecast to arrive in the next 20 years?
A perfect fuel for a perfect fool – until there is a practical fusion reactor that can use it.
unfortunately probably has a negative energy if you count all the fuel to get to the moon
The Russians are making pretty good money supplying the U.S. and others with reactor fuel. See John Solomon’s book “Fallout”.
The Clinton-Obama Criminal Enterprise made a lot of money on these deals, too.
Our adversaries, like the leaders of Russia and China, must be amazed at how easy it is to corrupt and undermine Americans and the American government. Like a walk in the park.
Obama and Clinton gave away the U.S. store for personal gain. Our adversaries didn’t have to coerce them into doing this, they volunteered.
And now with Biden, we have another interation of the Obama-Clinton Criminal Enterprise/Deep State. The People of the United States are being sold down the river by these radical, greedy, authoritarian Democrats.
Renewable energy wind and solar not good enough for China …
https://wattsupwiththat.com/2021/05/03/china-renewable-energy-intermittent-and-unstable-we-must-rely-on-a-stable-power-source/
Not just weather, but environment. Clear the trees that block the wind. Remove the canopies that block the sun. Displace the herds that graze. This is the Green, not green solution.
Cows can graze underneath wind trubines: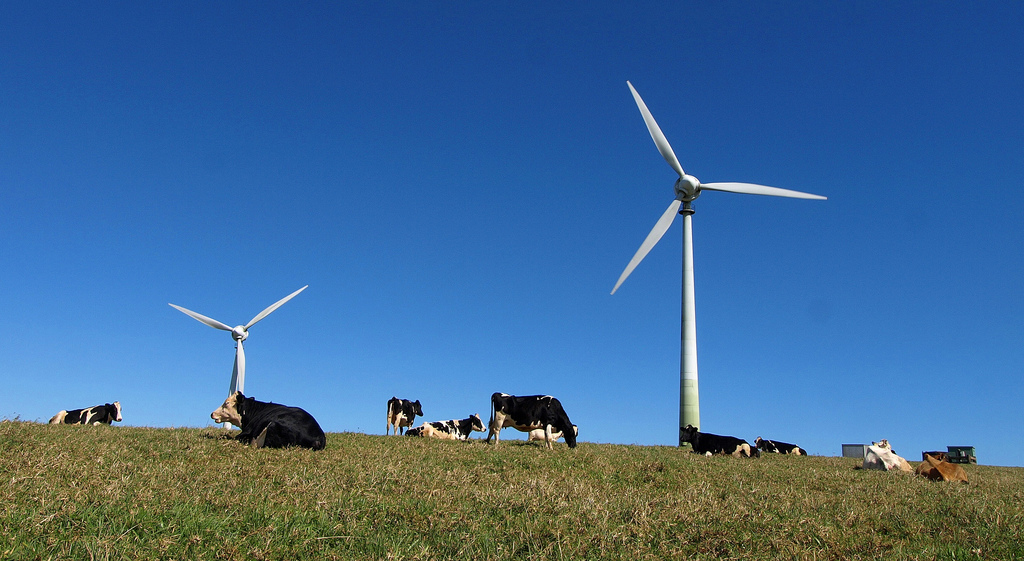
Cows are unlikely to fly into the blades, unlike bats, birds, and insects.
Fish can not swim into the blades of off shore turbines
Birds can, and ships can hit the pylons.
But fish are disturbed by the vibrations and sounds transmitted by the turbine supports.
Potential better batteries of the future won’t save renewables – they will doom renewable energy. Cheap, durable and high-capacity batteries would mean the ability to import energy across the oceans on battery ships from places with cheap energy to places with expansive energy. Cheap energy from imports will make EU renewables uncompetitive. Good batteries also mean no need to get energy from the grid, and grid is a place upon which renewables are forced. Good batteries would allow to produce electricity on the seas (including international waters), put it on battery ships and transport to the EU – which has long sea shore and lots of ports.
Batteries will never hold enough energy to economically do that. Much better to ship the energy in its best form. We currently move energy by ship in the form of LNG, petroleum, coal, and uranium. Ignore the idiots sending wood pellets across the ocean – this is a fundamentally flawed idea.
You should have added a sarc tag.
Despite all this there are claims that appear with monotonous regularity about 100% renewable generation. And despite the fact that renewables cannot support frequency and keep the load and supply in balance.
“Data sourcesThis post gratefully uses the following data sources:
https://www.gridwatch.templar.co.uk “
The UK comprises England, Scotland, Wales and Northern Ireland.
Gridwatch sources it’s data from Elexon BMRS
Elexon data is for Great Britain (England, Scotland and Wales) and does not include data for Northern Ireland.
https://www.bmreports.com/bmrs/?q=help/about-us
The UK imports about 8% of its electricity, but it does not depend upon it.
There is a difference, although one that has escaped the crumbling EU leadership…
But leaving the UK energy supply vulnerable to external threats is a ridiculous risk to take.
Somebody needs to tell Boris that his ever-more-fanatical embrace of “renewables” while promoting heat pumps & EVs and banning gas central heating and ICE vehicles is madness writ large!
A maze of brightly coloured charts, then a conclusion decided on before the article was written…
I point out once again that the weather is sufficiently predictable to allow deployment of fossil fuel (gas), stored energy or demand management where required…
That this also sets a price in advance allowing import of power across Europe…
That the grid collapse Watts has been predicting for over a dozen years now hasn’t happened…
In short, renewables are still expanding and working just fine.
Griff, you’re sounding more and more like Comical Ali.
Delusional as always I see, Griffendope.
So what anyway griff? Why don’t you explain to us how the destruction of the planet’s environment with these other-agenda climate-criminal bullshit “projects” is going to have any effect on the Keeling curve. What have these theft-machines done in the past for reducing carbon dioxide in the atmosphere? What are they doing in the present? What will they do in the future?
Since you have demonstrated your inability to do maths already, and I don’t want you to get a paper cut from using complex mathematical equipment like a pencil and a piece of paper, let me do it for you. It’s quite easy actually, in round numbers:
1) The past: Indistinguishable from zero
2) The present: Indistinguishable from zero
3) The future: Indistinguishable from zero
Wake up you idiot and stop spouting shite. You only get one life. Do you want your legacy to be one of aiding and abetting the suppression of the development of poor people’s prosperity, health and welfare and, in some cases involuntary manslaughter, YES YOU, and anyone else in your sorry situation. Stop being fcukwit puppets.
Fine, and wenn the prediction is “no wind” ?
Blowing with thick jowls ? 😀
And when sun is out, candellight dinner on a solar modul ?
😀
Like most leftists, griff believes that he has the right to redefine the meaning of words whenever he feels the need. And he doesn’t have to tell you which definition he’s using.
Griffionary 😀 of energy generation 😀
It didn’t escape our attention that you couldn’t challenge a single one of the conclusions. You can see the data supports each and every conclusion, yet you continue with your (feckless) support of unreliable energy generation. You are not a honest person, griff.
griff keeps repeating this lie that weather is predictable. It’s almost as if he actually believes it himself.
To be useable, those weather predictions have to be able to tell you where every cloud will every second, 24 hours in advance.
To be useable, those weather predictions have to be able to tell year what the wind speed will be for each turbine, within a few miles per hour, for every second, 24 hours in advance.
As for grid collapse, griff seems to think that unless the entire grid collapses and doesn’t come back, it doesn’t count as grid collapse.
As for grid instability, that’s been increasing as has been shown here many times. The fact that instability, this time, didn’t go all the way to full collapse is not proof that it will never advance to that point. No matter how may times griff claims that it is.
You say that power plant capacities will be melted down. But there should then be a balance, so that the power supply is not in danger.
Henrik Paulitz:
Yes, you would think so. The nuclear phase-out alone would not have been the problem. This was always secured because coal, hydro, oil, biomass and gas-fired power plants always ensured the power supply when needed.
In the meantime, we are in acute danger: The long-term electricity storage facilities that have been promised for decades do not exist, partly because of the large efficiency losses, i.e. for technical and economic reasons. Short-term storage systems such as batteries are, on balance, not suitable for solving the problem. Solar and wind power therefore require an absolutely reliable conventional backup power plant park. But this will be lost in the coming months and years with the nuclear and coal phase-out.
What orders of magnitude are we actually talking about?
Henrik Paulitz:
Today, Germany needs more than 80 gigawatts of absolutely reliable power generation installations. However, wind and solar often supply less than 10 gigawatts, occasionally even only around 1 gigawatt.
Even if wind and solar capacities were assumed to triple, the problem would remain.
Henrik Paulitz: Even then, a demand of 80 gigawatts would at times be offset by less than 5 gigawatts of secured wind and solar capacity. And it gets even worse.
Because of electric cars?
Henrik Paulitz:
Yes, because millions of electric cars are expected to draw further electricity. In addition, oil heating systems are to be replaced by electric heat pumps. This could increase the power demand to 120 gigawatts in the next ten years. Together with hydroelectric and biomass power plants, however, renewable energies would only have a total of 17 gigawatts of secured capacity.
The power supply is massively endangered
(German source)
Germany still the greatest supplier of CO² in the EU….. danke schön.
You are wellcome 😀
Griffiepoo: Take no notice of those nasty numbers. if you really, really, really believe hard enough in wind power, maybe it will magically become economically viable.
“the grid collapse Watts has been predicting for over a dozen years now hasn’t happened…”
Well they did a pretty good simulation of it in Texas this year, and had a wonderful incident a couple of years ago in the UK, which stopped all trains in their tracks for a few hours.
I guess reality doesn’t count in Griff’s world, but some people did die of cold.
Hat Tip: The Scottish Green Party is on the verge of backing the SNP in Government. That means the Green Party is on the verge of voting for another once in a lifetime referendum to Balkanise the UK (less than a decade after the last one).
Will be interesting to see how that affects the image of Green Parties around the world.
M Courtney
I think green party voters are immune to the consequences of their actions as otherwise they would not so enthusiastically endorse ruinously expensive and half baked green energy measures, much of which is built using child slave labour using scarce resources owned by the Chinese and processed in an environmentally damaging way. Everything they would stand against if it arose in a different context
They will still keep using their smartphones to download netflix or make pointless phone calls even though server use is one of the largest forms of energy consumption.
I don’t think that whatever the greens do or say will make a difference as they are in effect a new religion and their adherents are as bright eyed and evangelical as any medieval church goer.
If Ed’s article could somehow be put in front of Boris do you think he would understand it let alone upset Carrie by agreeing with it?
tonyb
Greens, like leftists in general believe that good intentions will always work out.
If you care enough, everything will work out in the end.
Greens believe in Unreliables for as long as it takes for them to be seriously inconvenienced by blackouts. Getting stuck in a dark lift for a few hours is particularly effective in changing their minds.
Voting history shows that the best thing that could happen for the conservatives of Great Britain’s other entities would be the separation of Scotland and the elimination of the subsidies to that new “independent” nation.
Much as the liberal Quebec sways the vote in Canada and California, Massachusetts, and New York in the US. If free minded peoples could cut the cancer of the liberal controlled areas from our countries, we could really have a high standard of living.
And as a preemptive statement: Liberals will say that the states and cities where liberals coalesce are the richest. This is true because the corporations with facilities in these locations are there because their elite owners/boards, etc. love the variety of social diversions available. But ask yourself if you own any stock in any corporation with major facilities in these high taxed locations, are these elites maximizing YOUR returns by spending big bucks for facilities and employee pay there, when they could have much lower expenses just about anywhere else? Of course the answer is NO.
So the next TRUMP! administration needs to use the newly appointed government lawyers to sue all major corporations for defrauding their shareholders by NOT maximizing returns by staying in these very expensive locations. Watch Silicon Valley, NY, Frisco, etc. be freed of these evil corporations and the associated tax base. Then these liberal areas would not be the RICHEST, because they would no longer be subsidized by holders of stocks that can’t do anything about the current situation. I know, just a wish, but I can have hope, can’t I?
Can we stop using the term “renewable” and call it for what it is “unreliable, weather-dependent”?
Great article, just a point about this…
“France has not installed any Offshore Wind generation”.
Nothing has been plugged in yet, (apart from one solitary floating 2MW eyesore), but there are seven large offshore projects in varying stages of development, with four other experimental projects based around floating barges and submersible technology waiting for authorisation.
For info they are:
Dunkerque, 46 turbines on a site 50km², 10km off shore, name plate ~600MW. Online 2027.
Tréport, 62 turbines on a site 110km², 15km off shore, name plate ~496MW. Online 2024.
Fécamp, 71 turbines on a site 60km², 13km off shore, name plate ~500MW. Online 2023.
Courseulles-sur-Mer, 64 spread over 50km², 10km off shore, ~450MW. Online 2024.
Saint-Brieuc, 62 spread over 75km², 16km off shore, ~496MW. Online 2023.
Saint-Nazaire, 80 spread over 78km², 12km off shore, ~480MW. Online 2022.
Noirmoutier, 62 spread over 83km², 12km off shore, ~496MW. Online 2024.
Each 500MW project costs ~2 billion Euros.
So 14 B Euros (~17 billion $) gets you ~3.5GW nameplate power that in reality is half that.
Wow….
There is one major item that is missing from this great analysis.
How much it has all cost and is costing every day.
here is a reasonable guess
https://edmhdotme.wordpress.com/the-excess-costs-of-weather-dependent-renewable-power-generation-in-the-eu28w/
Plus, of course, the even bigger elephant in the room. WTF does it do anyway? It ain’t taking any carbon dioxide out of the atmosphere and, even if it was, it would have zero effect on the climate.
These people are so mathematically illiterate that they can’t even do the calculation: zero multiplied by zero equals …..?
Of course there are the “clever” people (snakes?) milking their idiocy and hauling in the loot 24/7.
The late Sir David John Cameron MacKay’s decade old book “Sustainable Energy – without the hot air” is still very relevant to this discussion. Available free at:: http://www.withouthotair.com/
If anyone on this discussion board has not read it yet, you should. His discussions of the available density and usability of the sources to produce usable power still apply, as does the physics. All of the results of the efforts to decarbonize on the reliability of power available are predictable through math, not emotion.
The figures for UK generation capacity are drastically wrong. Try checking here
https://www.bmreports.com/bmrs/?q=foregeneration/capacityaggregated
Or here
https://assets.publishing.service.gov.uk/government/uploads/system/uploads/attachment_data/file/976058/UK_electricity_generation_capacity_in_the_21st_century.pdf
Indeed, I can’t find any match to the figures in DIGEST OF UNITED KINGDOM ENERGY STATISTICS 2020
https://www.gov.uk/government/statistics/digest-of-uk-energy-statistics-dukes-2020
Yes, IDAP it certainly is thankyou.
Great post. Too bad the indoctrinated left will likely never read it, or if they do, they will dismiss it since they “know” unreliables are the solution to stop the climate from changing. As Forest Gump would say, stupid is as stupid does. It will likely take some major grid failure affecting the lives of many thousands or possibly millions of people where the blame for the failure can only be placed on penetration and over-reliance of unreliables on the gird to wake up the masses. True believers will still not be convinced, but those not previously paying attention may finally figure it out.
Anyway, one question re: “Although storage solutions, such as batteries, might be able to combat such intermittency, it should be noted that the apparently massive battery storage capacity installed in South Australia at a cost of ~US$130 million can sustain the South Australian grid for its population of 1.7 million for about 10 minutes.
I thought I read somewhere that the batteries in South Australia were used primarily to stabilize the grid due to intermittency issues caused by the large installation of wind turbines. Is that remotely true or I completely mistaken?
UK faces electric shock: Reliance on Europe for power could land Britain in big trouble (thegwpf.com)
Every country in Western Europe seems to be relying on their neighbours reliable fossil fuel generators, whilst closing their own down.
The difficulty of changing the UK’s direction of travel is perfectly illustrated in the person of a previous Minister for Energy and Climate Change. I had been banging onto him for years about renewables not doing the job, without getting sensible replies. When i attended a meeting where he was speaking he bounced up to me in his usual Tiggerish way.
“Julian, solar power, solar power’s the thing. panels getting cheaper, it’s the answer”
“Yes, Minister, but you’ll need to store the energy.”
He is famous for looking blank while he thinks of an answer. He looked blank. Then…
“Yes, of course. Yes. We’ll need to store the energy.” Bounced off.
He didn’t know, the Minister for Energy didn’t know that electricity doesn’t just hang around waiting to be used.
And the man who may yet beat Boris thought it appropriate to be photographed gazing adoringly at the Doom Goblin.
Wrap up warm. It could be very cold when the lights go out.
JF
British politicians are innumerate and utterly clueless in matters of Science and Engineering.
“British politicians are innumerate and utterly clueless”
The rest is redundant
From the article: “Germany, alongside Denmark, (also heavily committed to Wind Power), now has the highest electricity prices in the developed world.”
And their electricity prices will only go higher as thay add additional windmills and solar.
They keep adding windmills, but they never say what they will do if the wind doesn’t blow for a week.
If they had 100 percent windmills powering their grid, then when the wind doesn’t blow, the electricity doesn’t flow to anyone. This is the logical outcome of such a plan. Why don’t these geniuses see this? All they see is the Small Picture not the Big Picture. And their Small Picture is costing their citizens and their economy a lot of money, which will only increase in the future if they follow this plan of powering their grid with weather-dependent electricity generators.
The right thing to do is to attribute the cost of maintaining conventional backup as a cost of using “renewables”, which ERCOT in Texas notably failed to do.
China on a coal Spree: https://e360.yale.edu/features/despite-pledges-to-cut-emissions-china-goes-on-a-coal-spree Lets look at the data and see who is being taken for a sucker:
Here are the number of Coal fired power stations in various countries with the 2nd numbers signifying planned and population size in brackets:
… 4 / …….0….UK…………… .(66,600,000)
….19 / …..60….Philippines … (108,100,000)
….56 / …..93….Turkey ………..(82,000,000)
….58 / …..26….South Korea ….(51,710,000)
….79 / …..24….South Africa … (58,560,000)
….90 / …..45….Japan ………..(126,300,000)
241 / ……4….US ……………(328,200,000)
…468 / ….27….EU ……………(446,000,000)
…589 / ..446…India ……… (1,366,000,000)
2,363 / 1171…China …….. (1,398,000,000)
China called on rich countries to “pay their debts” on climate change at global talks criticizing developed countries for not doing enough to reduce greenhouse gas emissions and provide finance to help poor countries do the same.
Weather Dependent Renewable power performance in Europe DE UK FR: 2020
Walter Horsting’s 2021-05-08’s table rearranged; totals, percentages, and last two columns added by Robert A. Taylor.
Here are the number of Existing and Planned Coal Fired Power Stations:
Existing Planned Combined Location Population # per 1E6 T# per 1E6
…..19…………..60……………79……..Philippines….108,100,000……….0.73………..0.73
…..56…………..93……………14…………Turkey………82,000,000……….0.68………..1.82
…..58…………..26……………84…….South.Korea…..51,710,000……….1.12………..1.62
…..79…………..24………….103…….South.Africa…..58,560,000……….0.96………..1.76
…..90…………..45………….135………….Japan……..126,300,000……….0.71………..1.07
…589…………446……….1,035…………..India…..1,366,000,000……….0.43………..0.43
2,363………1,171……….3,534………….China…..1,398,000,000……….1.69………..2.53
3,254………1,865……….5,119…..Sum.of.Above.3,190,670,000……….1.01………..2.53
82.03%……98.36%…….87.31%…..%.of.Table……….79.14%……….══════…══════
…….4……………0……………..4…………….UK………….66,600,000……….0.06………..0.06
…241……………4………….245…………….US………..328,200,000……….0.73………..0.75
…468…………..27………….495……………EU………..446,000,000……….1.05…………1.11
…713…………..31…………744……UK.+.US.+.EU..840,800,000……….0.85………..0.88
.21.91%…….1.66%……14.53%….%.of.Top.Sect………26.35%……..══════…══════
.17.97%…….1.64%……12.69%…….%.of.Table………..20.86%……..══════…══════
The last two columns can only be suggestive. I suspect newer installations will be at least as large as older. I doubt CO2 capture will be implemented.
SORRY! Here is the corrected table. I was in too much of a hurry yesterday, and allowed some obvious errors to slip through.
Here are the number of Existing and Planned Coal Fired Power Stations for Various Countries and Combinations:
Existing .. Planned . Combined … Location ………. Population … # per 1E6 . T# per 1E6
…. 19 ………… 60 …………. 79 …….. Philippines …….. 108,100,000 …….. 0.18 ……… 0.73
…. 56 ………… 93 …………. 14 ………… Turkey …………. 82,000,000 …….. 0.68 ……… 1.82
…. 58 ………… 26 …………. 84 …….. South Korea …….. 51,710,000 …….. 1.12 ……… 1.62
…. 79 ………… 24 ……….. 103 …….. South Africa …….. 58,560,000 …….. 0.96 ……… 1.76
…. 90 ………… 45 ……….. 135 ………… Japan ………… 126,300,000 …….. 0.71 ……… 1.07
.. 589 ………. 446 …….. 1,035 …………. India ………. 1,366,000,000 ……. 0.43 ………. 0.76
2,363 ……. 1,171 …….. 3,534 ………… China ……… 1,398,000,000 …….. 1.69 ……… 2.53
3,254 ……. 1,865 …….. 5,119 …… Sum of Above . 3,190,670,000 …….. 1.01 ……… 1.60
82.03% …. 98.36% ….. 87.31% …… % of Table …………79.14% ……….––––––……––––––
…… 4 …………. 0 …………… 4 ……………. UK ……………. 66,600,000 …….. 0.06 ……… 0.06
.. 241 …………. 4 ……….. 245 ……………. US ………….. 328,200,000 …….. 0.73 ……… 0.75
.. 468 ………… 27 ………. 495 ……………. EU ………….. 446,000,000 ………1.05 ……… 1.11
.. 713 ………… 31 ………. 744 ……. UK + US + EU ….. 840,800,000 …….. 0.85 ……… 0.88
21.91% ….. 1.66% …. 14.53% …. % of Top Sect. …….. 26.35% ……….––––––……––––––
17.97% ….. 1.64% …. 12.69% ……. % of Table ………… 20.86% ……….––––––……––––––
If I am reading this article correctly Germany, the EU, any country that decides on “Renewable Energy” as their sole source of power is going to need five times the capacity of installed “Renewable” as their typical, average power demand to obtain all power from renewable. Problem is that typical average, etc. is just that AVERAGE. Having sufficient capacity for average does not meet peak demand.
The other problem I noted is that the article indicates that approximately 25% the land area of the country is covered with Wind Turbines and is only providing about 10 % of the typical power, Same for Solar. That implies 200% of the land is needed for Wind and another 200% is needed for solar. At least you can put solar panels under wind turbines, but it is still covers more than 100% of the countries land area!
That means Wind turbines next to the schools, businesses, parks, etc. even your home.
Uh, a grid with all power provided by unreliables, even with five times the capacity as the average demand, won’t be able to meet not just the peak demand but will not be able to meet ANY demand when the sun isn’t shining and the wind isn’t blowing.
Or large wind turbines out at sea and most roofs covered with solar panels.
griff, as I asked you above – so effing what? What will be the effect of that crap on the Keeling curve. Due to the rather small bandwidth of what is allegedly your brain, you haven’t thought about that one yet have you?
How much fossil fuel energy is required to manufacture the huge quantities of cement for the foundations of off-shore wind turbines? How much fossil fuel energy is required to mine and refine the rare-earth metals and the copper for the generators?
I believe the correct term for them is Grid-Destroying Non-Dispatchable Unaffordable Unreliables.
It looks like, outside of extraordinary circumstances of either having a lot of geothermal energy or hydropower capacity, that developed countries have an upper limit of 30-40% for renewables without a substantial electricity storage infrastructure.
Even if externalities of carbon emissions are accounted for, does it make sense to store electricity with all the attendant inefficiencies, hazards and losses at a cost of at least twice what it costs to generate it? Isn’t that like putting a Casio watch in a Cartier box?
I’d like to see another chart where they don’t just measure the output of all the energy sources, but measure how much of that energy was actually usable. I suspect a lot of the so called renewable energy was being generated at a time when it wasn’t needed and ended up being dumped.
which is why we have grid scale storage and green hydrogen, plus long distance transmission by HVDC – to avoid that.
The grid has storage capacity – what Green new chancellor candidate is telling us to – grin 😀 😀 😀
Hydrodgen is colorless – if it turns to green, it gets dangerous ! 😀
That’s hilarious! I didn’t realise that griff could be so funny.
griff
please provide a link to the those companies currently producing cost effective and large scale amounts of sustainable ‘green’ hydrogen. Thanks
tonyb
There are HVDC lines, if you had actually read the article you would know that it discussed energy exports. You should know that unreliable electricity has all the problems that it does despite the HVDC lines. With respect to grid scale storage, you are lying. There’s no such thing. W.R.T. green hydrogen, there are only highly subsidized, small-scale pilot plants. It’s far too expensive to stand on its own at full scale. Since you’ve been called out on that before, you’re lying again.
People talking about “Grid Scale Storage” should spend some time looking at “Pumped Storage.” Duke Energy has several. Duke Energy’s first pumped-storage plant, Jocassee Hydroelectric Station, was completed in 1975. This was followed by Bad Creek Hydroelectric Station, which began commercial operation in 1991. Then there is the reservoir. Environmentalists and NMBYs would never allow them to be built, but they give you an idea of how much area is required to store that much energy – even if this storage is a battery. Even Musk’s batteries he gave Australia only last in the single digits hours.
What “grid scale storage” and “green hydrogen” do “we” have? There are some pilot plants, and that’s it. But any realistic engineering analysis shows (and has shown, repeatedly) that neither of these will ever be feasible.
Once again, griff responds with easily disprovable lies.
This grid scale storage that griff cackles about, is capable of carrying the grid for 5 to 10 seconds, assuming demand is low at the time. It’s only purpose is to help renewables maintain frequency and phase.
Long distance HVDC only helps if the other areas happen to have excess power. Highly unlikely as renewable power continues it’s cancerous growth. Beyond that, even with HVDC, line losses are significant if you are trying to send that power more than a few hundred kilometers.
For perspective on the TES in the EU.
Data & Statistics – IEA
I keep hearing about the Hydrogen Economy to help with storage of energy. Any idea how you transport it? You can’t use existing pipelines.
https://www.imetllc.com/training-article/hydrogen-embrittlement-steel/
There is a well known failure mechanism that will prevent it from being transported in steel lines. Storage in tanks is also problematic, unless you buy very special tanks. Sabotage? Sure would be a spectacular explosion with high overpressures. It will be a very long time to develop and secure the infrastructure.
“You can’t use existing pipelines.”
Don’t tell griff
Third para:
“A data set accounting for their hourly and daily power output from 1/12/2019 to 31/11/2020 is used to examine the comparative performance of power generation in these three Nations. The overall comparison between the combined generating installations and the power output they achieve is shown below.”
Thirty days hath September . . .
Auto
Excellent article. The absurdity of the renewable energy capacity meeting such pathetically low percentages of total energy needs is clearly shown. This pathetic performance means energy costs can only be significantly higher because backup generation has to be available to meet energy and capacity needs but is restricted to lower total energy resulting in much higher unit costs of production and generation. So the unreliable renewables that create this situation get huge subsidies to promote this deficient operation that are charged to customers but not explicitly identified as such, renewables are provided preferences to operate when needed while other dispatchable generation is not allowed to operate if renewables can run with all of this driving up total energy costs and exposing the electric grid to unreliable outcomes if system planning is not able to anticipate all possible loads situations as occurred in Texas and California. What bunch of complete crap.
In Australia, the AEMO grid in 2020 delivered 203,110 GWh or an average of 23,200 MW each hour. On average, solar delivered 9.7%, wind 9.7%, hydro 7%, coal 66%, and gas 7.6%.
But of course every evening solar delivered 0%, and on occasion wind just 3%.
So despite over 12,000 MW of solar and 8,000 MW of wind nameplate capacity, they sometimes deliver a pathetic 800 MW when the evening peak demand occurs.
Please tell me where anyone can find a weather dependent “renewable” generator. I can guarantee with 100% certainty there is no such device available on earth at the present time. No generator currently in use and none made using the present form of WDGs could exist.
test
test png
test jpg
And of the 3 countries, which one has the cheapest electricity? It begins with and ‘F’ and has the lowest percentage of expensive unreliable generation for 2020. Quelle surprise as they might say.
These figures do not make sense to me.
In the UK, published figures show that the maximum output of Gas fired plants was 21GW.
Yet the above states that the installed capacity is 11.9 GW.
Can anyone explain the discrepancy in the figures?
Hi Nick
You are right. There is an explanation.
The output figures are those recorded as megawatts hourly. These are summed to give the equivalent power yearly output for each generation technology in Gigawatts. However, all dispatchable power is assumed and estimated to have a productivity / capacity percentage of 90%, as indeed it would have, were they generating without the intervention of Weather Dependent Renewables. This 90% figure is used to estimate the installed amount of dispatchable generation, which leads to the low discrepancy you note: thank you.
With the “Renewables Obligation”, meaning that if available Renewable generation is available, it, by policy, has to displace dispatchable power sources, which then run inefficiently, loosing profitability. In other words, this policy is a great way to destabilise and make ever more fragile the power supply of a Nation.
Whereas a safe operating margin should be about 20% of dispatchable power, the UK margin fell below 0% in 2017. The UK power supply is standing into danger.
test 2