From the AGU EOS publication (h/t to Dr. Judith Curry)
Better Data for Modeling the Sun’s Influence on Climate
Compared to other stars, our Sun is a remarkably steady source of light and heat, but its output does vary. Solar light, heat, and particle streams drive weather and atmospheric chemistry, but how (and how much) does the Sun’s variability affect the climate here on Earth? The role of solar variability in recent global warming is not just a bone of contention; it is also a question of overriding importance for the scientific understanding of our Sun and of climate change.
Scientists simulate historical and future climates by setting up a suite of initial conditions and seeing how these conditions change when various factors, called forcings, are applied. For example, how does Earth’s surface temperature change if it receives more or less heat from the Sun? How do the streams of ionized particles that make up the solar wind affect certain weather patterns on Earth? Data sets compiled from historical records provide the necessary information for model forcing, so ensuring that these data sets provide accurate, relevant information is key to producing realistic climate model scenarios.
Recently, a series of initiatives brought together scientists working on different aspects of this highly multidisciplinary issue. These efforts shared several common objectives, including better estimates of solar forcing and identifying and quantifying the uncertainties in these estimates.
Here we report on the outcome of three of these initiatives:
- “Towards a more complete assessment of the impact of solar variability on the Earth’s climate” (TOSCA), a project that uses a network of European scientists from 20 countries that met from 2011 to 2015 to assess contributions of solar variability to Earth’s climate
- Solar Irradiance Data Exploitation (SOLID), a European-funded project dedicated to merging all exploitable spectrally resolved solar irradiance records into one single composite data set
- An international team of scientists that met at the International Space Science Institute (ISSI) to produce a comprehensive data set that includes solar radiative forcing and contributions from energetic particles
These initiatives have culminated in the production of two public data sets to assist with the scientific analysis of solar forcing: a composite data set of all irradiance observations and a comprehensive data set containing different solar forcings (radiative and by particles) since 1850.

How Does Solar Variability Affect Climate?
Solar variability affects Earth’s climate in many intricate and nonlinear ways. Most effects are ultimately driven and modulated by the solar magnetic field and its conspicuous solar cycle, which repeats approximately every 11 years.
The effect of solar variability on climate is mostly hidden in the natural variability of the climate system; thus, careful statistical analysis is required to extract it from a noisy background. Such analyses require records that extend over a long period of time, but the paucity of observations in existing records poses a serious challenge. For example, scientists have been making direct measurements (from space) of the total solar radiative input into Earth’s atmosphere only since 1978, although there had been earlier attempts to measure it from the ground.
Full story at EOS here
Once again “settled science” takes it in the pants.
That comment left my science feeling rather Unsettled
Hmm.
1. Is c02 still a GHG? Yup
2. Do mans emissions still account for the rise in C02? Yup
3. Do GHGs still warm the planet? Yup.
4. Will doubling of c02 lead to 1.5 to 4.5C of warming? Yup.
Nothing settled, has been unsettled.
1. CO2 is still a GHG at 400+ ppm … but Water Vapour is a far, far stronger GHG at 10,000ppm to 40,000ppm .. AND is far more effective over the entire electromagnetic spectrum [Solar and re-radiation back from Earth] . (CO2 only has 2 absorption bands for Solar rad. and Water Vapour has 7: CO2 only has 2 bands for radiant energy back from Earth … Water Vapour operates over 80% of the entire re-rad range!)
2. Man-made CO2 is less than 5% of all CO2 … MAN’S PART NOT very effective at all!
3. GHG warm the planet a bit yes!! But the average temperature has been the same for 2 decades while CO2 went up 9% and CH4 by 5%. A weak correlation!
4 . Doubling CO2 will NOT double temperature!! Myth! IF the world heats up for any reason … more clouds will form, more umbrella-shielding, more rain, more cooling the atmosphere while scrubbing dust + some CO2 as well!
YOU ARE CORRECT IN ONE TRUE SENSE – it is unsettled … because ANYONE who talks ONLY of radiation without adding evaporation, condensation, precipitation, turbulence as in winds and storms and ocean currents is confessing they do not see the BIGGER PICTURE!
70.9% of the world is ocean and 65% is under cloud cover at any one time. Water Vapour is the KEY!!!
Let me define SETTLED for you.
Settled means your opinonated rants will amount to nothing.
Those points look pretty factual to me, with some passionate emphasis added.
Steven Mosher,
That is a pretty weak definition of “settled”.
I realize that you are trying for some sort of sarcasm, but it is telling that you are willing to twist ANYTHING in order to convince (yourself?) that your perception is still clear.
“You keep using that word, but I don’t think it means what you think it means.”
You can declare it settled all you want, but only you and your fellow acolytes are buying that lie.
Your definition of settled is fairly unsettled.
Ah yes, the “settled science” fantasy.
Especially ripe coming from somebody who darn well knows he’s peddling a load of tripe.
It’s known as the “Argumentum ad Verecundiam fallacy (argument from inappropriate authority)”.
Remember, the buttress of steve’s claim is that CO₂ is a GHG. While that minor fact is well known, it utterly ignores the reality that CO₂ substantively changing Earth’s atmospheric temperatures is unproven to this day.
* 1) Trillions of dollars spent without proof.
* 2) Activists tamper with historical temperatures to fake hotter modern temperatures.
* 3) Models, that is broken models, are frequently used instead of actual data.
* 4) Activists use hand waving excuses of little merit; e.g. “Heat is hiding in the oceans”.
* * i) Where activists wave magic wands instead of realistically explaining how heat enters the oceans, as it sure isn’t through CO₂ or Infra Red frequencies.
* 5) Global temperature averages are an utter joke.
* * i) Thousands of unique equipment installations, often poorly maintained.
* * ii) Equipment accuracy is assumed, but ranges from ±2°C to ±0.1°C.
* * iii) These allegedly modern temperatures are compared to temperatures derived from different unique equipment installations of lesser accuracy.
* 6) Where global temperatures are “corrected” through arbitrary infilling with temperatures up to 1,200km distant.
* 7) And as other amply demonstrate, steve pretends CO₂ is the primary atmospheric GHG, overwhelming H₂2’s GHG influences across all three phases!
* * i) Which means steve ignores H₂2 heat movement by convection.
* * ii) steve ignores H₂2’s influences on Earth’s albedo.
* * iii) steve ignores Earth’s greater than 70% coverage by liquid H₂2.
* * iiii) steve ignores liquid H₂2’s miniscule interaction with infrared frequencies.
* * iiiii) steve ignores H₂2’s vapor phase overwhelming dominance of energy frequencies in our atmosphere, including infra red frequencies where CO₂ is severely constrained to a very limited range.
yet, steve waves his hands to overlook all of the data problems inconsistencies, failures to factually and physically prove CO₂’s atmospheric influences.
Steve,
And your unsubstantiated assertions also will amount to nothing – yet another drive-by.
(1) is true;
(2) is only partly true – man’s contribution to overall atmospheric CO2 may be pretty small;
(3) changes the goalposts from CO2 to GHGs (all of them, Steve?) and there has been ample science published indicating that this sensitivity of 1.5 to 4.5 C is high – the number may only be 1.0, some assert its 0.0.
So, the science is settled in your mind, because you believe (4). What if the IPCC is wrong, Steve? What if the sensitivity is closer to 0.0?
Wrong, the definition of settled in the scientific realm is what can be ruled in. Leif recently circumscribed what can be currently ruled in very succinctly: the earth is roughly round, and it orbits the sun. Little else is settled unless you are content with high school physics and superstition.
Settled means your opinonated rants will amount to nothing. –>
Settled means your opinionated rants will amount to nothing.
_____________________________________________
.
Let there be more light.
“Man-made CO2 is less than 5% of all CO2” Where did you get that #? off by an order of magnitude, from what I hear. But prove me wrong; where did this # come from?
“Doubling CO2 will NOT double temperature!! Myth!” I think what’s mythical is that anyone ever made that claim. People have claimed a rise of 1.5 to 4 degrees K (or C); but for that to be double the temperature, the pre-warming temp would have to be 1.5 to 4 degrees K, which is cold enough to freeze the atmosphere. With the current Earth temp of (let’s say) 270 K (= 0 C), a doubling of temp would be a rise of another 270 degrees, making the oceans boil, and then some.
Absurdities on top of absurdities.
* Without evidence or proof.
Meanwhile NASA’s OCO-2 satellite that monitors CO₂ emissions/absorption clearly demonstrates that mankind’s influence is minor.
https://youtu.be/fPV1m_OOzWI
This one not settled. You can’t settle something with an unknown with a large uncertainty (ECS). But what would you know about science and its methods.
Nothing unsettled has been settled.
Mosher takes after Goebbels.
sorry settled. You dont understand what settled means in a practical sense.
SETTLED is not epistemic, thats what skeptics dont get.
SETTLED means that no serious group of scientists will waste their time challenging it. And Javier, the minute you acytually do your own work, post the code and data and stop hiding behind a cowardly moniker, others who do science MIGHT consider your stuff.
You’ve got to be kidding me. Lots of serious groups of scientists are researching precisely the value of ECS. If it is unknown it can’t be settled. God knows what will be the value of ECS if the theoretical concept even has a correspondence with something real.
If I say that ECS = 1.0, you can’t prove that I am wrong. You can only say that according to what we know and a lot of assumptions made it is highly improbable that I am right.
I guess your concept of settled is quite lax. You are facile.
O.K., now “settled” means something else.
Per you: “SETTLED is not …” related to knowledge or theory.
So, to paraphrase your (now honest) definition of SETTLED:
“We don’t care and we are not going to discuss it anymore.”
Thank you for the clarification. Do you believe that most other advocates/believers in CO2 as the long range & primary driver of climate change agree with your definition?
You have to remember that Steve, like the rest of the acolytes defines scientist as someone who agrees with him.
Hmm.
1. Is restating assertions scientific in any way? Nope.
2. Is believing Science never changes scientific? Nope.
3. Is believing without proof scientific? Nope.
4. Is quoting a massive range of potential outcomes from a simple increase in a single input proof the science in s settled? Nope.
1. e= mc^2
2. Settled does NOT MEAN never changes. But to Unstetle settled science you need to do BETTER SCIENCE. Hint, you cant.
3. There is no proof in science. There is only the best explanation.
4. Mistaken again about what Proof is.
Steven,
There is no proof in science, but there are falsification and confirmation of predictions made based upon hypotheses.
Scientists often use “prove” loosely to mean confirmation, but strictly speaking, “proof” in its mathematical sense doesn’t exist in science.
Very little is settled in science, especially climatology.
For over thirty years after WWII, Earth cooled dramatically despite steadily rising CO2. Then, in 1977, the Pacific Decadal Oscillation switched to its warm mode, and for the next two decades or so, the planet warmed slightly, accidentally coinciding with still rising CO2. Next, between the super El Ninos of 1998 and 2016, global average temperature, to the extent that such a thing can be measured, stayed flat, again in spite of increasing CO2.
Clearly, other factors outweigh whatever greenhouse effect CO2 might actually have. And feedback effects must be much lower than assumed by the IPCC, indeed quite possibly net negative rather than positive.
Thus, the hypothesis that man-made CO2 must produce dangerous global warming was born falsified. So far, the effect of more plant food in the air has been the greening of the Earth. The first proponents of the anthropogenic global warming hypothesis considered the effect beneficial rather than a threat, to include Arrhenius and Callendar.
“Climate science”, so-called, is so unsettled that observers don’t even know the net sign of any human effect on climatic phenomena, such as whether we contribute on balance to cooling or warming the planet. But in any case, the net effect is negligible on the global scale, however detectable locally and regionally.
1.) Was only initially believed by a small number of scientists it took a lot of work to somewhat settle it.
2.) Many things in science have been brought down by sheer luck or accidents and nothing to do with better science. So that statement is complete rubbish.
3.) That brings us to 3 which again you misquote, there is no proof there is only the best explaination that covers all known facts and observations. You are not allowed to select which observations or facts your theory covers. As the writer of your point 1 said it would take just one inconsistency to bring it down. Your response sounds like classic pseudoscience clap trap.
4.) So there is no proof but a theory must be consistent with all observations and data and so the data posed should be able to be reconciled. It is certainly outside my science range and I am pretty sure yours but it’s been posed none the less and it isn’t up to you to dismiss it.
If it changes, then it wasn’t settled.
Once again the warmists claim the right to redefine the definition of the words they use.
Steven Mosher: 2. Settled does NOT MEAN never changes. But to Unstetle settled science you need to do BETTER SCIENCE.
That is what the new data sets are for.
1. e= mc^2
Surely you are not suggesting that the ECS is as well supported as that? Better examples, imo, would be the gravitational constant and speed of light in about 1725.
people keep saying that there is no proof in science.
but they can never prove it.
because it is divine revelation.
and must be taken on faith.
because science is supernatural.
and scientists are powerful wizards who read omens, conjure demons and cast spells.
What is your best explanation for why CO2 does not lead temperature at any time scale?
Steve,
“Gimme that old time religion
Gimme that old time religion
Gimme that old time religion
It’s good enough for me.”
It’s a “new age” religion. But six of one, half dozen of the other.
The only point that has any significance is nr.4 All it tells us is we really haven’t a clue. Could be 1.5C could be 4.5C. That’s a huge uncertainty. So yes, you are right (sort of) That uncertainty is still settled.
All of the recent science points to an ECS well below 1.5C. But as usual, Mosher ignores anything that doesn’t support his agenda. (and his job)
ALL? of the RECENT? hey stupid, you missed the last few papers on ECS.
here is one of the most recent
https://agupubs.onlinelibrary.wiley.com/doi/abs/10.1029/2018GL078887
Steve… You do have a sense of humor!
The models say the observation-based ECS estimates are too low…

When the models disagree with observations, go with the models. The gospel according to “consensus science”.
To quote the late, great, admirable Dr. Michael Crichton:
“I want to pause here and talk about this notion of consensus, and the rise of what has been called consensus science. I regard consensus science as an extremely pernicious development that ought to be stopped cold in its tracks. Historically, the claim of consensus has been the first refuge of scoundrels; it is a way to avoid debate by claiming that the matter is already settled. Whenever you hear the consensus of scientists agrees on something or other, reach for your wallet, because you’re being had.
Let’s be clear: the work of science has nothing whatever to do with consensus. Consensus is the business of politics. Science, on the contrary, requires only one investigator who happens to be right, which means that he or she has results that are verifiable by reference to the real world. In science consensus is irrelevant. What is relevant is reproducible results. The greatest scientists in history are great precisely because they broke with the consensus.
There is no such thing as consensus science. If it’s consensus, it isn’t science. If it’s science, it isn’t consensus. Period.”
The models don’t say anything physically coherent, David.
See the WUWT post here.
See a video of my DDP presentation here.
Another model, written to prove what the programmers want to prove.
The sad thing is, there are a lot of people who actually believe that models are science.
Not a single set of physically valid uncertainty bars anywhere. The entire paper is physically meaningless.
Incompetence in print.
Like the rest of the alarmist cohort, they did not write the paper to inform.
Models again, forced with temperature data that may or not may be correct. That’s science, Steve? Please give us all a break.
That one has already been disproven (actually they disprove it themselves, but you have to dig into the “Supplemental Data” for that).
3 truisms followed by a complete lie.
Typical Mosher.
The sun is a more significant factor than CO2 (or c02) and Mosher knows that … that is why he wanted to hijack the thread that early.
Steven Mosher: 4. Will doubling of c02 lead to 1.5 to 4.5C of warming? Yup
Maybe. What’s “settled” about a 90% CI that is 3C wide? Which untested assumptions does the calculation depend upon?
Are climate models able to predict the impact of a global forcing change of 0.035 W/m^2 year^-1? Emphatically nope.
All of your points 1-4 are rendered moot, Steve. Every single one of them.
You donb’t know what you’re talking about, neither do climate modelers, and neither does the IPCC.
You all live on false precision.
And that includes you folks at BEST.
“All these effects, however, are found to have a minor impact on climate in comparison to recent man-made global warming.” Facepalm. I knew it had to be there, somewhere though. They really are only pretending to study the sun’s effects on climate.
It’s true, sort of.
All the possible explanations for recent global warming leave something to be desired. The alarmists then use that to insist that, because no other explanation works very well, it must be anthropogenic CO2. As far as I can tell, it’s an argument from ignorance. In any event, they’re trying to switch the burden of proof away from them having to prove their CO2 hypothesis.
CM refers to intellectual baby talk.
They have no clue.
They don’t know what all the effects are, but they know it is much less than that from the additional CO2 that mankind has added to the atmosphere. And they wonder why we call them unscientific.
But over the long term, the climate impact asserted to be due to man-made global warming is insignificant in comparison to the impacts of the Milankovith parameters: Earth’s obliquity of the ecliptic, Earth-Sun orbit eccentricity, Earth’s axial precession, and Earth-Sun orbit apsidal precession.
Over the short term, the effect of asserted man-made global warming is minor when compared to the temperature variation over 12 months at any location on Earth (i.e., experienced during one revolution of Earth around the Sun).
Over an even shorter term, the global temperature effect of asserted man-made global warming is minor in comparison to diurnal temperature variations.
Yes, typo . . . the proper spelling is Milankovitch.
Something WAY BIGGER than Man has only had a minor impact on something bigger than Man? (A planet)
Pride, ego. Man’s default mode.
Fraud and dishonesty you mean, they have no pride, and they mistake virtue for integrity …..
I believe you mean virtue signaling.
“All these effects, however, are found to have a minor impact on climate in comparison to recent man-made global warming.”
‘Are found’, past tense. Looks like they have a brief to follow.
They will be disappointed that ‘minor’ impacts also generate ‘minor’ grants of money.
I have always wondered why all I ever hear about is the Sun’s energy output in a sliver of the spectrum so narrow that it is essentially less than 1/10th of 1 percent. more than 50 years ago I built a transistor radio that had no battery, All power to operate the radio was obtained from the antenna. This radio picked up all of the local stations in the city I lived in with a length of wire only 3 feet long. One station could be picked up with just one element of a broken “Rabbit Ears” TV antenna. After getting my Ham Radio License, I discovered the noise from Jupiter. Here again I measured signal levels greater than 50uv into a 50 ohm from a ~25 foot vertical antenna. P=V^2 / R, P = 50 x 50 / 50 = 1 uW. that is from Jupiter. How much is coming from the Sun?
When I was a kid, back in the 50’s, my father helped me build a cat’s whisker crystal radio. Very simple, with a sliding tuning coil built from a cylindrical Quaker Oats box wrapped with 25 feet of copper wire and a Galena crystal with a tuning whisker. And it worked!
I still have one of his radio tech books from the ’30’s.
Pretty sure he was a closet Nicolas Tesla fan…
There is more coming out of the Sun then just heat.
Same reason global temperature is always described by temperature with n o mention of the humidity component or total enthalpy. It’s easier to determine and works just fine when used for deception.
Will Jones, Mann and Lean lead the study ?
One of the initiative’s dataset is discussed here. Curiously, while they give monthly values for almost all variables, they do NOT do that for sunspots. Instead, they give smoothed values. Bizarre.
Otherwise, it’s a fascinating dataset, part fact, part extrapolation, part spliced. Hmmm.
It also looks like they are using the old sunspot data …
w.
The climate data records are ‘calibrated’ to the [old] group sunspot numbers and the [old] cosmic ray record and are thus not representative of the ‘truth’,
http://www.leif.org/research/Defense-of-GN-Revisions.pdf
Well, while we’re on the subject, I have a question about the nitrogen component of Earth’s atmosphere:
If the sun, by whatever means, can heat the entire mass of Earth’s atmosphere, then doesn’t this mean that the entire mass of Earth’s atmosphere must radiate in the infrared?
Warm nitrogen is an interspersed warm fluid mass above absolute zero, after all. How can it not radiate? All masses above absolute zero radiate, I thought.
Robert K.- Hey, you’re right! OMG, we have GOT to go zero nitrogen emissions or we’re DOOOOmed! We’ll need a nitrogen tax, to subsidize renewable… uhm… oh what the hell, wind and solar must e low-nitrogen emissions, right?
How can the sun have a effect on earth’s climate.
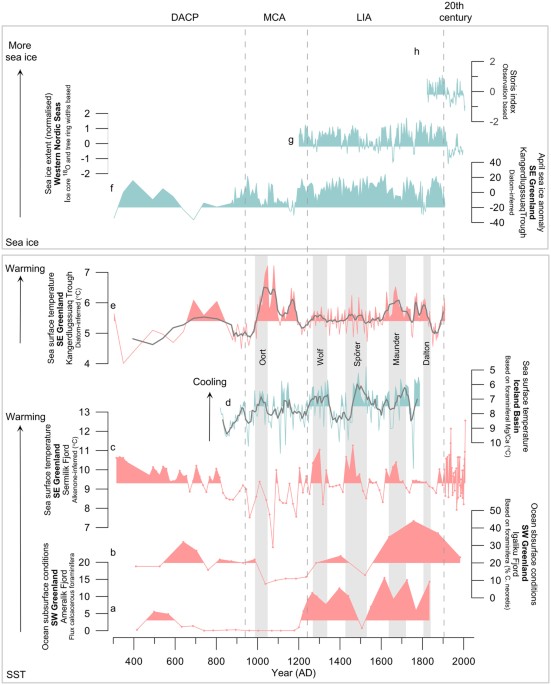
Well one good way would be to make the global jet stream become more unstable and fragmented. Which would lead to a increase in weather blocking patterns. The old weather records from England and europe during the LIA suggest this is what exactly happen. ln the UK the main cause of cold winters is due to blocking. Which stops the flow of warm air coming from the Atlantic and replaces it with cold air from the Arctic or from the east.
The same would have been true in the LIA so with the colder winters during the LIA there would have to have been a increase in weather blocking patterns.
I’d like to see somebody provide a calculation of how much of our recent warming is due to temperature rise in the Arctic. It seems to me that without that we have next to nothing for global temperature change.
Furthermore, the change (rise) in the Arctic is entirely due to the relative absence of ice, which means the difference between a marine climate or a much colder, ice bound “continental” type climate.
If one considers the possibility that the Arctic ice extent comes and goes more as a result of sea temperature than air temperature ( Ice extent is a balance between those two factors overlaid on the seasonal effects of insolation variance), then we see that everything AGW is dependent on something as simple as varying Arctic ocean currents. We know next to nothing about these historically, but there is evidence that the Arctic was quite open in the recent past and we had record high temperatures in many parts of the world in the 30’s. Everything else that AGW purports to “know” about the world’s past temperature is bogus.
Yes l also think that a large part of the so called “global warming” is down to warming in the Arctic during the winter. One way to test this idea would be to look at any old records of wind direction that may have been kept within the Arctic circle. To see if there has been a increase in warmer winds from the south over recent years.
As these winds not only push warm air into Arctic. But also can push warmer water towards the Arctic, as well as sending sea ice back northwards.
The south west winds of recent decades over the North Atlantic, not only deliver warm winds into the Arctic and Northern Europe but also increase the volume of the warmer waters of the North Atlantic Drift reaching the Arctic Basin.
Furthermore, the SW winds increase humidity over The Arctic Basin and Northern Europe and strongly influence the radiative balance.
The jet stream interacting with The Azores High seems to be a changing factor and sits well with Joanna Haigh’s research involving the suns radiative changes and ozone and the correlation made with cold winters in NW Europe and Eastern North America.
The AMO could easily be another contributing cause.
Research into wind directions in the North Atlantic over the last few decades, as already been suggested would indicate readily whether this view stands or not.
Unlike the pacific…the atlantic flows directly into the arctic….I blame it on the AMO and winds because of that
Increased negative NAO during solar minima drives a warm AMO and Arctic.
https://www.iceagenow.info/north-atlantic-surface-waters-cooling-headed-maunder-minimum/
The data does not support your claim.
Secondly overall oceanic sea surface temperatures will continue to fall as long as solar activity is very low, which is what is happening.
What is your explanation for the North Atlantic cooling? I know you said noise so if that is what you believe so be it. I just see it differently.
What is your explanation for ignoring the data that I linked for you last time, showing that the AMO has warmed from July.
https://www.esrl.noaa.gov/psd/data/correlation/amon.us.data
The trend is down and no trend goes straight down . It is to soon and more time will be needed to see where it goes.
However, from today’s sea ice extents (1978-2018), less Arctic sea ice over the entire years means more heat is lost from the newly-exposed Arctic ocean over a full year’s time than is gained in the short five months of summer’s solar radiation. Now, if the Arctic sea ice anomaly were changing significantly over the year, there could be less heat energy lost between mid-August to mid-April.
But that isn’t happening: the Arctic sea ice anomaly is remarkably steady over the year.
Over the last few years, arctic ice has been higher than average in the summer and lower than average in the winter.
That results in a lot of extra heat being dumped to space.
John;
“If one considers the possibility that the Arctic ice extent comes and goes more as a result of sea temperature than air temperature ” I have always had those thoughts. For example hang an ice cube by a string in air at the same temperature as an ice cube in a five gallon bucket of water at the same temperature as the air. Which melts first? What wind speed does it take to get the ice in the air to melt in the same time. Repeat with both in and not in sunlight. Why does the Ice melt (disappear) when the air is colder than the Ice? , even at night? Same for Ice in the ocean (Saltwater) at a temperature below that of the Ice.
It all comes down to the strengths of the magnetic fields. Notice I said fields. It is just not the solar magnetic field that matters but also what the geo magnetic field is doing. When both solar/geo magnetic fields are in sync the given solar effects will be compounded as is the case now. Both are weakening.
As I have been expecting the cooling has now started in response to the weakening magnetic fields. It
started in late year 2017.
My two solar conditions necessary for cooling being 10+ years of sub solar activity in general (2005) followed by a period of time of very low average value solar parameters (late year2 017) which will lead to overall lower oceanic sea surface temperatures(less UV light) and a slight increase in albedo due to greater cloud coverage/snow coverage and an increase in major explosive volcanic activity. This due to an increase in galactic cosmic rays and a shifting to where they are directed.
In addition the less EUV light contributes to a more meridional atmospheric circulation with the zones pushed equatorward which lead to lower global temperatures and an increase in global cloud/snow coverage.
Earthquake activity of 4.0 magnitude or higher has increased 30% over the last 30 days. More evidence of weakening magnetic fields.
I said way back over a year ago that year 2018 would be the transitional year and so far so good. Overall oceanic sea surface temperatures off almost .2c since last summer while overall global temperatures are running colder then last year thru the end of August.
I know it is early and the trend has not been long but it has to start sometime, some place and I say that sometime, someplace is now.
Hope you’re right. If only to shut the glowbawarming cretins up.
Bruce Cobb:
You forgot, it’s no longer “Global Warming”, it’s “Climate Change” so if it gets colder that will also be caused by Mann-made “Climate Change”.
That’s why they changed it to Climate Change, it’s a heads I win tails you lose scenario, either way, we must change our evil Capitalist ways & adopt Globul Socialism! Nulius novus sub Solis!
Until solar impact on climate is fully accounted for, including Svensmark’s Effect, spectral shift to UV in times of elevated activity, &c., climate models will remain Mickey Mouse cartoons, of interest to immature individuals only, unreliable, untrustworthy, no more than tools of deceit.
It’s an effort to disprove the sun has any influence on climate at all under the guise of “better data for modeling…. ” well there you go…. modeling. Yes, we took the googolplex to the nth derivative degree and discovered nothing. It proved whatever we were saying all along.
Why bother when the results are going to be known before they start looking? They don’t really look, they twist whatever they have to fit an agenda… it’ll be worse than they thought somewhere.
Very likely. The heat in the oceans is hiding so well that it gives the appearance that sea temperatures are actually dropping! Amazing!
This is rather edgy for European scientists to be looking into something as settled as this. I suppose they could reinforce the standard line that there is no effect and CO2 dominates in all aspects.
It looks to me as if they are preparing to fudge solar data.
We have a pretty good idea of what the solar EUV has varied since about the 1740s and of the sun’s magnetic field since the 1840s.
See http://www.leif.org/research/Multi-Messenger.pdf and
http://www.leif.org/research/EUV-F107-and-TSI-CDR-HAO.pdf
A composite record of the total unsigned magnetic (line-of-sight) flux over the solar disk can be constructed from spacecraft measurements by SOHO-MDI and SDO-HMI complemented by ground-based measurements by SOLIS covering the period 1996-2016, covering the two solar mimina in 1996 and 2009 and the two solar maxima in 2001 and 2014. A composite record of solar EUV from SOHO-SEM, TIMED-SEE, and SDO-EVE covering the same period is very well correlated with the magnetic record (R2=0.96), both for monthly means. The magnetic flux and EUV [and the sunspot number] are extremely well correlated with the F10.7 microwave flux, even on a daily basis. The tight correlations extend to other solar indices (Mg II, Ca II) reaching further back in time. Solar EUV creates and maintains the ionosphere. The conducting E-region [at ~105 km altitude] supports an electric current by a dynamo process due to thermal winds moving the conducting region across the Earth’s magnetic field. The resulting current has an easily observable magnetic effect at ground level, maintaining a diurnal variation of the geomagnetic field [discovered by Graham in 1722]. Data on this variation go back to the 1740s [with good coverage back to 1840] and permit reconstruction of EUV [and proxies, e.g. F10.7] back that far. We confirm that the EUV [and hence the solar magnetic field] relaxes to the same [apart from tiny residuals] level at every solar minimum. Since the variation of Total Solar Irradiance [TSI] is controlled by the magnetic field, the reconstruction of EUV does not support a varying ‘background’ on which the solar cycle variation of TSI rides, strongly suggesting that the Climate Data Records advocated by NOAA and NASA are not correct before the space age. Similarly, the reconstruction does not support the constancy of the calibration of the SORCE/TIM TSI-record since 2003, but rather indicates an upward drift, suggesting an overcorrection for sensor degradations.
Wha?
a very cogent comment…
Thanks, it’s one I copied from Mosh, one of your fans.
not having the guts to have your own opinion?
An opinion on what? Your gobbledygook?
If you cannot grok my comment perhaps you should not display your incapacity so openly…
You deliberately used gobbledygook as a shield, so perhaps you shouldn’t display your dishonesty and disingenuity so openly. Oh wait, that is your trademark. Carry on.
To the unwashed masses, science looks like gobbledygook.
Now, since you quote Mosh you must be fan of him too.
He only dreams that his drive by comments could rise to the level of mine.
In short, our ability to detect smaller and smaller changes are increasing, but it still has no discernable effect on climate ?
Both solar changes and man-made contributions surely exist. The unknown here is how much? and if benign or bad?
Or good , who wants to hear good news ?
If that is so, explain why in the UNIPCC 4th AR 2007, WG1 figures for atmospheric CO2, & the proportions of Natural verses Human contribution, result in Man’s megre 4% contribution results in a fraction of 1/62,500th part, meaning the remaining Natural contribution becomes 62,499/62,500ths. These come from the “official” science figures? From an engineering viewpoint my money is on “it doesn’t make a blind bit of difference!”
Leif, I believe I followed your outline for unchanging solar cycle (excluding Mg II & Ca II indices) up until you stated; “strongly suggesting that the Climate Data Records advocated by NOAA and NASA are not correct before the space age. ”
What climate data records do you refer to, and what did/does NOAA & NASA advocate for regarding a “varying background”? A variation to EUV or other cycle?
Start with Slide 49 of
http://www.leif.org/research/EUV-F107-and-TSI-CDR-HAO.pdf
Leif Svalgaard, thank you for the links, this and those below. I still don’t see how you think they have implications for today’s post.
Because the models of the post do not reflect reality. So correlating with climate based on faulty datasets is not useful.
Leif, would you please estimate the annual degradation in SORCE for each of the last ten years in W/m^2/year, and explain how the estimate was made?
See Slides 58 ff of http://www.leif.org/research/EUV-F107-and-TSI-CDR-HAO.pdf
LASP Tom Woods agrees with me:
Leif Svalgaard
Sat, Apr 28, 6:36 AM
to Tom
Hi Tom,
I read with interest your newest paper on SSI, TSI trends and wnat to draw attention to my earlier analysis, that I presented at HAO:
http://www.leif.org/research/EUV-F107-and-TSI-CDR-HAO.pdf
I found a 22 ppm uncorrected trend.
Tom Woods
Sat, Apr 28, 11:41 AM
to leif@leif.org
Hi Leif,
Indeed – now there are 3 analyses that have found similar trend for the SORCE TSI record.
Greg Kopp may not update SORCE TIM data product though, at least not until there is more overlap with the new TSIS-1 TIM observations.
Tom Woods
LASP / University of Colorado
3665 Discovery Dr.
Boulder, CO 80303
E-mail: tom.woods@lasp.colorado.edu
Phone: 303-492-4224
FAX: 303-492-6444
Cell: 303-931-4600
Leif Svalgaard
Sat, Apr 28, 4:20 PM
to Ed
Tom Woods is beginning to agree with me that the SORCE TIM has been drifting and that therefore the NOAA CDR is not correct.
TSI simply follows the total magnetic flux on the Sun, which means that we can find a lower limit for TSI during the Maunder Minimum [extrapolate to the floor]. It seems to fall to me to discover all those data that have been wrong and need correction…
Leif,
How do you define “drifting”? I find the level of accuracy indicated here http://lasp.colorado.edu/home/sorce/instruments/tim/ to be hard to believe in any event given potential interferences of a physical nature due to such things for example as mounting and positioning of equipment of which I am, of course, totally unaware in this case.
‘Drifting’ could be defined as a progressive deviation from what other sensors or measurements [even models] show.
Be sure that the physical positioning etc have been taken into account, For TSI the issue is how to ensure that stray light does not enter the sensor.
The ‘accuracy’ is stated to the 0.5 W/m2, which is larger than the drift. What is important is the ‘precision’ [repeatability] which is 0.007 W/m2. Not included are any [unknown] systematic errors.
It seems to fall to me to discover all those data that have been wrong and need correction…
Don’t count your chickens before they’re hatched….
YTD 2018 SORCE TSI is lower than YTD 2006, as of Sep1, is still regularly higher by about 0.15 wrt prior F10.7cm correlations, because solar activity in X-ray flux hasn’t been as low enough yet for long enough as in 2007-2009:
s still regularly higher by about 0.15 wrt prior F10.7cm correlations
Because SORCE/TIME is miscalibrated since 2010.
Because SORCE/TIME is miscalibrated since 2010.
No, that’s still an unproven assumption.
The current difference is due to the fact that the F10.7cm-TSI correlation I base this on for the low solar activity range is heavily weighted by the low activity years 2006-2009, and since we have just entered into such a low period with many more days of A0.0 x-ray flux, for whatever length of time, the sun hasn’t been quiet enough long enough for TSI to drop into the lowest range again, so it is unwarranted to expect today for it to have returned yet to the same correlation as the during the last extended minimum.
I think we must wait until the minimum has been decided to make any confident assessment of SORCE degradation.
No, that’s still an unproven assumption.
There are now four lines of evidence that SORCE/TIM is not correct:
1) Comparison with F10.7 [by me, and you!]
2) Analysis by LASP itself [MUSIL, as per Tom Woods]
3) Comparison with the Belgian series [Stevens]
4) Comparison with PMOD
LASP has agreed that SORCE is wrong, but will wait with officially admitting it and changing the series until they have more data from TSIS.
See Slide 11 of
http://lasp.colorado.edu/media/projects/SORCE/meetings/2018/final/Oral_PDFs/20_Woods.pdf
that shows that the corrected SORCE/TIM trend is close to that determined my Stevens and me:
Slides 58-61 of http://www.leif.org/research/EUV-F107-and-TSI-CDR-HAO.pdf
You were at the meeting at Lake Arrowhead, so must have heard Wood’s talk. Did you not pay attention?
For the last 2.5 months I’ve been rebuilding our deck, not reading papers, and it was 6 months ago. I wanted to talk to Tom and Greg about this there but there was so little time for my questions.
The email you posted does not have Tom saying he agrees with you. He said in there that three sources have claimed a similar trend, not exactly the same thing as saying he agrees with you [he may for all I know].
The trend everyone speaks of could be largely natural, due to the factors I mentioned in my earlier comments, meaning all the people talking about the trend could be missing the natural reason for most of it.
In other words it might just be at least partially an attribution issue.
The other big problem I see with this is comparing the other TSI sets to make the trend analysis, when who knows how good they are really.
PMOD is constantly being re-adjusted, and to what expectations?
The Belgium series does not “prove” that SORCE is ‘wrong’.
For all we know SORCE is the best and the others aren’t as good.
I’ll be patient and wait for the minimum and TSIS-1.
The email you posted does not have Tom saying he agrees with you. He said in there that three sources have claimed a similar trend, not exactly the same thing as saying he agrees with you
One of those three sources is my analysis.
Here is the email correspondence:
Leif Svalgaard
Sat, Apr 28, 6:36 AM
to Tom
Hi Tom,
I read with interest your newest paper on SSI, TSI trends and want to draw attention to my earlier analysis, that I presented at HAO:
http://www.leif.org/research/EUV-F107-and-TSI-CDR-HAO.pdf
I found a 22 ppm uncorrected trend.
Tom Woods
Sat, Apr 28, 11:41 AM
Hi Leif, Indeed – now there are 3 analyses that have found similar trend for the SORCE TSI record. Greg Kopp may not update SORCE TIM data product though, at least not until there is more overlap with the new TSIS-1 TIM observations.
His talk [and paper] finds the same trend as the Belgians and I [about 20 ppm], within the error bars.
I’ve doubted the full extent of what is said on SORCE TSI degradation only because of the way it and the other solar data are unfolding now, as I had earlier discussed, not based on other instruments’ performance.
The method and regularity of adjustments to older datasets should be taken into account, ie recent years in PMOD appear over-corrected, before using them as a basis for judging the suitability of newer datasets
May the best data and theory win.
The most recent PMOD version is showing a lower value for this year than all of the previous solar minimum, which I think is unjustified at this point in this solar cycle wrt SSN and F10.7cm, and X-ray flux, as I previously discussed. The 1805 version also has a “new” scale in the 1355-56W range – why?
Here’s a paradox: Is Svalgaard contradicting Svalgaard’s view of a flat magnetic field floor at the solar minimum by agreeing with the current PMOD 2018 minimum TSI value, which actually is in violation of the principle Svalgaard established wrt to the floor? [PMOD TSI is lower now, when F10.7cm isn’t as low wrt the previous solar minimum relationship – how can this be?]
These are the PMOD versions I had files of – there were many prior versions:
PMOD has its own calibration problems. The calibration has been a moving target ever since I pointed out to Froehlich a decade ago that he had problems. The most reliable analysis is shown on Slides 52, 58, and 59 of http://www.leif.org/research/EUV-F107-and-TSI-CDR-HAO.pdf
It is important that LASP now admits that. Their lame excuse [that they will wait until a year of overlap with TSIS] is contemptible.
I think I caught that, or most of it. What are the implications for the curation of these data sets, or their use?
They are like babes in the woods. They still think Papa CO2 is in control. How little they still know.
‘Several international initiatives are working to stitch together data describing solar forcing of Earth’s climate.’
What on Earth does that mean? ‘Earth’s climate’ is nonsense. Global mean temperature is NOT climate. There are many climates scattered across the earth. There is NO SINGULAR ‘CLIMATE.’
Ice in Antarctica; blowing sand in the Sahara. At the same time. ‘Earth’s climate’ is nonsense.
At least one of the initiatives appears directed at reinforcing the conviction that anthropogenic greenhouse gases are responsible for climate change.
I was surprised by the TOSCA initiative not including in the direction any of the European scientists that are advancing so much our knowledge of the solar variability effect on climate. The reason why is given in the foreword of the book they have published that is directed to students and policymakers.
https://flipbook.cantook.net/?d=%2F%2Fwww.edenlivres.fr%2Fflipbook%2Fpublications%2F211791.js&oid=356&c=&m=&l=&r=&f=pdf
The foreword by Roger-Maurice Bonnet from the ISSI explains that he was hesitant to foreword the work because:
But he finally wrote it because he agrees that the result:
Now I understand why those big names in solar-climate research are not involved despite the money distributed, and why the end result is a beautifully edited book for students and policymakers.
This does all get confusing.
Hansen presented the perfect model on which to base surrendering cash and freedom to “Government” back in, what was it, 1989?
Did his model not include the Sun?
Now they need a new next new model that does include the Sun but still one that justifies the same solution?
(Doctored Mann, you should have read a bigger trea ring.)
Did anyone see where some clever folks measured how spherical your average electron was/is.
Think the conclusion/result was that, if the/an/any electron was the size of Neptune’s orbit, the tallest feature on its surface would be one millimetre tall.
They couldn’t measure any less than that….
Maybe one metre, I can’t recall exactly. It wasn’t much though.
And so it is with Planet Earth.
If it had the sphericity of an electron and was made of a *completely* uniform material all the way through, with totally *zero* atmosphere, what these folks are doing *might* have some validity.
Otherwise they just pleasuring themselves.
What goes on is due to the ageing process of the stuff beneath their feet.
As it ages, it becomes ever more ‘fragile’, meaning that any one of a myriad of triggers will trip it into a different state.
Sometimes sunspots correspond with that change, sometimes planetary alignments, sometimes volcanoes & sometimes because its Friday, BUT, they are not *the* actual root cause of the observed changes.
The Sun is very simple compared to the complexity of the climate. To understand the effect of solar variability on climate we need a much better understanding of climate that we possess. Those denying that solar variability can have an important, even dominant, role on climate variability are rushing to a conclusion based on absence of evidence, not on evidence of absence. Indeed the evidence of such a role is increasing with time.
The most clear cycle in weather beyond the seasons is the Quasi-biennial oscillation (QBO). The evidence is very good that the QBO is under solar variability control. The evidence that ENSO is also affected by solar activity is increasing. ENSO is perhaps the most powerful weather oscillation in the planet. If solar variability can affect ENSO it can certainly affect climate.
And then we have the present extended solar minimum, that once more is coinciding with a cooling period. Since February 2016 the planet has lost over 0.2°C in yearly average temperature. One of the biggest drops in 70 years, that is continuing two and a half years after the El Niño ended. Solar activity is not expected to recover late 20th century levels until ~ 2035, so the cooling has plenty of room to continue. No doubt another explanation will be proposed by those that aren’t happy with the Sun ruling over climate.
Yes Javier. We have a long way to go.
Its all very interesting g but one thing puzzzels me, what causes the so called 11 year cycle.
Many years ago I read a book called “The Jupiter effect”. This stated that every 11 year s the planet Jupitor plus some other planets linme up, and their combined graveltational pull affect s the surface of the Sun. Is this one of the causes of varaable weather on E arth ?
MJE
Most solar physicists believe the 11-year cycle is caused by the chaotic behavior of the solar dynamo that generates the solar magnetic fields. Only a minority believes the frequency is externally imposed. Since we do not know what causes and determines the 11-year cycle, the question cannot be answered.
“Since we do not know what causes and determines the 11-year cycle”
We?
I do. The next two solar minima from the 2090’s and from 2200 are longer than Maunder.
meaningless way to far out into the future.
I wrote a criticism of “The Jupiter Effect”. It was published in the journal ‘Icarus’ of October 1975, pages 257-267.
~30 months is not climate. duh
Sure, but those 30 months show more cooling than any other period in the 21st century and have put the warming predicted by models to shame.
They are in a multidecadal category, and are the type of things that CO2-induced warming should make highly improbable. As the cooling continues it is a lot of fun to watch. Soon only cooling events in the early 50’s and 70’s will be comparable.
If a hot summer can be climate, why can’t 30 months be climate?
Direction … but just one hot day 🙂
“~30 months is not climate. duh”
Six months of news-worthy forest fires and the “experts” are sure that it is climate (change).
I thought the Sun was THE influence on climate. Without it we would have a very stable climate, too cold and dark for life as we know it.
I think you should say the Sun is the creator of our climate. But the discussions are always about the small changes in solar output and how much those small changes affect the climate.
Because the PDO/AMO/NAO ocean cycles will all be in their respective 30-year cool cycles from around the early 2020’s, which always leads to global cooling, (as occurred:1880~1913 & 1945~1978), combined with a 50~75 year Grand Solar Minimum (GSMIN), which starts at about the same time, CAGW advocates need to come up with excuses for the coming cooling.
Unfortunately, if they suddenly accept decreased sunspot activity causes more global cooling than their original assumptions, then also have to accept the Grand Solar Maximum (GSMAX) from 1933~1996 (the strongest in 11,400 years) had a larger warming effect than currently assumed.
It’s interesting to note that when the GSMAX ended in 1996, global temp trends flatlined (excluding the 2015/16 Super El Niño global temp spike), despite 30% of all manmade CO2 emissions since 1750 being made since 1996:
http://www.woodfortrees.org/plot/uah6/from:1996.6/to:2015.7/plot/uah6/from:1996.6/to:2015.7/trend/plot/esrl-co2/from:1996.6/to:2015.7/normalise/trend/plot/esrl-co2/from:1996.6/to:2015.7/normalise
CAGW advocates cannot explain the 20+ year hiatus we’re in, nor will they be able to explain the coming cooling from a GSMIN and 30-year Ocean cool cycles.
CAGW is at the beginning of its inglorious end.
“For example, how does Earth’s surface temperature change if it receives more or less heat from the Sun? ”
Not at all, the Earth’s surface temperature is controlled by the amount of CO2 in the air. The sun has nothing to do with it.
“…surface temperature is controlled by the amount of CO2 in the air” Shouldn’t we be wary of a welding tank containing pure CO2? Asking for a friend.
“The Sun has nothing to do with it.”
Oh, I think Milutin Milankovitch and several thousand climate and paleoclimate scientists around the world would respectfully disagree with that statement.
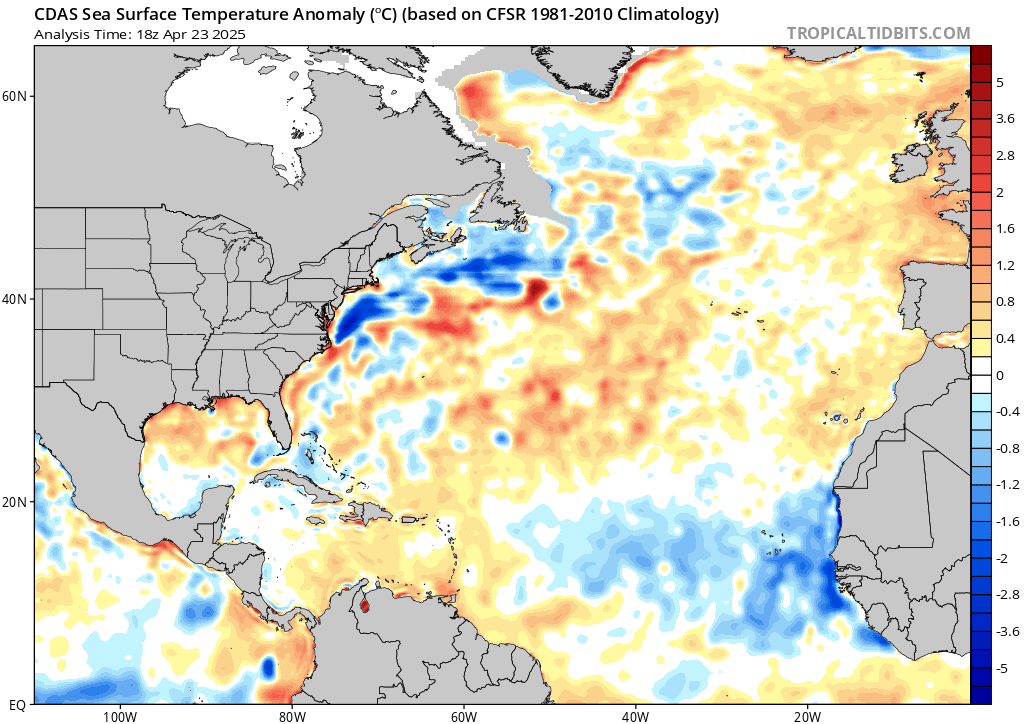
The temperature of the tropical Atlantic is still low.

The jumps in the speed of the solar wind cause the jet stream to fall in the eastern North Atlantic.
Because jet stream creates loops in the Atlantic, hurricanes from the Atlantic do not threaten North America.
Surely you jest.
Jet stream in the Pacific also falls in the North Eastern Pacific.
http://tropic.ssec.wisc.edu/real-time/mtpw2/product.php?color_type=tpw_nrl_colors&prod=epac×pan=24hrs&anim=html5
If they don’t know what’s important of the many parameters for first order effects, how can they instruct the model?
TSI, EUV spectral power flux, Kp index, GCR-neutron flux, … what is/are the dominant variable factors?
“how can they instruct the model”
While(grant$$>0){
alarm++
}
This basically states that “natural variation” is very high. But what drives the variation? Are we saying that climitate just changes? That implies no long term stable position, which wholly undermines the models. If the temperature without new forcing could be anything, then what can we say about the effects of a new forcing?
When I read “Towards …” in an academic’s product I am instantly reminded of Alan Sokal’s Towards a Transformative Hermeneutics of Quantum Gravity, and all that ensued.
Wait a second! I thought all of the climate models said the Sun’s influence on climate was negligible. Could the models be wrong! Say it ain’t so!!!
Rest assured the models are correct. They can predict with great certainty the temperature in 2100 to a 1/100th of a degree with only one input, the amount of CO2 burned. Ain’t science great?
Better modeling for the solar influence on atmospheric weather patterns at monthly scales could reveal the drivers of the ocean phases which rule the climatic modes. Without that influence there would have been no 1934, 1976, 2003, 2006, heatwaves, and neither most extreme winters, or much ENSO and AMO variability. No explanation for the noise means no explanation for climate. Most people are talking around the problem to be solved by talking about climate instead of the solar driven weather patterns that drives climate. As if all that variability was unforced.
https://www.americanthinker.com/articles/2010/02/the_hidden_flaw_in_greenhouse.html
Sometimes it pays to reread old passages.
“Consider too that since most air molecules are infrared-transparent, they can’t be heated by the infrared that CO2 and water vapor emit. This means that downward radiation from “greenhouse gases” can only explain how the earth’s surface might get warmer, not the rest of the atmosphere. This underscores, of course, how much the surface is heating this 99% by conduction and convection alone, since radiative transfer can’t do the job.”
The GHG theory is that N2 and O2 do not absorb IR very well . This is true. However the GHG theory goes on to say that if the CO2 concentration goes above 350ppm the extra CO2 will case more downward backward radiation and the troposphere will heat up with a continuous cycle of IR trapping by CO2 and then reradiating the photons back to the earth surface(losing 1/2 them upwards) to be reradiated back to the CO2 molecules and having the cycle continue until there are no more photons left to reradiate.
By that time the atmosphere near the earth surface (according to the alarmists ), has gotten hotter with all this photon activity. Of course every 14 hours of every day the sun comes back to recharge the surface with more radiation and the cycle starts all over again everywhere on earth. Eventually the atmosphere gets so hot that more water vapor evaporates and causes the photon cycle to be greatly expanded because now you have an even greater and more powerful GHG water vapour which reinforces the cycle.
However the flaw in this ; is the quote above. N2 an O2 cant be heated with IR. Since they make up 99% of the atmosphere how would the atmosphere get hot enough by CO2 alone? No matter how many times the IR gets recycled between the CO2 and the surface,the N2 AND O2 will not heat up with the IR . Only the sun ( and clouds at night ) can warm up the atmosphere to any appreciable degree. The alarmist is going to say that because of collisions between the O2 and N2 and between CO2 the photons get passed on that way. However for that theory to work they would have to say that water vapour through collisions cannot pass on the photons to N2 and O2 or else the global warming cycle would start with extra water vapour in a local area. If the CO2 does this through collisions the IR must be carried aloft to outer space and not cause the atmosphere to heat because the N2 and O2 outnumber the CO2 by a factor of 2500 to 1. So because CO2 is always cycling in and out of the atmosphere 225 GT carbon every year, and because it is outnumbered by 2500 to one by the N2 and the O2, AND 50 TO 1 BY WATER VAPOUR, there is not enough CO2 left at any one location or time period to affect the temperature of the surface air.
Around about the year 2000, most of the world got dumber for believing in this cockneyed GHG theory.
I get the impression that there is lots of confusion over WHAT is being energized.
The insides of a molecule can be energized, right? But the whole molecule, as part of a collection of molecules, can be energized too, no?
There’s stuff going on at the intra-molecular scale of reality, and stuff going on at the inter-molecular scale of reality. Am I correct in thinking that radiation is more directly an intra-molecular phenomenon, whereas heating is more of an inter-molecular phenomenon? And does the confusion happen in trying to decide how the intra-molecular energizing translates into the inter-molecular energizing?
A photon encounters a molecule, okay. Does the energy of that photon correspond, in a one-to-one fashion, to the energy that it imparts to the whole molecule that it encounters? I think that this is where the confusion and incorrect assumptions come into play. How do we know how the energy of the photon energizes the larger unit of the molecule it encounters? Does all that energy translate to kinetic energy that influences the temperature of a collection of molecules?
Can the energy that a photon imparts to a CO2 molecule energize the molecule in such a way that this CO2 molecule, in a collection of multiple thousands of molecules, imparts enough energy to the surrounding molecules to increase the kinetic energy of the whole collection of molecules, thus increasing temperature?
Answer to your last question: no.
The weather pattern in the Atlantic is very unusual. The extremely warm surface of the sea at the east coast can cause extreme weather in the northwest of the US. These can be heavy rainstorms.
northwest – or – northeast U.S.?
They’ll have to straight up admit that a good percentage of the heat on Earth is from electromagnetic induction due to the plasma solar wind spraying past us at 300-700km/s. Add to that the heat generated by Lunar gravity within the Earth’s core and you will dumbfound these warmist fools.
At a speed of over 500 km / s, it gets warmer.