
This article is part of a series on building a sample application — a multi-image gallery blog — for performance benchmarking and optimizations. (View the repo here.)
In this article, we’ll analyze our gallery application using the tools we explained in the previous guide, and we’ll look at possible ways to further improve its performance.
As per the previous post, please set up Ngrok and pipe to the locally hosted app through it, or host the app on a demo server of your own. This static URL will enable us to test our app with external tools like GTmetrix and Pingdom Tools.
We went and scanned our website with GTmetrix to see how we can improve it. We see that results, albeit not catastrophically bad, still have room for improvement.
The first tab — PageSpeed — contains a list of recommendations by Google. The first item under the PageSpeed tab — a warning about a consistent URL — pertains to our application outputting the images randomly, so that is an item we will skip. The next thing we can do something about is browser caching.
Browser Caching
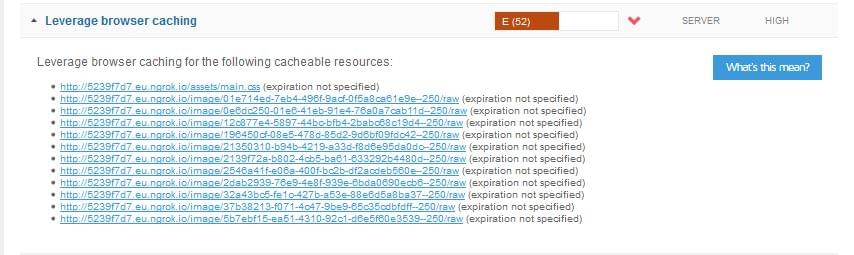
We see that there is a main.css file that needs its Expires headers set, and the images in the gallery need the same thing. Now, the first idea for these static files would be to set this in our Nginx configuration:
location ~* \.(?:ico|css|js|gif|jpe?g|png)$ {
    expires 14d;
}
We can simply put this inside our server block and leave it to Nginx, right?
Well, not really. This will take care of our static files, like CSS, but the /raw images we are being warned about aren’t really that static. So this snippet in our Nginx configuration won’t exactly fix this issue so easily. For our images, we have an actual controller that creates these on the fly, so it would be ideal if we could set our response headers right there, in the controller. For some reason, these weren’t being set properly by Glide.
Maybe we could set our Nginx directive in a way to include the raw resources, but we felt the controller approach to be more future-proof. This is because we aren’t sure what other content may end up with an raw suffix eventually — maybe some videos, or even audio files.
So, we opened /src/ImageController.php in our image gallery app, and dropped these two lines inside of our serveImageAction(), just before the line return $response:
// cache for 2 weeks
$response->setSharedMaxAge(1209600);
// (optional) set a custom Cache-Control directive
$response->headers->addCacheControlDirective('must-revalidate', true);
This will modify our dynamic image responses by adding the proper Cache Control and Expires headers.
Symfony has more comprehensive options for the caching of responses, as documented here.
Having restarted Nginx, we re-tested our app in GTmetrix, and lo and behold:

Compression
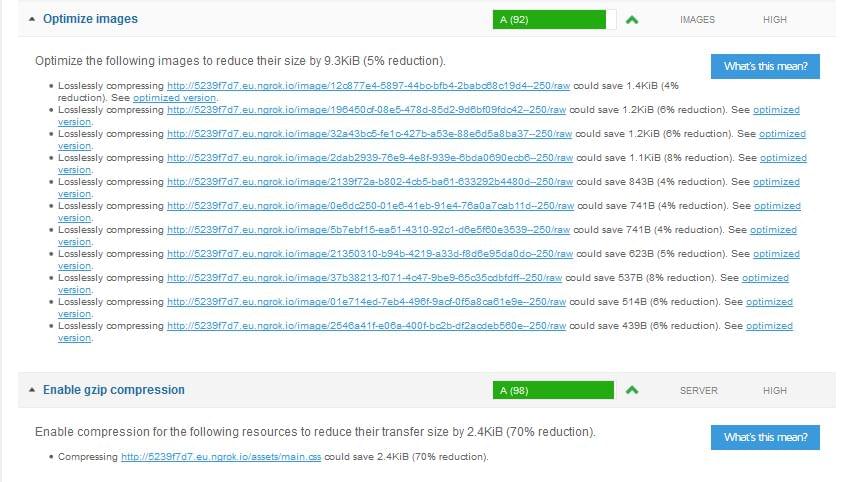
Next, GTmetrix gave us a warning about the size and compression of our resources:
In production, this is an insignificant thing, and improving on this wouldn’t make much of a difference in this particular case, with just a couple of kilobytes to spare. But, as these guides are here to show the way with other, more substantial applications, we’ll cover this improvement as well.
Images could be optimized in advance, but as these are dynamic images created with Glide, which we covered in another article, we won’t be doing that. In fact, Glide provides ways to set image quality. But sometimes we won’t be using Glide to handle our images, so we’ll first try another approach here.
Inside of our Nginx server block, we’ll add a couple of lines that instruct Nginx to compress our content:
gzip on;
gzip_disable "msie6";

gzip_vary on;
gzip_proxied any;
gzip_comp_level 9;
gzip_buffers 16 8k;
gzip_http_version 1.1;
gzip_types text/plain text/css application/json application/javascript text/xml application/xml application/xml+rss text/javascript image/jpeg;
An explanation of each of these settings would be out of the scope of this article. Each of these items is explained on the Nginx website, but one thing worth discussing is gzip_comp_level.
With compression, the common wisdom is that there’s a tradeoff. We gain some on network bandwidth, by making our files smaller, but then we lose some in our server CPU cycles required to gzip our resources on and on, on every request. Or as this Cloudflare blog post (which we’ll come back to later on) says:
There is a tradeoff between compression speed and transfer speed. It is only beneficial to increase your compression ratio if you can reduce the number of bytes you have to transfer faster than you would actually transfer them.
This is why people rarely set gzip_comp_level to the maximum 9, like we did. They usually settle for something like 6. This way, visitors still get compressed resources, but the CPU still isn’t being put under a big strain, especially during traffic spikes.
But we won’t follow this common advice for two reasons: first, in production, odds are we would be deploying our application on a CDN, which would remove the burden from our server altogether, and second, even if we don’t use a CDN, we will use page caching, so this gzipping done by our server will — hopefully — be done just once per resource. And, with our browser caching fully on, even these cached gzipped resources won’t be requested so often.
So, this is the rationale to set our gzip_comp_level to 9, but in case we don’t intend to use page/HTTP caching, we would probably set this to a smaller number.
By doing this, we were able to improve our gzip result:

We weren’t able to achieve the same improvement with our images, though. So, we went back to the Glide documentation and found how to control the quality of our images: inside our serveImageAction() inside our ImageController, we found the line:
$cachePath = $glide->getGlide()->makeImage($file, ['w' => $size]);
We added a quality argument to the makeImage() second array argument:
$cachePath = $glide->getGlide()->makeImage($file, ['w' => $size, 'q' => 60]);
We didn’t want to set the image quality lower than that, because it wouldn’t look good:

Then we deleted all the images in our /var/uploads/cache folder, and retested. Our results on GTmetrix showed we were able to improve by 5%:
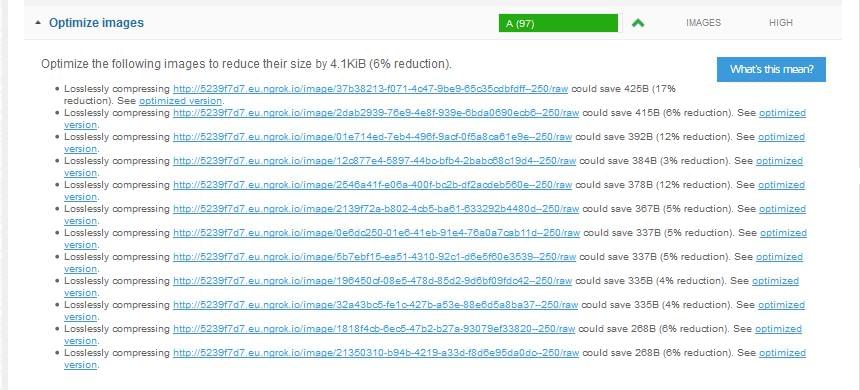
There’s still room for improvement, but in 99% cases, the steps we took to improve our images will be enough.
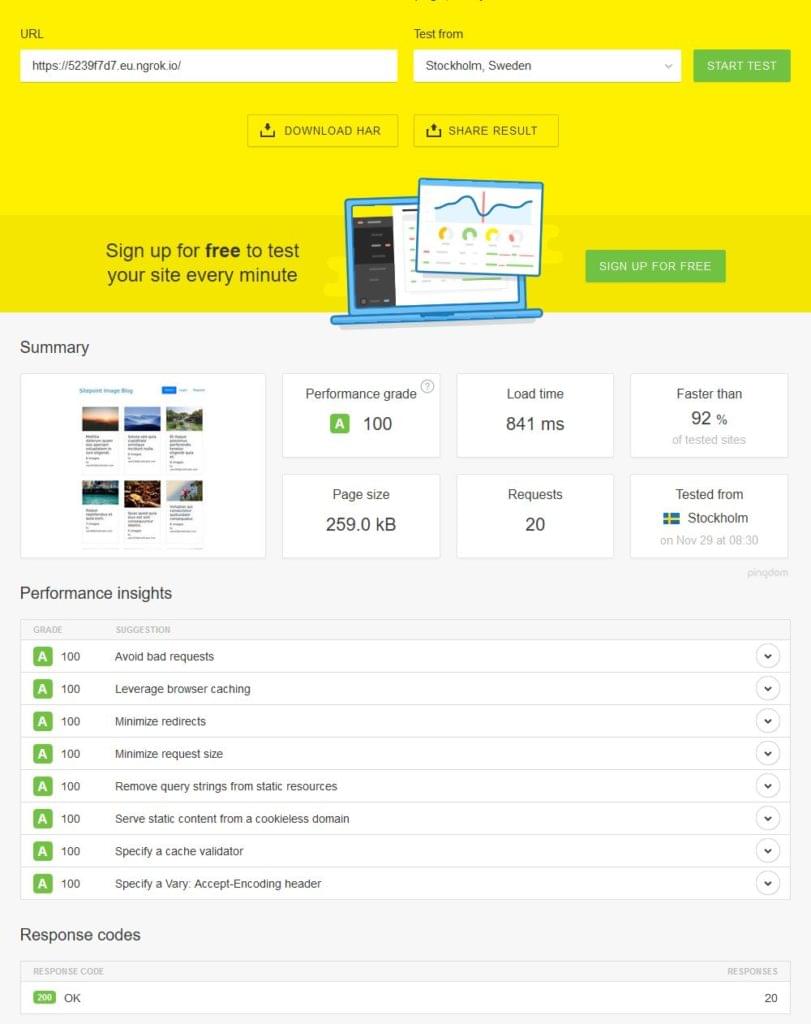
We also went to Pingdom Tools to check our website — and we were surprised to see that we got a 100% score. Although the page load time was still not what it should be, this was a significant improvement from the 92% score we got earlier:
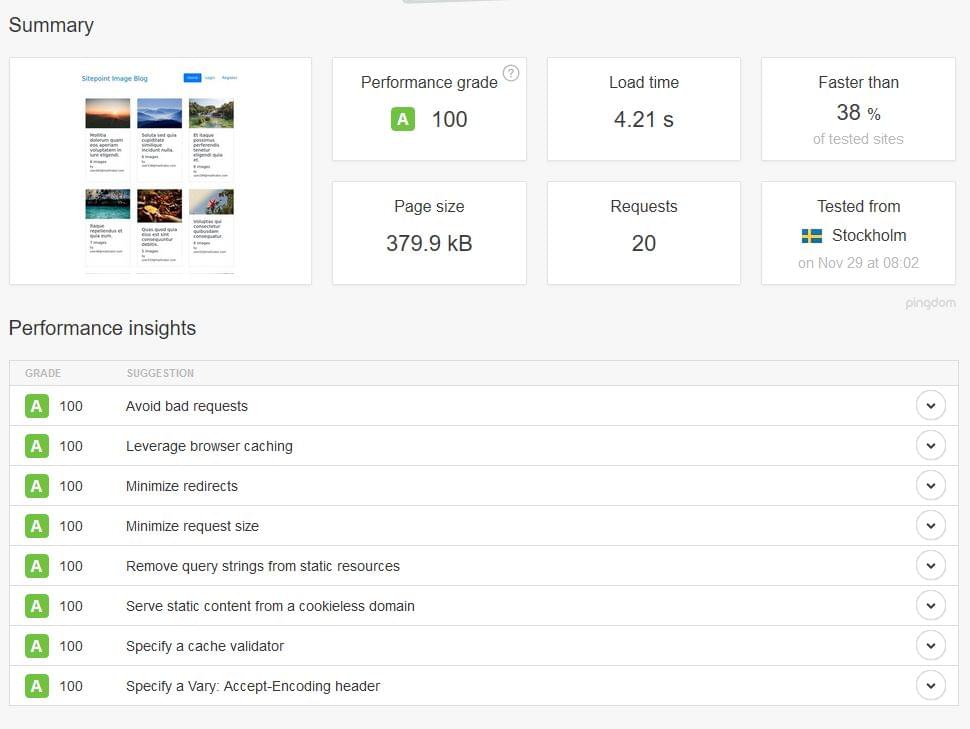
These recommendations are a useful guideline, but our 100% score would be a mere vanity metric if our load time were to remain at 4.21 seconds, so we turned on Nginx caching we wrote about in Server-side Optimization with Nginx and pm-static. With caching enabled, our result was now 100% across all metrics, and our load time below 1 second:
We are attaching a HAR file of this test.
Conclusion
Although we achieved 100 out of 100 with Pingdom Tools, there are metrics which are not 100% satisfied both on YSlow and PageSpeed (GTmetrix). However, these things are out of our hands — like the minification of resources (jQuery and Bootstrap) served by other CDNs. We could download and minify them, but it’s questionable how useful this would be considering most people already have them downloaded in their browser due to the resources’ widespread adoption.
There are things we didn’t cover in this article which would be recommended in production — or at least worth exploring — like Brotli compression. The people over at Cloudflare have written an interesting blog post about their results with this compression algorithm. As with all other things, before actual implementation it would be necessary to test it thoroughly on different kinds of resources and visitors’ connections. In our opinion, with HTTP caching enabled, even the CPU compression cost possibly incurred by high a compression ratio would still pay off, because it’s a one-time cost.
Nginx’s module for Brotli compression can be found here. This topic is further explored in this article.
If you know of any other improvements that could significantly impact performance, let us know!
Frequently Asked Questions (FAQs) about Performance Perception with Pingdom and GTmetrix
How can I improve my website’s performance using Pingdom and GTmetrix?
Both Pingdom and GTmetrix are powerful tools that can help you improve your website’s performance. They provide detailed insights into your website’s loading speed, performance grade, and other important metrics. To improve your website’s performance, you can use these tools to identify areas of your website that are slowing it down. This could be large images, unnecessary plugins, or inefficient code. Once you’ve identified these areas, you can take steps to optimize them, such as compressing images, removing unnecessary plugins, or cleaning up your code.
What is the difference between Pingdom and GTmetrix?
While both Pingdom and GTmetrix are performance monitoring tools, they have some differences. Pingdom focuses more on uptime monitoring and real user monitoring, while GTmetrix provides more detailed reports on page speed and performance. Both tools are useful, but depending on your needs, one may be more suitable than the other.
How can I interpret the results from Pingdom and GTmetrix?
Both Pingdom and GTmetrix provide a wealth of information about your website’s performance. The key is to understand what each metric means. For example, the performance grade in Pingdom is a score out of 100 that indicates how well your website is optimized. In GTmetrix, the PageSpeed Score and YSlow Score are similar metrics. The load time is the total time it takes for your website to load, and the faster the better. The page size is the total size of your website, and smaller is generally better.
How can I use Pingdom and GTmetrix to monitor my website’s performance over time?
Both Pingdom and GTmetrix allow you to set up regular monitoring of your website. This means that they will automatically check your website’s performance at regular intervals and provide you with reports. This can help you identify any changes in performance over time and take action if necessary.
Can I use Pingdom and GTmetrix to monitor the performance of my competitors’ websites?
Yes, you can use both Pingdom and GTmetrix to monitor the performance of any website, including your competitors’. This can give you valuable insights into how your website compares to others in your industry and help you identify areas where you can improve.
How can I optimize my website’s performance based on the results from Pingdom and GTmetrix?
Once you’ve identified areas of your website that need improvement, you can take steps to optimize them. This could include compressing images, removing unnecessary plugins, cleaning up your code, or optimizing your server configuration. Both Pingdom and GTmetrix provide recommendations on how to improve your website’s performance based on their analysis.
Are there any limitations to using Pingdom and GTmetrix?
While both Pingdom and GTmetrix are powerful tools, they do have some limitations. For example, they may not be able to fully analyze websites that use certain technologies, such as AJAX or Flash. Additionally, they may not always provide a complete picture of your website’s performance, as they primarily focus on front-end performance.
Can I use Pingdom and GTmetrix to improve my website’s SEO?
Yes, improving your website’s performance can have a positive impact on your SEO. Search engines like Google take page speed into account when ranking websites, so optimizing your website’s performance can help improve your search engine rankings.
How often should I check my website’s performance with Pingdom and GTmetrix?
It’s a good idea to check your website’s performance regularly. How often you should check will depend on your specific needs, but as a general rule, checking once a week or once a month should be sufficient for most websites.
Are there any alternatives to Pingdom and GTmetrix?
Yes, there are many other performance monitoring tools available, such as Google PageSpeed Insights, WebPageTest, and YSlow. Each tool has its own strengths and weaknesses, so it’s a good idea to try out a few different ones to see which one works best for you.
 Tonino Jankov
Tonino is a web developer and IT consultant who's dived through open-source code for over a decade. He's also a crypto enthusiast, Linux fan, and moderate libertarian.