In this blogpost from a few years ago, we looked at the relationship between early literacy outcomes and attainment in GCSE English language.
We’re going to update that work in this post. Alongside, we are publishing some area-level statistics that show how pupils with lower levels of early literacy are distributed across the country.
The relationship between early literacy outcomes and GCSE English
For this post, we are going to use GCSE English language results from 2018 for pupils in state-funded schools (mainstream and special), linked to the Key Stage 1 reading and writing results of these pupils.
These pupils would have been assessed at KS1 using the former national curriculum Levels. As in our previous post, we’re going to use a scoring system to convert reading and writing Levels into a combined literacy score – see below.[1]
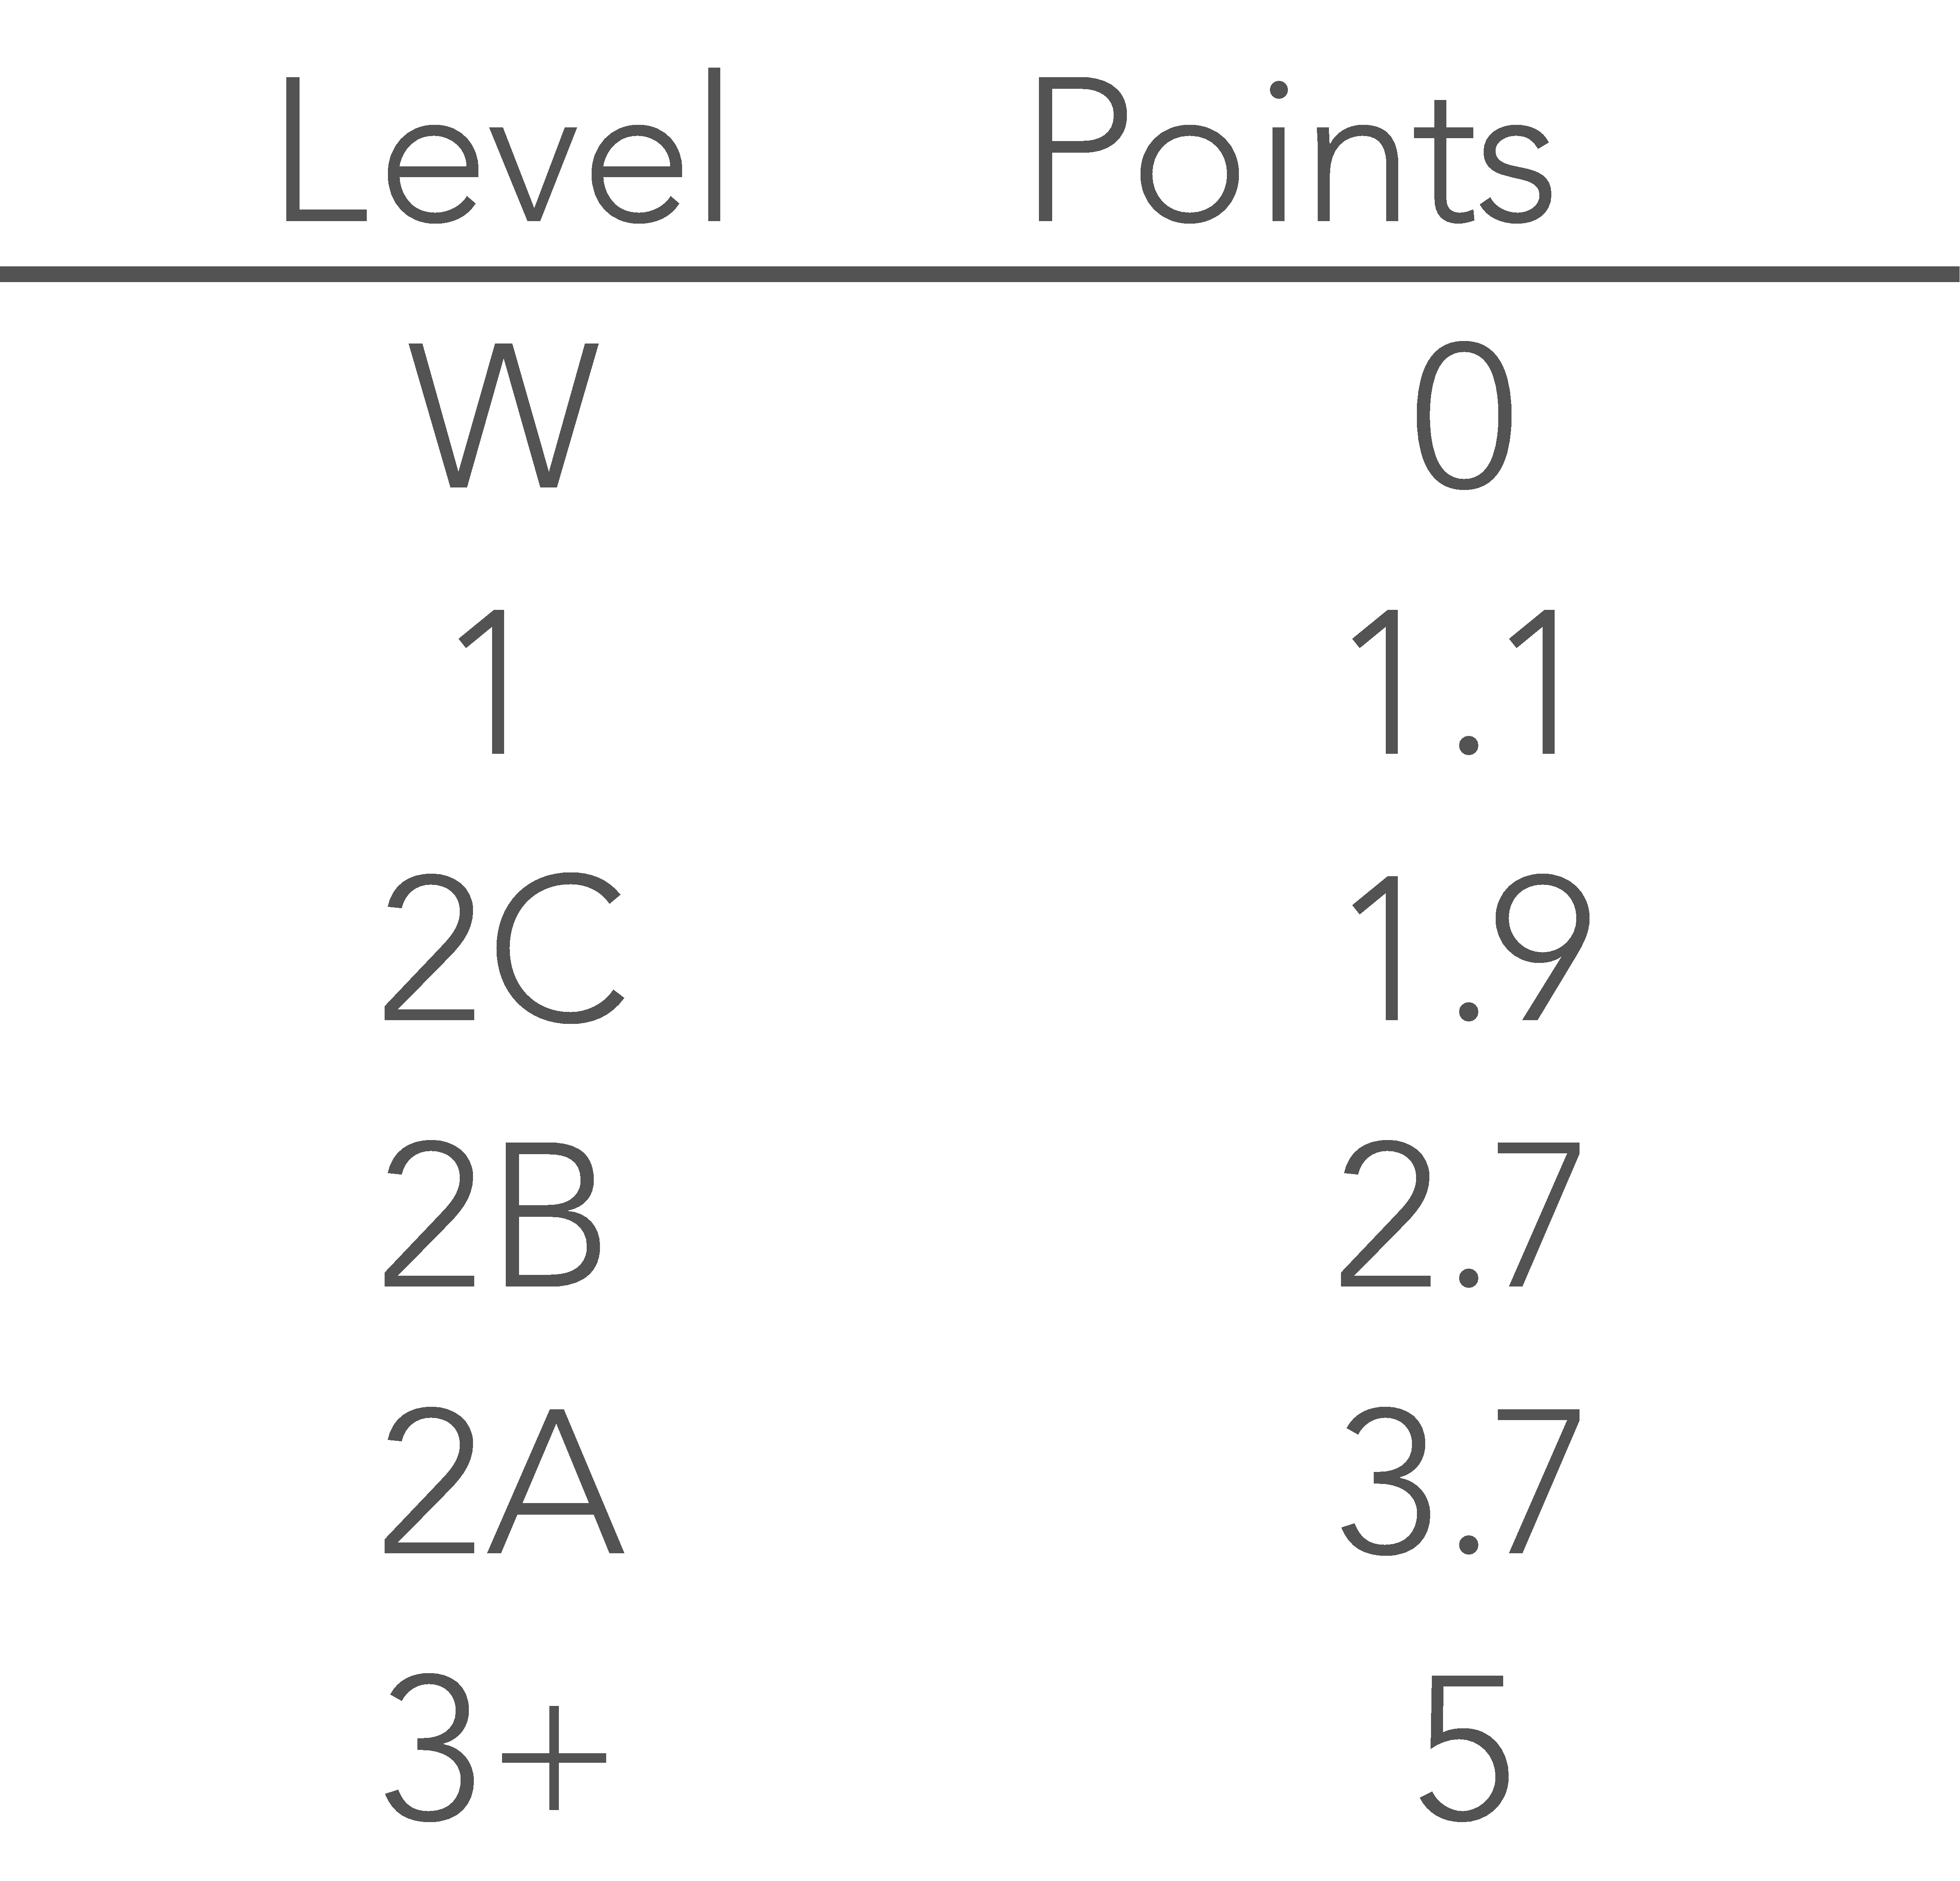
The scoring system used here differs from that in the previous work. Prior to 2015, KS1 outcomes were based on Levels; from 2015 onwards they are based on teacher assessment frameworks. The scoring system used here aims to create a common scale for old and new KS1 assessments based on the percentage of pupils at each level/grade.
The chart below shows how the percentage of pupils achieving grade 4 or higher (and grade 5 or higher) in GCSE English increases with respect to these Key Stage 1 literacy scores. Overall, 70% of the cohort for whom Key Stage 1 results are available achieved grade 4 or higher.
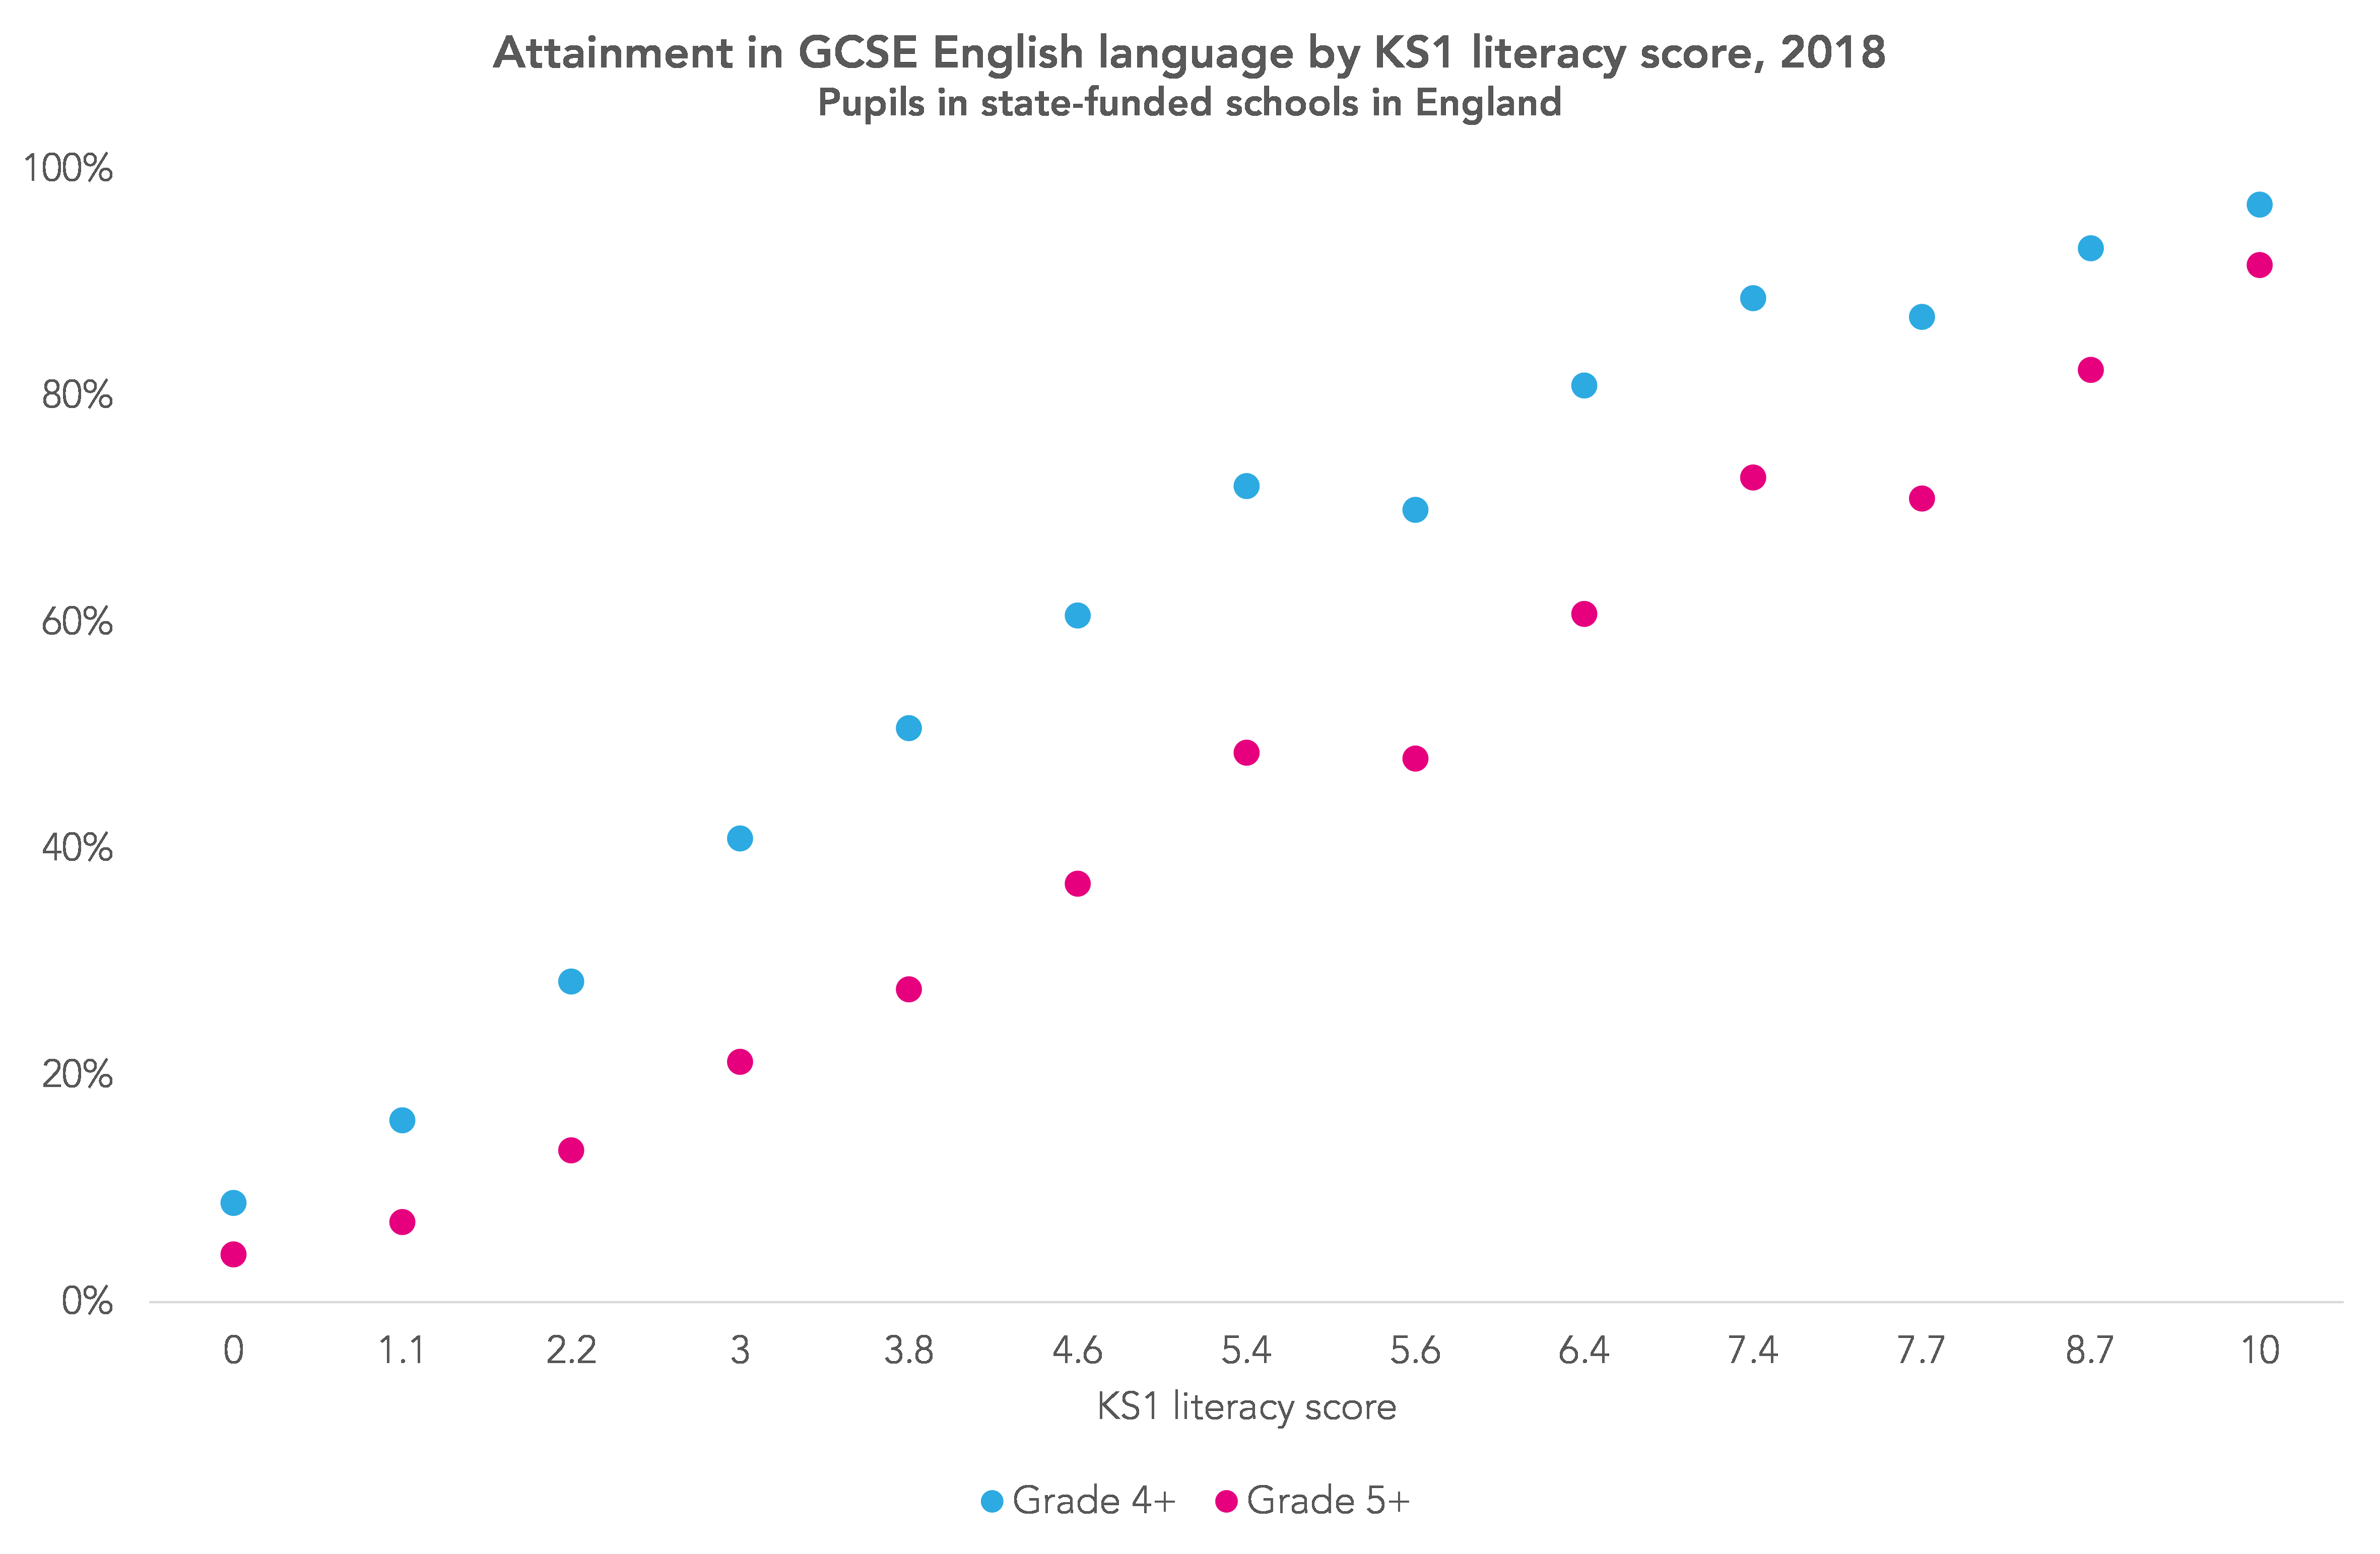
A total of 72% of pupils with a score of 5.4 at Key Stage 1 (Level 2B in reading and writing) went on to achieve grade 4 or higher and 49% grade 5 or higher.
Interestingly, it seems that pupils who scored 7.4 (Level 2A in reading and writing) achieved slightly higher GCSE outcomes than those who scored 7.7 (one Level 3 and one Level 2B).
Although there is a relationship between Key Stage 1 and GCSE outcomes, it does not imply that a pupil’s chances of GCSE success are pre-determined by their Key Stage 1 outcomes. There were pupils working at Level 1 or below at Key Stage 1 who went on to achieve grade 5 or higher.
The relationship with pupil characteristics
As you might expect, pupil characteristics such as gender, disadvantage and first language interact with each other and with prior attainment to influence GCSE outcomes.
The chart below compares the GCSE English attainment of eight different groups of pupils based on gender, disadvantage[2] and first language[3].
For the same KS1 score, attainment at KS4 varies substantially for pupils with different characteristics.
For example, among the group of pupils who achieved an early literacy score of 5.4, the percentage achieving grade 4 or higher in English at KS4 varies from 51% (disadvantaged, non-EAL boys) to nearly 90% (non-disadvantaged, EAL girls).
Because more than half of pupils with a literacy score above five at Key Stage 1 go on to achieve grade 4 or above at GCSE, we define an early literacy score of five or higher as a key threshold for future success in GCSE English that is applicable to all groups.[4]
Recent improvements in Key Stage 1 outcomes
Now let’s fast-forward to more recent cohorts: those assessed at Key Stage 1 between 2017 and 2019.
These pupils were assessed using the new teacher assessment frameworks. These are not directly comparable to the old national curriculum Levels but we have done a rough approximation.[5]
The chart below shows the percentage of pupils who achieved the key threshold of five points in early literacy between 2014 and 2019. This period covers the shift from Levels to the new frameworks in 2016.
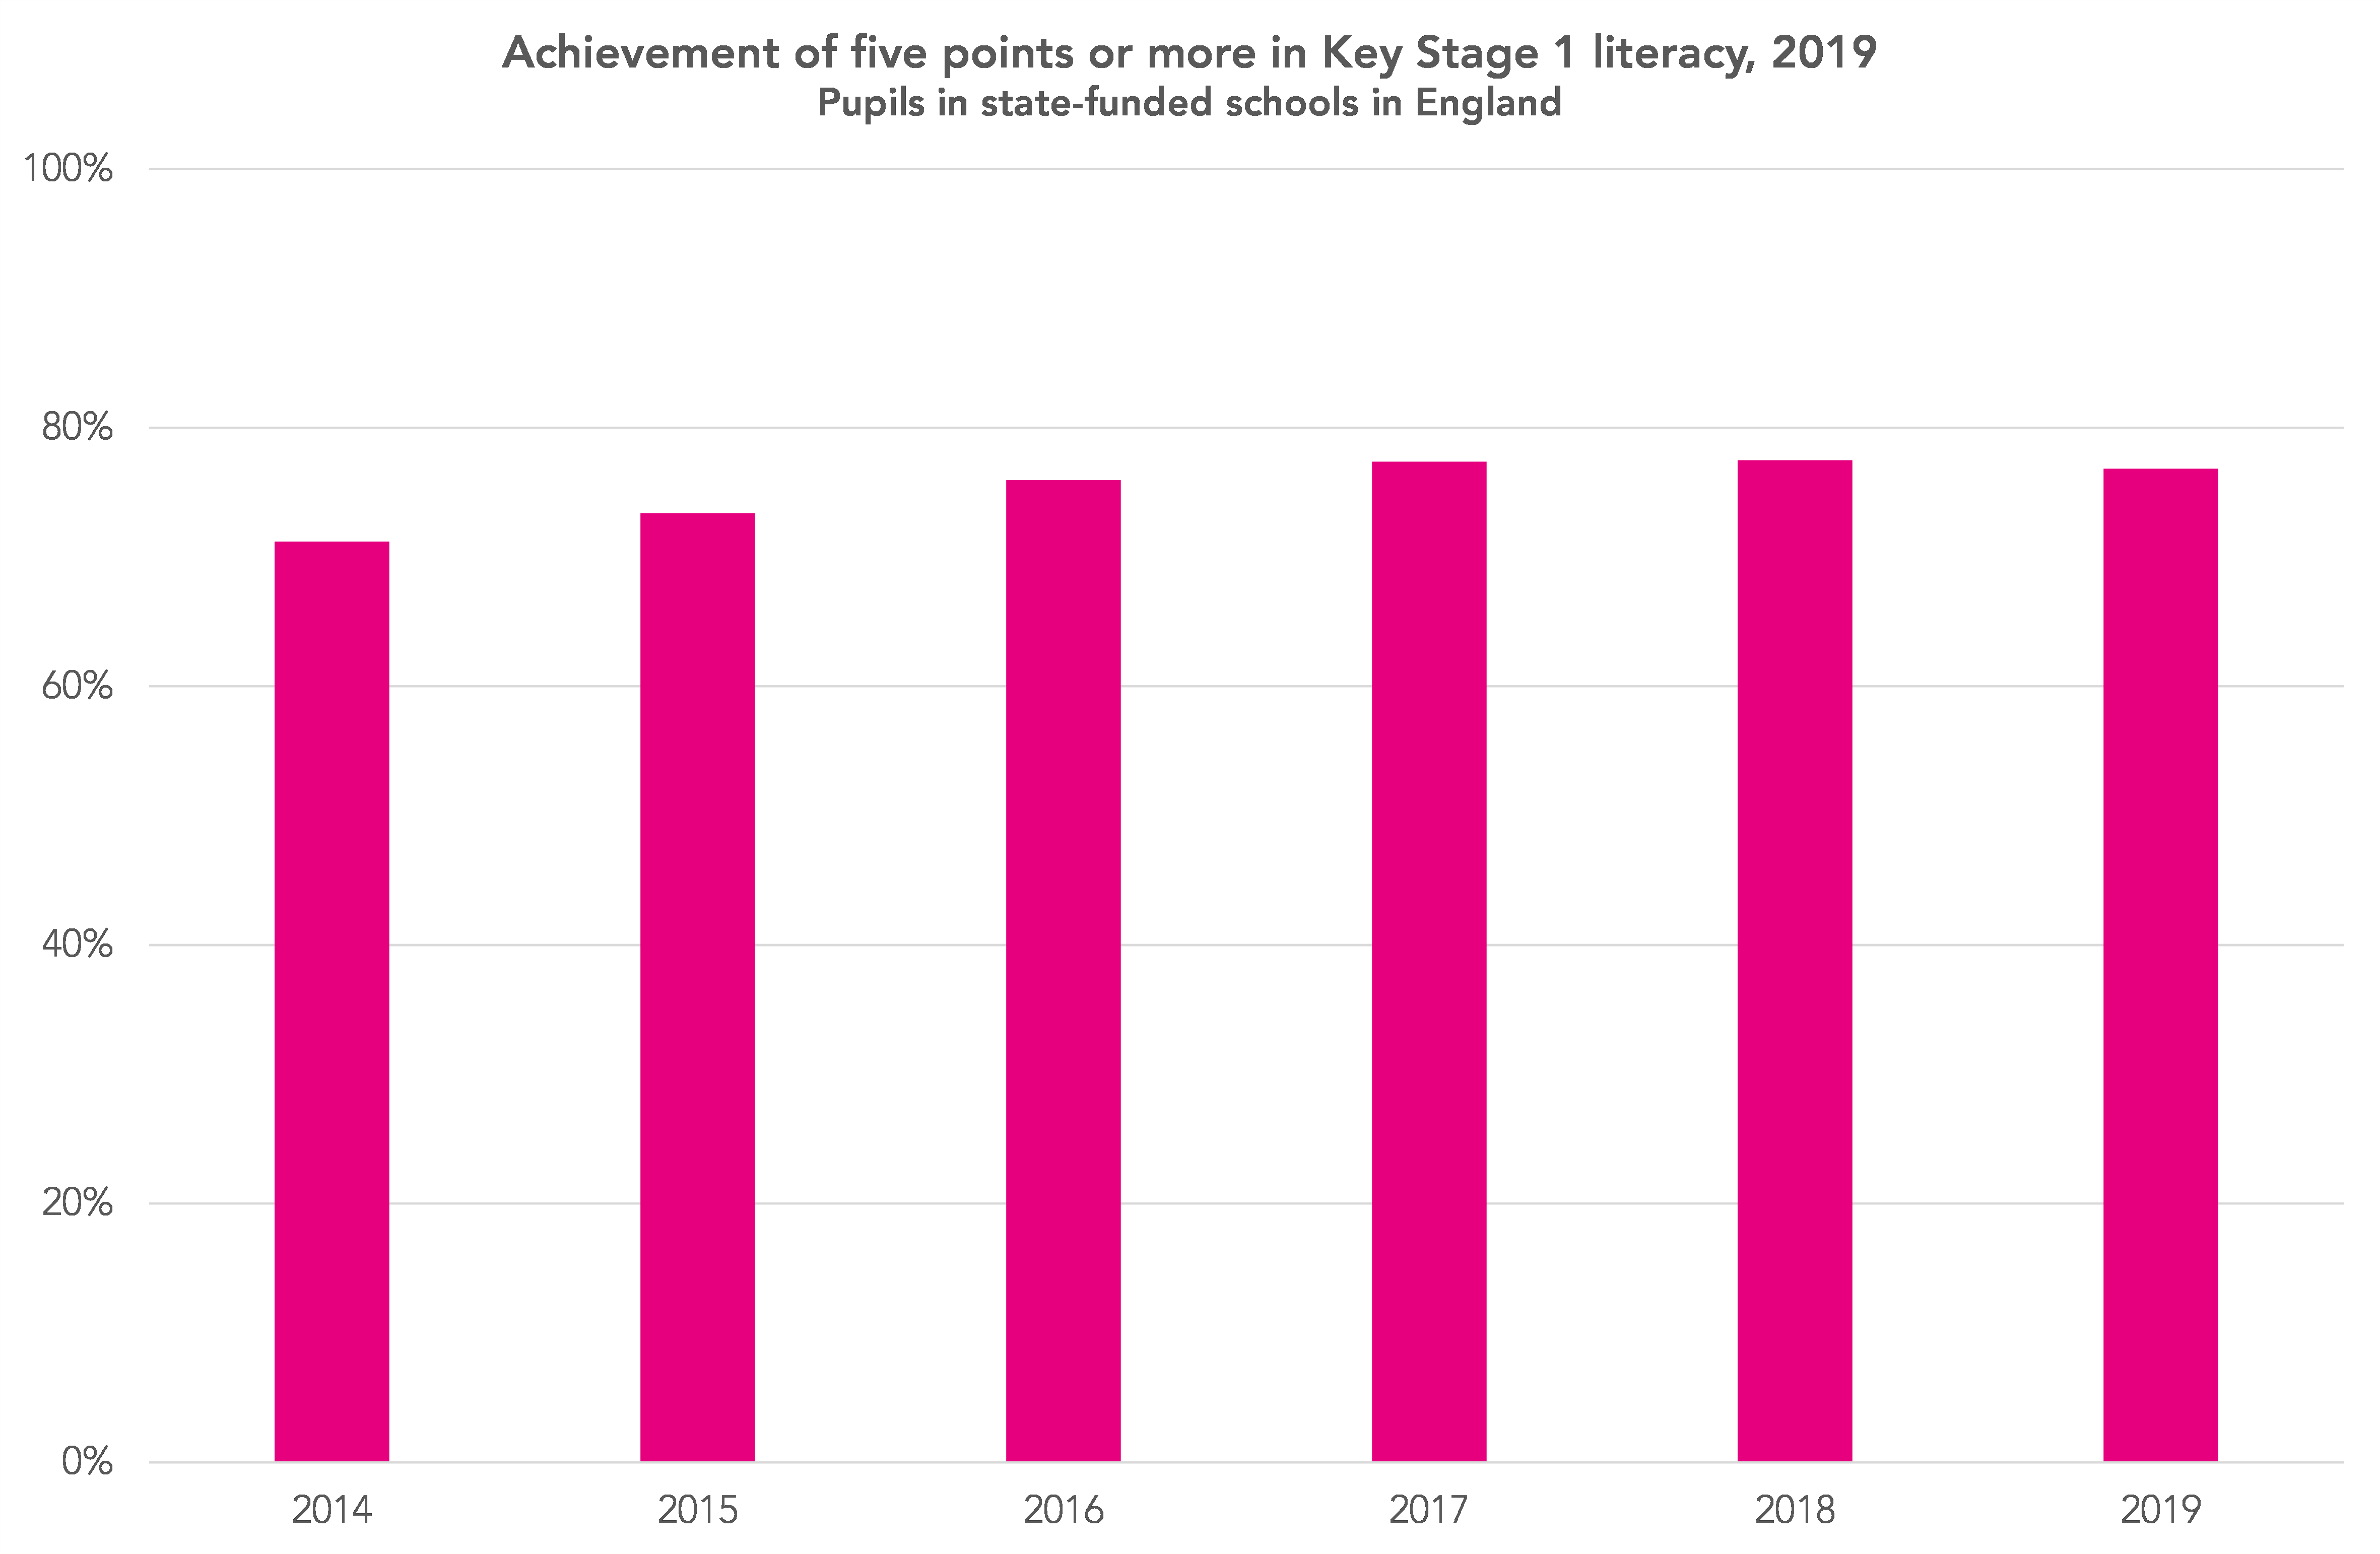
In general, we see slight increases in the percentage meeting the early literacy threshold, from 71% in 2014 to 77% in 2019.
As we set out in this blogpost, we might expect this increase in early literacy to result in improved GCSE outcomes in the future.
The geography of early literacy
So where do we find pupils who might benefit from additional support to boost their early literacy skills? (It’s worth emphasising that the gaps in literacy we’re talking about here are those that were in existence even before the pandemic.)
The short answer is everywhere.
Alongside this blogpost, we’re publishing a workbook of local area statistics – available here. It shows the percentage of pupils who have fallen below the early literacy threshold of five points for the last three years, at both local authority-level (based on school location) and parliamentary constituency-level (based on pupil residence).
The workbook also includes figures on how many pupils we would expect to be below the literacy threshold in each area, based on pupil characteristics [6].
Of course, some areas (and some schools) have proportionately more pupils below the early literacy threshold.
In the table below, we’ve categorised schools into five bands based on the percentage of their pupils eligible for free school meals, showing for each of these bands the share of pupils below our early literacy threshold.
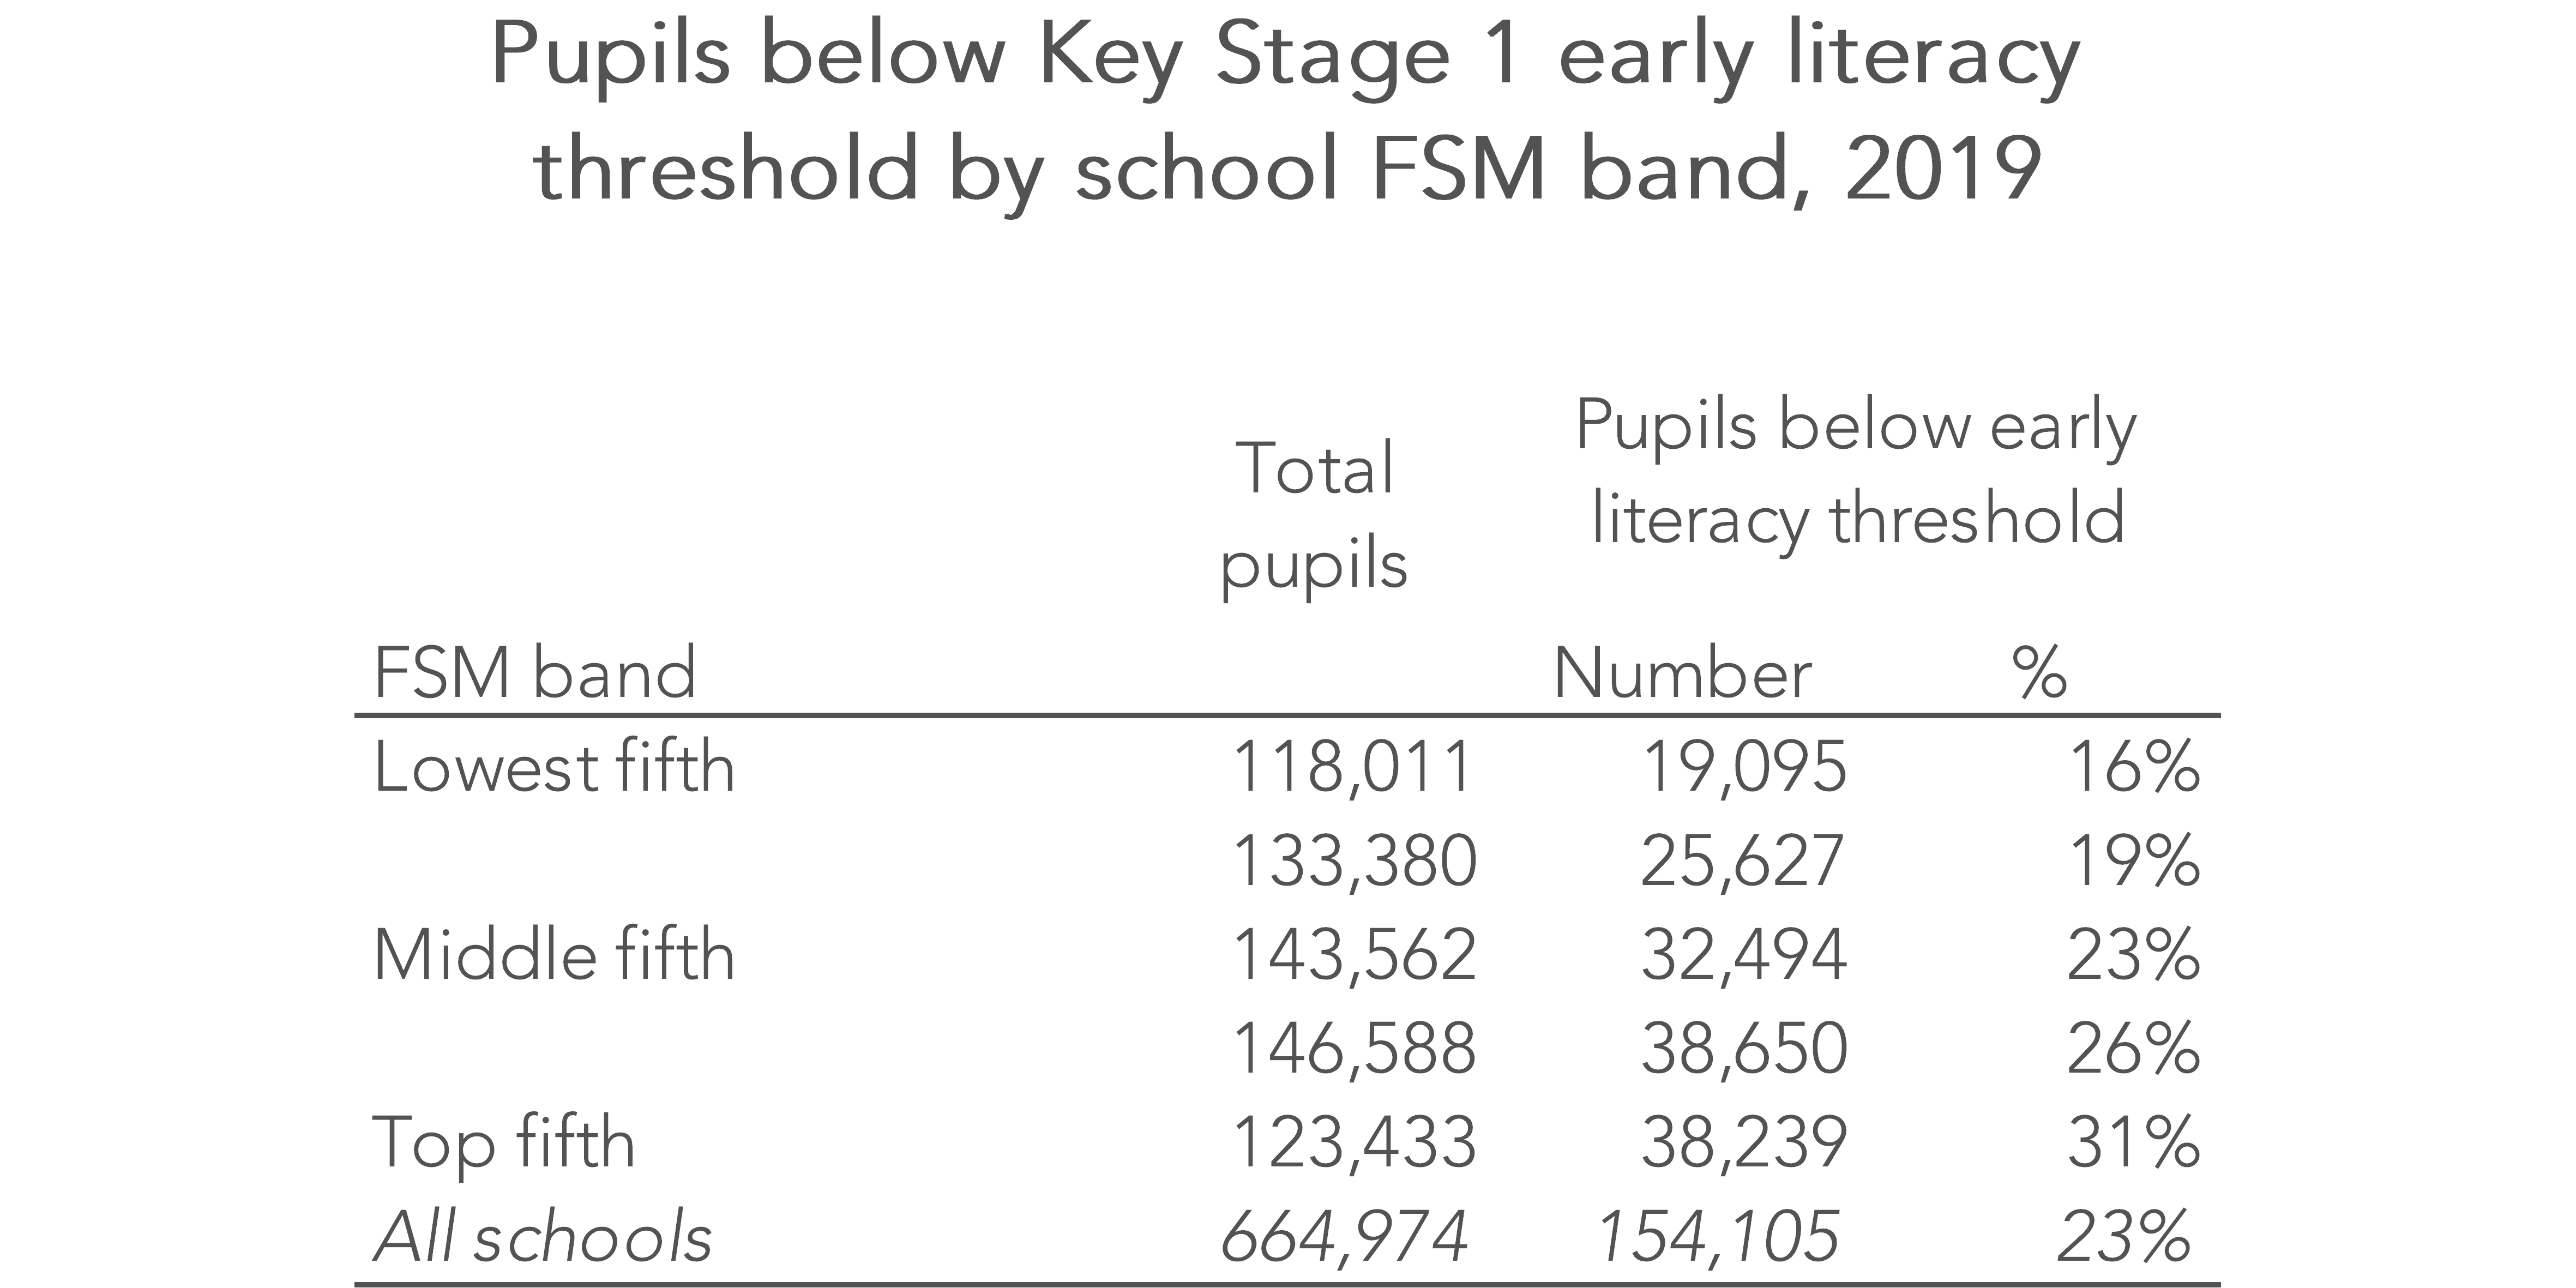
As we would be expected, there are proportionately more pupils below the early literacy threshold in schools in the most disadvantaged fifth. However, there were almost 20,000 such pupils in schools in the least disadvantaged fifth; almost one-eighth of the national total.
Summing up
Would we expect policies, strategies and programmes to improve children’s early literacy to improve GCSE outcomes in the future?
This all depends on how rigidly Ofqual, the exams regulator, applies the policy of ‘comparable outcomes’ to maintain standards over time.
In theory, comparable outcomes takes account of statistical moderation plus other evidence of improved standards over time.
In principle then, we should not necessarily assume that a third of the cohort will “fail” to achieve grade 4, as is currently the case, and therefore it is not unrealistic to expect GCSE English attainment to improve in future if early literacy improves.
In any event, improving GCSE outcomes is not the only reason to improve children’s early literacy skills.
Want to stay up-to-date with the latest research from FFT Education Datalab? Sign up to Datalab’s mailing list to get notifications about new blogposts, or to receive the team’s half-termly newsletter.
- We only include pupils who have results in both reading and writing.
- We use the DfE measure of disadvantage – being eligible for free school meals in the six years up to the end of Key Stage 4.
- We use EAL status at the end of Year 11. See this blogpost for some limitations of this measure.
- This is a slightly higher bar than we used in our previous blogpost. Under the old scoring system, pupils with Level 2C and Level 2B in reading and writing would have been classified as having met the early literacy threshold, but as a consequence of the rescaling process to align old and new Key Stage 1 teacher assessments they now fall just below it, with a score of 4.6.
- Points under our literacy scoring system are: BLW = 0; PKF = 0.9; WTS = 1.9; EXS = 3.3; GDS = 5.0
- We use a contextualisation model controlling for: age, gender, ethnicity, whether a pupil has English as an additional language, disadvantage (measured by the length of their school career for which pupils were eligible for free schools meals, and IDACI), school type, the proportion of EAL pupils in a school, the proportion of disadvantaged pupils in a school (measured by eligibility of free school meals and IDACI) and interactions between these factors.


Very interesting. Could you explain more about the basis on which you assigned the point scores to the KS1 with and without levels? Of particular interest as we are still waiting to hear about VA progress and whether it will remain and how it will be calculated for children without KS1 levels.
Hi Sue, thanks for your comment – it’s based on an attempt to get a reasonable marrying up of results pre- and post-Levels. Regarding KS2 value added, if you haven’t come across it already you might find this post of interest: https://ffteducationdatalab.org.uk/2019/05/how-will-ks2-value-added-be-calculated-next-year/
Again shows how more funding and resources are needed in the foundation years, particularly for those key groups.