

Translated and introduced by Sachie Mizohata
Japan was known as the home of a strong middle-class in the affluent 1980s, the fruits of its prosperous economy distributed more equitably than in many comparable high-income countries. Yet strictly speaking, contrary to popular perception, Japan was not that “egalitarian.” However, public credence was set and the Wall Street Journal (1989) to tellingly (if hyperbolically) characterize this secure society with impressive equality and principled values as “the only communist nation that works.”1 Then, sea changes followed.
This once “egalitarian” society is now widely (not least in Japan) recognized as a kakusa shakai(unequal society) in which income and wealth have become more unequally distributed than in many advanced economies.2 While widening wealth gap between rich and poor is a global trend as shown in the graph by Thomas Piketty and his co-researchers (Figure 1.1), in the case of Japan, in recent decades this has been accompanied by economic stagnation, rising levels of poverty, precarity, and public debt grafted on top of population aging.3 Against these backdrops, the second Abe Shinzō government started its economic policies, proclaimed as Abenomics, in an effort “to sustainably revive the Japanese economy” that was promised to trickle-down to all.4 Five years on, evaluations have taken place on the Abe program centered on hyper monetary easing, fiscal stimuli, and structural reform.
Fig. 1.1 – The elephant curve of global inequality and growth, 1980-2016

Source: World Inequality Lab, 2017 – creative commons licence 4.0 – cc by-nc-sa 4.0
This article introduces data and assessment by Inoue Shin of the Japan Federation of National Service Employees who “visually” presents some of the key facts and figures of Abenomics with regard to the working poor, real wages, labor share, and more, drawing primarily on government documents. In January 2018, the Cabinet Office updated a report that claims exceptional progress in light of nominal GDP, corporate profits, number of employed persons, and tax revenue.5 If, however, evaluation is based on targets determined by policy makers and experts in the international community (particularly the United Nations), Abenomics falls rather short of progress towards shared prosperity. As Joseph E. Stiglitz and others warn in the Stockholm Statement6: “GDP growth is not an end in itself,” “but a means to creating the resources needed to achieve a range of societal objectives, which include improved health, education, employment, security, as well as consumption.”7
Some critical points are worth elaborating.
First, the Cabinet Office claims that the Japanese economy is presently experiencing the country’s second-longest postwar boom8 with a record-high of ¥56 trillion rise in nominal GDP (i.e. not per capita GDP). Although the report specifies no time period in the text, the rise has occurred as displayed in the graph presumably from ¥493 trillion in 2012 to ¥549 trillion in 2017.9 To achieve these results, the Cabinet Office adopted a new method of how to measure GDP data in December 2016, thereby making upward revision and entailing retroactive revisions in official documents.10 What is clear, however, is that whatever the expansion in GDP, this has not translated into better lives for most Japanese. In recent opinion polls, a large majority of respondents (82%) report that they have experienced no benefit from Abenomics or economic recovery.11 A Ministry survey of Japanese households (2014) indicates that 62.4% of people perceived their living conditions as “difficult,” whereas over half of respondents twenty years ago reported it to be “normal.”12
As for the latest data on an important GDP component, “personal consumption, which accounts for 60 percent of GDP, declined by 0.5 percent.”13 At the household level, consumption expenditure continues to decline and, in 2016, fell to the lowest level in 35 years, marking the sharpest drop, despite long-running growth (Figure 2.6). Most striking is the fact that the so-called poverty line14(half the median income of the total population) has steadily declined, this at a time when it has risen for Canada, France, Germany, Italy, UK, and USA.15 Japan’s poverty line was ¥1.49 million in 1997, ¥1.30 million in 2003, ¥1.25 million in 2009, and ¥1.22 million in 2015.16
Stated differently, the Japanese as a whole are becoming poorer, and the real standard of living has declined in recent years. To make a bad situation worse, spending cuts in social welfare, especially livelihood assistance for the poor since 2013 (slashed by up to 13.7%), amplifies unequal distribution of welfare.17 In short, it is evident that Abenomics has not improved the livelihood of the people.
Second, according to the Cabinet report, corporate profits reached a record-high increase of ¥26.5 trillion from ¥48.5 trillion in 2012 to ¥75.0 trillion in 2016.18 In sharp contrast to soaring retained earnings and corporate profits rewarding those at the top (Figure 2.4), Japanese workers’ earnings, in nominal terms, declined by ¥160,000 from ¥4.08 million in 2012 to ¥3.92 million in 2016 (Figure 2.2). Simultaneously, with the upward trend in corporate profits since 2001, there has been a continuous downward trend in the real salaries/wages index since 1997 when it reached its peak. This reveals the increase in returns to capital and the declining share of national income allocated to labor (Figure 2.4). In fact, a decline in the labor share has occurred in the vast majority of Organisation for Economic Co-Operation and Development (OECD) countries. “The OECD (2012) has observed, for example, that over the period from 1990 to 2009 the share of labour compensation in national income declined in 26 out of 30 advanced countries for which data were available, and calculated that the median (adjusted) labour share of national income across these countries fell from 66.1 per cent to 61.7 per cent.”19 As for Japan, economist Mizuno Kazuo points out that labor’s share of Gross National Income (GNI) declined from 46.5% GNI in Fiscal Year (FY) 1980 to 40.5% GNI in FY 2015.20
This indicates a shift in the share of national income from labor to capital. The estimated “lost wages” of workers, according to Mizuno, amounts to as much as ¥200 trillion over the same period.21 This is among the largest declines in real wages in the OECD countries. As reported, “Japan is one of only two OECD countries, along with Israel, where the lowest income decile has suffered an absolute decline in their real income since the mid-1980s.”22 The country’s share of labor costs in total labor and capital costs remains the lowest among OECD countries (2016).23
In addition, the number of wealthy households (with financial assets of ¥100 million or more) has increased by about 21% from 2013 to 2015. In 2015, 1.22 million households had total net financial assets of ¥271 trillion.24 The gap between small and medium-sized businesses (SMBs) and large businesses also widened rapidly since 2013, despite the widely touted trickle-down effect. The difference in the total amount of ordinary income between SMBs and large businesses increased to a record-high of ¥19 trillion in 2015.25 In sum, these outcomes reveal distributional consequences of Abenomics, simultaneously producing economic disparity and precarity (as seen below).26
Third, the Cabinet Office estimates that the number of employed persons has increased by 1.9 million (including 1.5 million women workers), thanks to Abe’s pro-growth policies.27 However, a Health Ministry survey shows that the main increase lies in irregular workers (2.07 million) from 2012 to 2016, compared to regular workers (220,000).28 The increased numbers of employees has not coincided with better-paying positions or greater security. To the contrary, low-paid irregular workers account for nearly 40% of the entire labor force in 2017 (compared with 15.3% in 1984 before deregulation),29 while Japan’s minimum wage is the lowest among 19 advanced economies: ¥798 per hour (on average for FY 2016).30 (Note that irregular workers, like those defined by British economist Guy Standing, can be classified as the precariat, workers in precarious employment: low-end incomes without job security and benefits.31)
In 2016, on average irregular workers earned ¥315 million (35.3%) less than regular workers: ¥172 million compared to ¥487 million. At the same time, the wage gap between irregular workers and regular workers increased, on average, by ¥15,000 from 2012 to 2016. Moreover, the number of the working poor (those who earn less than ¥2 million a year) increased from 10.9 million in 2012 to 11.32 million in 2016 (Figure 2.3).32The majority of irregular workers are women (379,000 women out of 423,000) who earned ¥241 million less than men on average in 2016: ¥280 million compared to ¥521 million. Six out of ten women workers are irregular workers. In terms of a gendered wage disparity, Japan ranks second among OECD members, behind South Korea.33
This directly contradicts the signature Abe slogan of Womenomics, giving the lie to Abenomics’ claim to foster gender equality. Note that the World Economic Forum’s Global Gender Gap Report ranked Japan 114th in 2017, the worst ever, having fallen from 111th in 2016 and 80th in 2006.34Incidentally, Japan’s karoshi (death from overwork)-prone culture has become far more pronounced under Abenomics labor reform. Karoshi, which is directly attributable to long working hours and work pressure, applies to both women and men and imposes additional precarity risks (Figure 2.7).
Fourth, the Cabinet report documents that Abenomics increased tax revenue by ¥15.4 trillion from ¥42.3 trillion in 2012 to ¥57.7 trillion in 2017 despite corporate tax rate reduction (see Figure 2.5).35 “Since [PM Abe] came to power, the overall effective corporate tax rate in Japan has fallen from 37% to 29.97%. In fiscal 2018, which begins [this] April, the rate is slated to decline to 29.74%.”36 Tomioka Yukio, emeritus professor of Chuo University, points out that Japan’s effective corporate tax rate (taken as the average rate at which a business is taxed on earned income) appears to be above the averages (as of 2014) 17% in Singapore, 23% in the UK, and 24.2% in the special district of Seoul, South Korea. This does not, however, mean that corporations actually pay at these levels.
Tomioka discusses large corporate tax avoidance, in which many corporations pay typically around 20%, and some even as low as 1%. For example, the effective corporate tax rate (as of 2014) was 0.001% for Sumitomo Mitsui Financial Group, 0.003% for SoftBank, and 6.91% for Fast Retailing, otherwise known for Uniqlo.37 Osawa Mari of the University of Tokyo notes that Japan’s distributions of tax burdens and tax benefits are the least progressive among the OECD. In other words, government transfers, which are normally redistributed to low-income groups through social security benefits, work in reverse.38 By contrast, at least until the late 80s, Japan, like OECD peers, had a progressive income tax system (high tax on high income earners), which made it possible to expand its welfare state.39
While powerful corporations have benefited from tax cuts, the consumption tax, which most heavily affects poor and working-class families, was raised from 5% to 8% in 2014 and PM Abe is currently calling for an increase to 10%. Between FY 1989 and FY 2016, total tax revenues remained quite steady: ¥54.9 trillion in FY 1989 and ¥55.5 trillion of FY 2016. However, in those years there was a ¥4 trillion decline in income taxes, a ¥9 trillion decline in corporate tax, and a ¥14 trillion increase in consumption tax payments.40 The rise of consumption tax revenue, falling above all on poor and working class citizens, makes up for the lost corporate tax revenues serving the interests of the richest companies and individuals). Although it was claimed that the total amount raised in the consumption tax hike would be expressly allocated for social protection (see Figure 1.2), of ¥8.2 trillion raised, only ¥1.35 trillion (16.5%) was directed towards social security in the national budget for FY 2016. A large part went to reduce the public debt.41 Worse, Japan has cut back social services including healthcare and pensions.42 The result has been a shift in tax burdens from the very wealthy to everyone else, contributing to distributional effects favoring capital accumulation and concentrated wealth.
Fig 1.2

Government promotion: The hike in the consumption tax is fully used for the enhancement and stabilization of social security
Fifth, the Cabinet Office takes credit for the lowest unemployment rate (2.8%) in the past 23 years.43 But low unemployment is above all a product of the fact that Japan faces a growing labor shortfall as “the youngest members of the nation’s postwar baby boomers [turned] 70”44 in 2017, which pushes up employment levels. To be clear, this is in line with earlier trends driven by an aging and shrinking population (particularly the domestic young workforce) as well as increased demand for health and medical care. Employment opportunities had grown in response to an increased demand of more than one million in the medical and welfare fields from 2013 to 2016, owing to the demographic shift.45
Lastly, high stock prices have been regarded as indicative of the success of Abenomics. However, it is clear that domestic stocks have been bought up by the Bank of Japan (¥23 trillion invested) as well as through the public pension funds (public wealth) by the Government Pension Investment Fund. Their investments account for nearly 10% of the domestic stock market, thereby thriving on unsustainable growth.46 The booming stock market does not illustrate economic betterment of the entire country, but rather reflects disproportionately enlarged profits for 0.1% of corporate giants (about 4000 out of 4 million companies whose stock prices are listed on a stock exchange).47 This has tripled in size the assets owned by the 300 richest (high net worth) individuals to ¥25 trillion.48 This “achievement” has bypassed the vast majority of the population without improving public services. According to a Bank of Japan survey, the proportion of households that do not have financial assets such as savings and stocks became 31.2% in 2017, the highest ever, compared to 30.9% in 2016 and 3.3% in 1987, that is, less than one third the total.49
Fig 1.3 – The rise of private capital and the fall of public capital in rich countries, 1970-2016

Source: World Inequality Lab, 2017 – creative commons licence 4.0 – cc by-nc-sa 4.0
Fig. 1.4 – The decline of public capital as a percent of national wealth, 1970-2016

Source: World Inequality Lab, 2017 – creative commons licence 4.0 – cc by-nc-sa 4.0
To summarize, five years have passed since the start of Abenomics with the proclaimed trickle-down concept. In fact, primary effect of Abenomics has been to increase economic growth and corporate profits while the income of poor and working-class people has fallen. In this respect, it extended and exacerbated patterns from at least the late 1990s favoring corporate interests while increasing inequality and precarity as shown by Inoue (Figure 2.1). This pattern has not been unique to Japan. As summarized by Thomas Piketty and his co-researchers in 2018:
“There has been a general rise in net private wealth in recent decades, from 200–350% of national income in most rich countries in 1970 to 400–700% today. … Conversely, net public wealth (that is, public assets minus public debts) has declined in nearly all countries since the 1980s. … Net public wealth has even become negative in recent years in the United States and the UK, and is only slightly positive in Japan. … This arguably limits government ability to regulate the economy, redistribute income, and mitigate rising inequality”50 (see Figures 1.3. and 1.4).
In Japan, Abenomics has sacrificed human development (measured by the ability to live to old age; to be free from karoshi; and have a healthy work-life balance).
***
The Sorry Achievements of Abenomics
INOUE Shin
Nearly five years on, the three things that have increased most in the Abe administration are: the assets of the wealthy, compensation for executives of large corporations, and donations to the Liberal Democratic Party.
According to the home page of the Liberal Democratic Party (LDP) in announcing the House of Representatives election on October 10, 2017, on launching his election campaign, Prime Minister Abe Shinzo first “underlined how the economy is steadily picking up, by showing objective figures” on the achievements during the last five years of the Abe administration.
Further, the “LDP House of Representatives election pledge 2017” states that “during the quinquennium, we have devoted all our energies to Abenomics. As many indicators demonstrate, Japan’s economy has definitely been recovering.” Therefore “by accelerating Abenomics, we will achieve economic recovery and deflation.”
Let us then review the achievements of Abenomics during the five-year period (2013-2017) using figures in a graph.
Fig. 2.1

As shown in the graph, the top three achievements of Abenomics during the quinquennium, measuring change over five years, are: a doubling of financial assets for the 40 most affluent people; a 1.8 times rise in compensation for executives of large corporations; and a 1.7 times growth of political donations to the LDP.Let us then review the achievements of Abenomics during the five-year period (2013-2017) using figures in a graph.
In short, Abenomics’ signature achievements consist of the success of an income-doubling plan for the wealthiest individuals, executives of large corporations, and the LDP. It is easy to understand how LDP favors to the wealthy makes it possible for those who are well-off and executives to double their payoffs to the LDP.
In contrast, there has been a significant increase in the number of low-end households without savings, experiencing death from overwork (karoshi), mental health problems and injuries in the workplace, non-regular employment, and entering the ranks of the working poor. Concurrently, the education budget, real wages, household consumption, and wages have all decreased.
If, as promised by the LDP, Abenomics is “accelerated”, each graph bar will grow further, pushing more wealth into the hands of the richest individuals, executives, and the LDP, whereas ordinary people will face problems of falling wage, impoverishment, and increased karoshi. The wealthy alone, executives, and the LDP will benefit from Abenomics.
The index 100 indicates the start (on December 26, 2012) of the current Abe administration; the index number compares this to 2016). Please refer to the table below for further references.
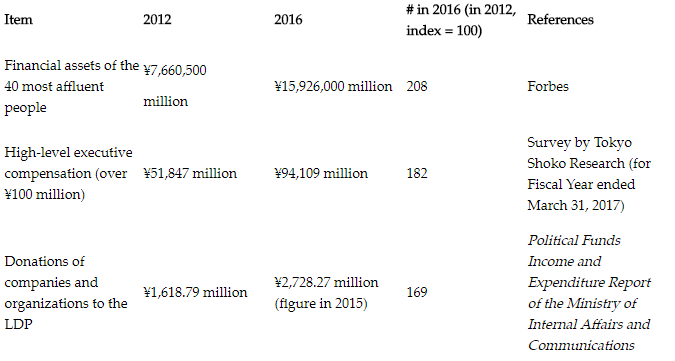
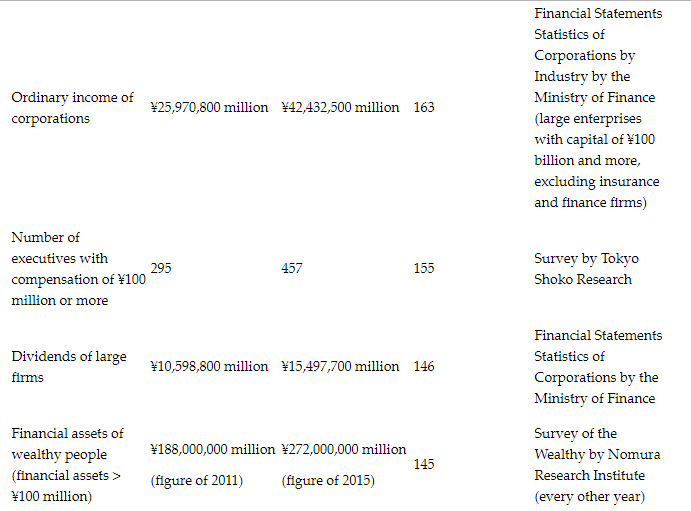
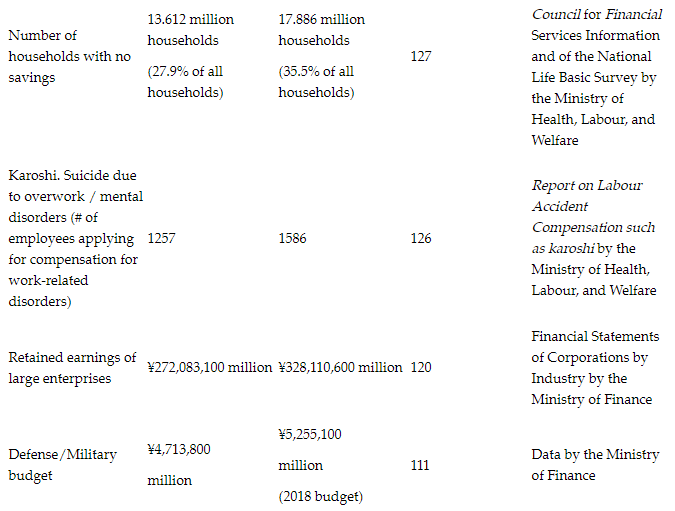
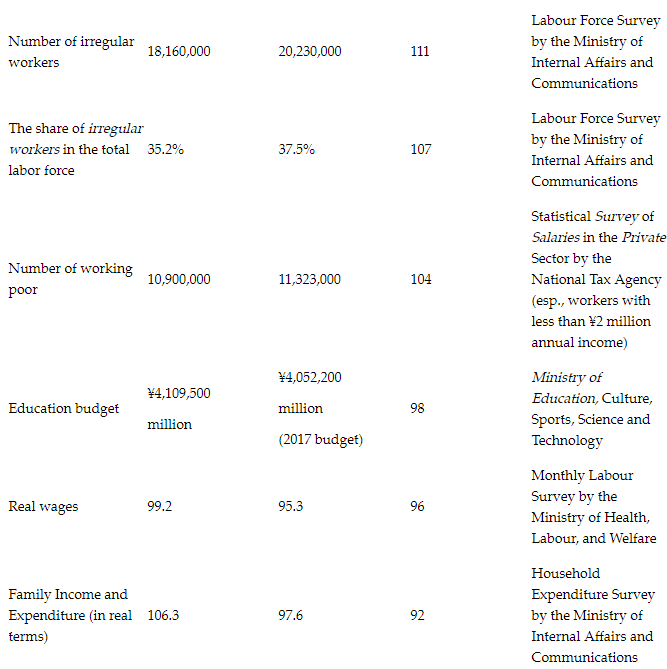
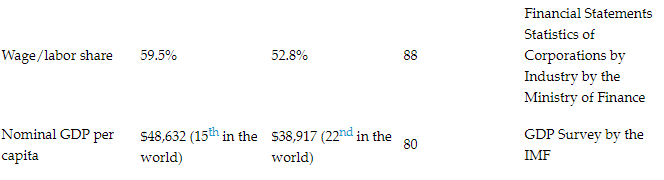
Fig. 2.2 – Changes in real wages from 1990 to 2016
Changes in real wages can be found in The Monthly Labour Statistics Survey on the website of the Ministry of Health, Labour, and Welfare. The graph shows real wage growth to 2016.

Source: The Monthly Labour Statistics Survey of the Ministry of Health, Labour, and Welfare.
As shown in the graph, real wages fell to their lowest levels from 2013 to 2016 during the Abe years. In short, while real wages were declining from 1996, Abenomics extended that decline in wages.
In addition, based on the Statistical Survey of Actual Status of Salary in the Private Sector of the National Tax Agency, when computing the actual wage for 2012, just before the advent of the Abe administration, we obtain an average salary of ¥4.08 million (mn). The resulting graph depicts the decline in the average salary thereafter: ¥4.04 mn in 2013, ¥3.93 mn in 2014, ¥3.89 mn in 2015, and ¥3.92 mn in 2016.
Compared with 2012, real annual wages fell by ¥40,000 in 2013, by ¥150,000 in 2014, by ¥190,000 in 2015, and by ¥160,000 in 2016. This shows accumulated loss of ¥540,000 in wages during the past four years of the Abe administration.
Meanwhile, according to the Financial Statements of Corporations by Industry 2016 provided by the Ministry of Finance, retained earnings of corporations increased by nearly ¥28 trillion (tn), which reached a record high of ¥406,235 billion, and similarly, their current profits have increased by 9.9% to ¥74,987 billion, another record high.
Put simply, in 2016 workers’ wages reached the lowest point since the launch of Abenomics, while retained earnings of large firms and recurrent profits rocketed to their highest levels.
Nonetheless, PM Abe attempts to enact laws aiming at the expansion of a labor system that promotes “zero overtime pay, fixed-wage unlimited work” and “karoshi-prone work”, a consumption tax increase, and more.
Fig. 2.3 – The number of working poor reached an all-time high under Abenomics
Even some of those who work throughout the year earn wages of ¥2 million or less. The number of working poor has risen steadily since 1999 and for the fourth consecutive year in 2016 their number exceeded 11 million.

Source: Statistical Survey of Salaries in the Private Sector by the National Tax Agency.
Fig. 2.4 – Retained earnings of large corporations and real wages, 1997-2016
Notes:
- The data for retained earnings is from Financial Statements Statistics of Corporations by Industry by the Ministry of Finance on large enterprises with capital of 100 billion yen and more, excluding insurance and financial enterprises.
- The data on real wages is from The Monthly Labour Survey by the Ministry of Health, Labour, and Welfare, which is converted from the average annual income of 2012 from The Statistical Survey of Actual Status of Salaries in the Private Sector by the National Tax Agency.
- The beige line shows average real wages.

Fig. 2.5 – Corporate tax rate

Source: The state of corporate enterprises seen from taxation statistics by the National Tax Agency.
Fig 2.6 – Household consumption expenditure

Source: The Ministry of Internal Affairs and Communications.
Fig. 2.7 – Claims for compensation for occupational diseases

Source: Report on Labour Accident Compensation such as karoshi and others by the Ministry of Health, Labour, and Welfare.
***
Translator’s note: As of July, 2017, over half of 225 top-rated Japanese companies listed in the First Section of the Tokyo Stock Exchange had signed a labor-management agreement that permits overtime work of up to 80 hours or longer a month. The figure is considered a benchmark for karoshi. Three types of karoshi are currently subject to worker compensation laws: karoshi (death from overwork), karo jishi (suicide from overwork), and karo jikoshi (death from traffic accidents due to overwork). The graph shows that the number of employees with mental disorders caused by work nearly doubled between 2006 and 2016. For more details, see relevant articles here, here, and here.
Inoue Shin is a central executive committee member of The Japan Federation of National Service Employees. He is an editor of the monthly magazine Kokko, a blog administrator of Editor, an associate of Japan Research Institute of Labour Movement and the Welfare State Planning Studies Association.
Sachie Mizohata is a Luxembourg-based researcher and translator. Her recent article is “Nippon Kaigi: Empire, Contradiction, and Japan’s Future.”
Notes
1 The Wall Street Journal, January 30, 1989, p. 1.
2 The Gini coefficient is the most widely used measure of a nation’s rich-poor gap, measured from 0 to 1, with a higher number implying greater inequality. The Ministry of Health, Labour and Welfare updates once every three years the Gini coefficient before and after income redistribution (e.g. tax). As of most recent reporting date, the level of inequality was 0.570 in 2014 before income redistribution, compared to 0.554 in 2011 and 0.349 in 1981. Meanwhile, the post-redistribution level of inequality was 0.376 in 2014, compared to 0.379 in 2011. See here. According to the OECD report, Japan’s Gini was 0.33 in 2015, more unequal than the OECD average 0.318 in 2014 and 0.315 in 2010. See here.
3 See here (p. 6); Schoppa, Leonard J. 2006. Race for the Exits. Ithaca: Cornell University Press.; Standing, Guy. 2011. The Precariat. London: Bloomsbury Methuen Drama.; Osawa, Mari. 2011. Social Security in Contemporary Japan. London: Routledge/University of Tokyo Series.; Allison, Anne. 2013. Precarious Japan. Durham: Duke University Press.; Baldwin, Frank, and Anne Allison, eds. 2015. Japan: The Precarious Future. New York.: NYU Press; and Tachibanaki, Toshiaki. 2015. Hinkon taikoku Nippon no kadai. Kyoto: Jimbun Shoin.
4 The website of the Prime Minister of Japan and His Cabinet, p.1.
5 Ibid.
6 See here.
7 See here.
8 See here.
9 In the Cabinet Report, there is some discrepancy between the documented numbers in the text and the ones in the graphs, and the years are not specified. The website of the Prime Minister of Japan and His Cabinet, p. 1-2.
10 In December 2016, the Cabinet Office adopted a new method to measure GDP in line with the international calculation standard called 2008 SNA, thereby incorporating the components such as research and development (R&D) in capital expenditure. The data were then revised, with the benchmark year changed from 2005 to 2011, and the revisions were made dating back to 1994. Employment and labor attorney Akashi Junpei has raised concerns about data accuracy (i.e. the fabrications and falsifications of official figures), since the new method, including unspecified components such as “etc.,” has greatly pushed up the value of nominal GDP during the Abenomics years. For more details, see Akashi, Junpei. 2017. Abenomics ni yoroshiku. Tokyo: Shūeisha.
11 For example, see here.
12 See here.
13 See here.
14 There is no official poverty line, but the government uses its own appraisal method to report relative poverty.
15 When the data are presented as an index using the reference year 2000 = 100, the figures in 2015 are as follows: 165 in Canada, 151 in the UK, 137 in France, 134 in the USA, 128 in Italy, 125 in Germany, and 84 in Japan. See here.
16 See here.
17 See here.
18 The website of the Prime Minister of Japan and His Cabinet, pp. 1-2.
19 See here, p. 2.
20 See Mizuno, Kazuo here.
21 Ibid.
22 See here, p. 45.
23 See here.
24 The 2016 report by Nomura Research Institute
25 See here.
26 Note PM Abe’s remarks in December 2013: I believe Abenomics is a failure if the fruits of economic recovery led by large corporations do not reach small and medium-sized enterprises and their employees.
27 The website of the Prime Minister of Japan and His Cabinet, p.1.
28 Note that there is no official definition of “regular”/“irregular” workers. It can be said that the “irregular” workers are those who are not “regular” workers. In general, the “irregular” workers are referred to as those workers such as part-timers, temporary (dispatched) workers, on fixed-term contracts with little financial security. See Genda, Yūji.
29 See here.
30 Osawa, Mari.
31 Standing, Guy.
32 Yamamoto, Taro, member of the House of Councilors, at the Cabinet Committee on December 7, 2017. (See here.)
33 See here. See Ueno, Chizuko.
35 The website of the Prime Minister of Japan and His Cabinet, p.1.
36 See here.
37 See here and here. Also, there are kanpukin (refunds/rebates) as well as tax havens. Kanpukin is the system in which the rebate (refund) of the consumption tax is transferred from the tax office to large export corporations. As the tax rate rises, the refund amount increases accordingly. A retired professor at Shizuoka University estimates that the refund to the top 10 large export companies amounted to ¥783.7 billion in 2015. Since the consumption tax rate increased to 8%, the refund dramatically increased by 1.8 times. The largest refunds went to Toyota, Nissan, and Honda. For details, see here. For tax havens, see here.
38 The OECD analysis for 2009 shows that each country reduced the poverty rate by 20 to 80% after redistribution, with the exception of Japan. The country’s poverty rate increased by 8% in dual-income households and single-parent households in post-distribution. See Osawa, Mari, Taro Miyamoto, and Shogo Takegawa. 2018. “Honraino zensedaigata shakaihoshou toha nanika.” Sekai 2:68-81.; Osawa, Mari.
39 See here.
40 Uekusa, Kazuhide.
41 Osawa, Mari, Taro Miyamoto, and Shogo Takegawa. 2018. “Honraino zensedaigata shakaihoshou toha nanika.” Sekai 2:68-69.
42 See here.
43 Note the figures do not factor in the population excluded from the statistics, e.g. homeless, victims of karoshi.
44 See here.
45 See here.
46 See, for example, Akashi, Junpei. 2017.
47 Uekusa, Kazuhide.
48 Kasai Akira’s assessment from Nichiyō tōron (NHK) on February 25, 2018.
49 See here.
50 Note that their report is open source and reproducible: See here.