“We see a cooling trend,” says Martin Mlynczak of NASA’s Langley Research Center. “High above Earth’s surface, near the edge of space, our atmosphere is losing heat energy. If current trends continue, it could soon set a Space Age record for cold.”

Above: The TIMED satellite monitoring the temperature of the upper atmosphere
These results come from the SABER instrument onboard NASA’s TIMED satellite. SABER monitors infrared emissions from carbon dioxide (CO2) and nitric oxide (NO), two substances that play a key role in the energy balance of air 100 to 300 kilometers above our planet’s surface. By measuring the infrared glow of these molecules, SABER can assess the thermal state of gas at the very top of the atmosphere–a layer researchers call “the thermosphere.”
“The thermosphere always cools off during Solar Minimum. It’s one of the most important ways the solar cycle affects our planet,” explains Mlynczak, who is the associate principal investigator for SABER.
When the thermosphere cools, it shrinks, literally decreasing the radius of Earth’s atmosphere. This shrinkage decreases aerodynamic drag on satellites in low-Earth orbit, extending their lifetimes. That’s the good news. The bad news is, it also delays the natural decay of space junk, resulting in a more cluttered environment around Earth.
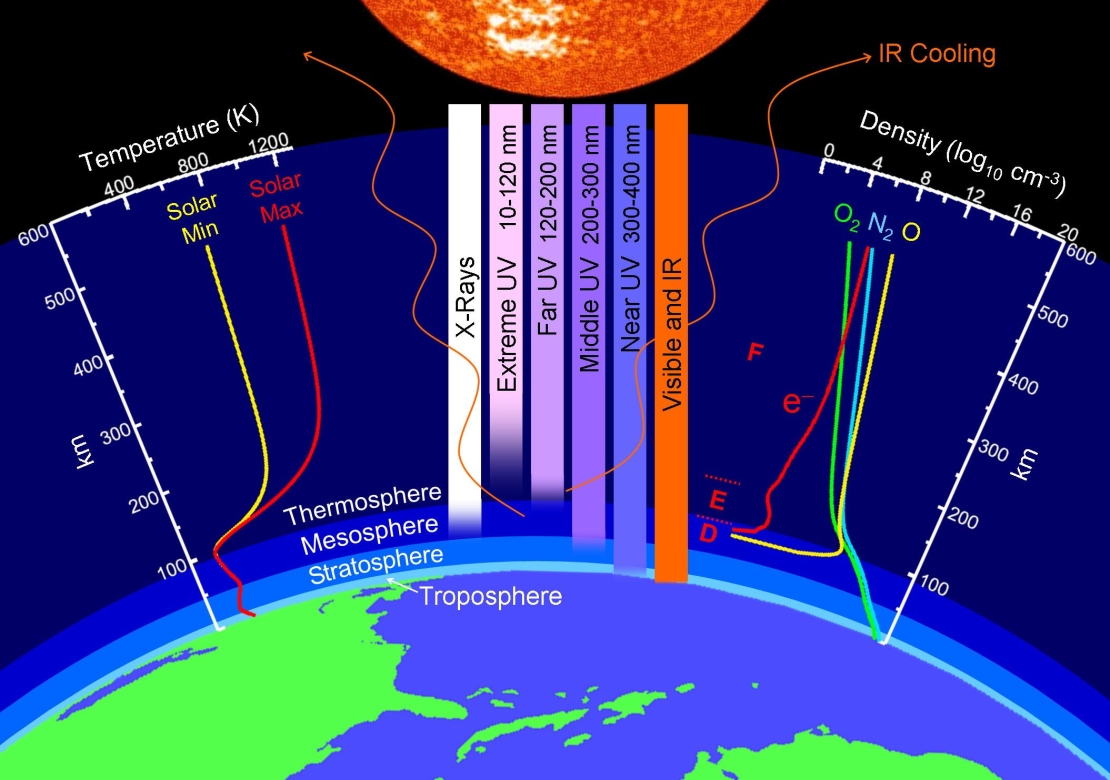
Above: Layers of the atmosphere. Credit: NASA
To help keep track of what’s happening in the thermosphere, Mlynczak and colleagues recently introduced the “Thermosphere Climate Index” (TCI)–a number expressed in Watts that tells how much heat NO molecules are dumping into space. During Solar Maximum, TCI is high (“Hot”); during Solar Minimum, it is low (“Cold”).
“Right now, it is very low indeed,” says Mlynczak. “SABER is currently measuring 33 billion Watts of infrared power from NO. That’s 10 times smaller than we see during more active phases of the solar cycle.”
Although SABER has been in orbit for only 17 years, Mlynczak and colleagues recently calculated TCI going all the way back to the 1940s. “SABER taught us to do this by revealing how TCI depends on other variables such as geomagnetic activity and the sun’s UV output–things that have been measured for decades,” he explains.

Above: An historical record of the Thermosphere Climate Index. Mlynczak and colleagues recently published a paper on the TCI showing that the state of the thermosphere can be discussed using a set of five plain language terms: Cold, Cool, Neutral, Warm, and Hot.
As 2018 comes to an end, the Thermosphere Climate Index is on the verge of setting a Space Age record for Cold. “We’re not there quite yet,” says Mlynczak, “but it could happen in a matter of months.”
“We are especially pleased that SABER is gathering information so important for tracking the effect of the Sun on our atmosphere,” says James Russell, SABER’s Principal Investigator at Hampton University. “A more than 16-year record of long-term changes in the thermal condition of the atmosphere more than 70 miles above the surface is something we did not expect for an instrument designed to last only 3-years in-orbit.”
Soon, the Thermosphere Climate Index will be added to Spaceweather.com as a regular data feed, so our readers can monitor the state of the upper atmosphere just as researchers do. Stay tuned for updates.
Edit: Added the link to Spaceweather website for the story.
References:
Martin G. Mlynczak, Linda A. Hunt, James M. Russell, B. Thomas Marshall, Thermosphere climate indexes: Percentile ranges and adjectival descriptors, Journal of Atmospheric and Solar-Terrestrial Physics, https://doi.org/10.1016/j.jastp.2018.04.004
Mlynczak, M. G., L. A. Hunt, B. T. Marshall, J. M. RussellIII, C. J. Mertens, R. E. Thompson, and L. L. Gordley (2015), A combined solar and geomagnetic index for thermospheric climate. Geophys. Res. Lett., 42, 3677–3682. doi: 10.1002/2015GL064038.
Mlynczak, M. G., L. A. Hunt, J. M. Russell III, B. T. Marshall, C. J. Mertens, and R. E. Thompson (2016), The global infrared energy budget of the thermosphere from 1947 to 2016 and implications for solar variability, Geophys. Res. Lett., 43, 11,934–11,940, doi: 10.1002/2016GL070965
Source: NASA Spaceweather.com h/t to WUWT reader Tom Abbott
When one part of the atmosphere is effected so are all the other parts.
‘affected’ – one of my pet peeves…
It’s nice to have pets. 😉
Is a peeve anything like a gerbil?
Maybe it is one of these:

No, it’s more like a grumpy ferret down your trousers …….
A grumpy ferret down your trousers….
Hmmm… I like that. I am going to borrow it and use it in an effective way on people whose attitudes affect me in a negative way. 🙂
They are more like these :
My peeve started biting small children, so I had to let it go.
Affection for the effects of peeving pets?
effect -noun vs affect -verb
Effect can also be a verb. It means to cause (something) to happen, to bring sbout.
And just to add to the confusion “affect” can also be a noun, although it has a rather specialized meaning limited to discussions of Baroque Art. See here . From the German Affekt.
But yes, I share Photios’ peeve on the mis-usage of both “affect” and “effect”.
Did the meaning get through?
If so, communication was successful.
I suggest that, today, in the Internet Age [no, it’s not a silly geological one, like the Adjustocene], as long as clear communication is achieved, with the target audience, all is well.
My late Mum never used a computer or a mobile phone, so texts, and Insta-thingies, and the rest were beyond her.
And if a teenager won’t use text or Insta-thing, I am lost!
Auto
No longer young . . . . .
I’m pretty sure Affect is the name of an American actor, but I’ve ben wrong before…
“Affect” as a noun is also used in psychology, meaning the way a person’s face expresses their state of mind.
Ditto on the “pet peeve.”
NO!
In his extremely interesting book, ‘Fate is the Hunter’ Ernesyt K Gann is chastised for being unable to hold altidude to an exeact figure on his altimeyer ‘why nother: te sky is clear’
The answer, proven wise in several instances later in the book is ‘so as to be in the habit of it when it really matters’ . As in descending to sea level through cloud with a base of less than fifty feet…
The circumlocution of most legal boiler plate is there because once in a blue moon, it matters:
Hre uis te fiorst tow lones of text from Article 50 of the Lisboin treaty,m te Artticle under which Britain is trying to leave the Europen Uniopon
Now this seems straightforward. You decide to leave, and you say so and invoke te article. And that’s it, willy nilly, you are gone.
But it is being interpreted by those who don’t want to leave as being not the announcement of a decision to leave, but merely the intention to leave, which is then reversible should we e.g. hold a second (third, forth fifth or sixth) referendum and vote to stay in..
Leo, if you are going to rail about the super importance of the proper usage of words, I suggest you spell check/proofread before hitting post. Just saying.
I like the effect I get when I effect a speech affect to affect others.
Verbs are used when a noun just won’t do.
“as long as clear communication is achieved, with the target audience, all is well”
My observations suggest that “clearly something is communicated” is very different from the intended idea being communicated — and the former is much more common than the latter.
The thing is, AndyHce, even if someone crosses all their T’s and dots all their I’s with impeccable spelling and grammar, that doesn’t mean they will communicate their intended idea any better than someone that makes a few typos and doesn’t properly punctuate their sentences. There’s more to communication than the mechanics of sentence structure. Some people are poor communicators despite being great with grammar while others are very good at communicating their ideas despite their poor proofreading skills.
Effect is a verb as well
…just be glad we don’t also have iffect, offect, uffect, and sometimes yffect…
Mine, too. Educated people should know better.
Most people have bigger things to worry about.
It should be remembered that for some of the post authors and commenters here English is not their native tongue.
(And then there’s us hillbillies.8- )
Part of the problem is most people spell according to what they hear.
When spoken at speed, the difference between effect and affect is pretty small.
Similar to how eggcorns are born, I guess.
Mine, too. Educated people should know better.
Knowing better and doing better are two different things. In informal settings (such as publicly accessible internet forums such as this one) people don’t always take the time to rigorously check that their spelling and grammar is correct. There is a tendency to quickly dash off a post rather then spend extra time in proofreading, spellchecking and grammar checking.
Just look at Leo Smith’s post at September 28, 2018 at 11:46 pm in this very thread. its a post filled with typos that is attacking the idea that the idea being communicated is what is important, rather than proper spelling and grammar. By his own argument (which was clearly communicated despite the typos) his post is a fail due to the numerous mangled words in his post.
I am phonetically deaf.
In practical terms this means I learnt to spell by brute force in remembering how words ‘should’ look on the page. The sounds that come out of your mouth are mentally processed as words and concepts by my brain, but not letters. Even today I spell when typing by trying semi random letter combinations until the red wriggly line disappears.
While I am sympathetic to your pet peeve I would also appreciate if you kept it on a leash when in public.
Unlikely to have an affect, it’s hard to effect these things. Just kidding.
affects cause effects. easy to remember
“Affect is the action, effect is the end.”
Not quite. Effect is more engulfing than affect, both in verb and noun forms
I sit with Leo on this one, affect as a verb usually implies a negative influence of some kind (to me, anyway).
That very statement, rocketscientist, is exactly how my graduate advisor beat the proper usages of affect and effect through my titanium hard, but lead dense skull. Another of my personal “fav’s” are material and materiel.
Capital and capitol.
[The mods note, however, that the money, the interest in money, and the interest made from money all seem to go to the pals of the pols in the capitols. .mod]
Why do idiots on this site constantly deflect from the important issues, by discussing grammar and syntax..? Are they working for cIimate alarmists?
R
Showing off?
I thought this thread was about the cooling trend that many people such as Salvatore and others have been predicting for quite some time now, not a smug lesson in grammar. Having said that, I’m sure many folks on this site don’t like to be told the truth about the Sun’s influence on our climate. Choosing to believe self appointed experts, or should I say expert? So they resort to pathetic comments about the use of language. Hey, get your woolies out, you’re gonna need them 🙂 You should have listened….
Indeed Jay. I’ve noticed that it’s the people who don’t like the message that obsessively focus on the messenger. And one way to do that is to attack them over their spelling/grammar rather than engage the ideas they were discussing.
+1 extraespecially when English is not the first language of the writer 8)
Incorrect usage , etc. exposes the site’s participants to mockery by warmists (among themselves) and to raised eyebrows among fence-sitters. Plus,, if corrections are not done in a nasty way, they provide a free learning experience for offenders and readers, keeping them from looking foolish by making the same error on other sites.
I don’t bother to correct other commenters, but I do correct head posts, because they are likely posted elsewhere, where more non-skeptics are likely to see and sneer at them if buggy.
If they sneer at minor grammar errors, then nothing you say will change their mind anyway, so I don’t waste my time trying to please them.
If you are concerned about the grammar or misspelled words, I don’t think you are taking the material itself seriously. If you are reading comments and finding issues, why pretend it is the warmists that are making a mockery of the site, when you are?
If you have to sit and worry about how what you are saying will be perceived – did I use the right word, did I punctuate the sentence correctly, etc., most people are not going to comment at all, leaving questions unasked and knowledge not gained. And that just leaves it to the science types that try to see who can post the most unreadable comment for the average person trying to learn something about climate at a level that makes sense.
Believe it or not, it isn’t the pedigreed people that come here that are the greatest benefit to the site’s cause, it is the layman that is trying to make up his or her mind whether the MSM is telling them the truth. If they can’t read and learn from the comments, they aren’t going to come back. “The science guy” knows that communication on the level of the people you are trying to convert, if you will, is by far more important than trying to show off your degree and years of practice. Worry about the choice of a word, and dumping on someone because they chose the wrong word, is not only anal, but defeats the purpose of trying to communicate.
@Tom O
I agree—that’s why, as I said, “I don’t bother to correct other commenters.” Offering corrections to head posts is helpful, because their authors would be able to correct them (unlike a commenter, whose edit-time has expired) and who would be more embarrassed by them, because they composed their pieces at their leisure and had time to reread them for errors, unlike a commenter. Anyway, it’s understood that commenters are not expected to be up to the standard of “authors.”
But I don’t feel that corrections others make to other commenters, if phrased helpfully, are necessarily bad. They can be educational, to the target and bystanders, if phrased helpfully or playfully, as above. Nastiness and censoriness more often comes from commenters who object to such corrections.
The one place where correctors deserve to be slammed is which THEY are incorrect, and snooty about it too, as sometimes happens, although more rarely in the past three years here than previously. One example is the “correction” of “data” when used as a collective (singular) noun (e.g., “the data indicates …”). Another instance is the snooty “correction” of “skeptic” spelled with a K instead of a C, as is done in Britain. Both “corrections” can be beautifully squashed with an appropriate quotation from Britisher’s Henry Fowlers “bible,” “Modern English Usage.”
funny
“funny”
I assume because I failed to put an apostrophe in “Fowlers”.
Actually, I should have written, “Britisher Henry Fowler’s”
Incorrect usage , etc. exposes the site’s participants to mockery by warmists (among themselves) and to raised eyebrows among fence-sitters. Plus,, if corrections are not done in a nasty way, they provide a free learning experience for offenders and readers, keeping them from looking foolish by making the same error on other sites
Roger, if you are going to “correct” or “mock” other people’s errors, it would behoove you to first be sure that your own postings are error free. For example, just in the above quote there is no need for two commas after “Plus”, you only needed the one. (though I will give you credit for having far less errors in your post than Leo did in the one I commented about previously).
Don’t get me wrong, I agree with your philosophy of commenting on errors in the head posts (by which I assume you mean the actual article being commented on), as those should be written with care before being published and are meant to be read by as wide an audience as they can reach. It’s the nitpicky attacks on other commenters that I think go beyond “a free learning experience”. Which is why I only point out the errors of those who insist on pointing out the errors of others, since I generally am of the philosophy that the job of comments are to communicate ideas and opinions, and that job does not include being paragons of good spelling and good grammar. (which is a good thing considering all they typos and other mistakes I tend to make when commenting – which is why I dearly miss the edit function)
Roger: Many forget the reasoning for developing a precise language, that of helping to clarify communication. In other terms, the correct use and understanding of grammar helps us to better understand what others are attempting to relay verbally or orally.
Those who are either too lazy or too uneducated to at least attempt to use proper grammar often display their ignorance and carelessness in other ways.
Of course, this is not referring to those who have made an extra attempt to communicate in a second or third language. They are to be congratulated for their efforts.
[We need to remember their/they’re/there children in the store before leaving.]
Now, to return to regular programming and the main topic…
excellent point. thanks.
Teaching moment?
Your rite
I believe there was a study on the divergence of online thread topics sometime ago.
This isn’t the one I was thinking of, but it’s a start
https://pdfs.semanticscholar.org/2e73/35eea4bd102744b2d95d67a14d7143b01199.pdf
As the old saw goes, words have meaning.
Using the wrong word affects the meaning of the sentence.
English has mopped up so many words, meanings, and sentence structures that I wonder that anyone even has it as a first language. It can be real hell for speakers who have another mother tongue to learn. The Romance languages are more consistent since they generally haven’t picked up so many mannerisims from other languages. The base is still Latin.
But German can still the hardest to understand be.
Grammar matters, that’s why. It’s idiotic to claim it doesn’t.
Yes grammar matters, but communication matters more (and being an ass about grammar does you no favors). If the person successfully communicated their ideas (i.e. *you* know what they were trying to tell you) the fact that they misspelled a word and/or typed the wrong word (i.e. affect vs. effect, to vs. too vs. two, etc.), misplaced their punctuation, etc. is really not all that important. Particularly in an informal setting such as a comments section of an internet forum such as this. And remember, not everyone posting here are native English speakers, and not all the native English speakers have had proper training in typing. mistakes will be made. Just because someone posted “too” when they meant “to” or “affect” instead of “effect” doesn’t necessarily mean they don’t know the difference, it just means they typed the wrong thing and there are many reasons why that could happen with only one of those reasons being that they didn’t know. There’s no reason to automatically assume that is the case whenever you see such a mistake.
In communicating, by voice or the written word, it is hard to imagine anything more important than the words used. Words have meanings, usually quite specific ones. Carelessness or ignorance of those meanings can lead to serious, sometimes fundamental, misunderstandings. Mark Twain once wrote, “The difference between the right word and the almost-right word is like the difference between lightning and the lightning bug.” “Lightning” is another maligned word, too often misspelled as “lightening,” a totally different word. Lightning is an electric discharge from the heavens, while lightening is what happens to hair when a brunette decides he wants to be a blonde.
It’s easy to imagine. It’s called context. When someone in an informal setting makes such mistakes, the context can make clear what they mean. To use your example if the discussion is about weather phenomena, then a person using “lightening” in that context will easily be spotted as not meaning “a brunette deciding to be a blonde” and upbraiding them for the mistyping instead of engaging with the ideas they are communicating makes you look as bad or worse as you think their typo makes them look, as you will come off as a jackass grammar Nazi. and nobody likes a jackass grammar Nazi. except other jackass grammar Nazis.
Grammatical Pedantry Syndrome
https://www.urbandictionary.com/define.php?term=Grammatical%20Pedantry%20Syndrome
Give ESL folks a break.
All this focus on affect is just so much affectation.
Hurrah! For citing the OTHER meaning of ‘affect’
Problem is, “Affected” has gotten the same educational system treatment as Bring/Take. I have had highly educated and many fellow employees “correct” me for my “improper” use in a report, analysis, proposal, or other written document. I have thus developed the attitude of looking at it as an indication of their “intelligence” and making the changes they ask. To correct them or explain makes them think that you are really in need of education.
At least he tried to avoid “impacted”.
Photios,
Why not try to explain it? Effect is when the action is directed away from the subject whereas affect is when the action is toward the subject. A similar example is affluent / effluent. While the common meanings of these words are different today the original meanings were:
An affluent stream was a stream flowing (fluent) into a lake while an effluent stream was a stream flowing out of a lake. A cute little cartoon that illustrates it can be found here:
http://englishusers.blogspot.com/2010/01/common-mistakes-affect-vs-effect.html
Photios, now wasn’t that better than just pointing out one of your peeves?
Speaking of pet peeves:
*tweeeeeet* FLAG!!! Nonsensical statement!!! No such thing as ten times smaller! It can be one-tenth the level of the peak, but ten times smaller? How!?!?
Exactly, what sort of scientist would write that sort of thing anyway? Worse than scratching across a blackboard.
“It can be one-tenth the level of the peak, but ten times smaller? How!?!?”
. . Ten times less big? . . ; )
Self evident…. by a factor of 10.
Ok, you’ve just blown the whistle on one of my pet peeves.
+2…with a bullet!
To affect – to make a difference, among many other factors
– to act out that which is not strictly true: “He affects climate change concern whilst having three private jets”.
To effect – to bring into being. “God effected the world in 7 days and then took a break”
An effect – the (total) result of a cause. “True Socialism espouses a government whose effect is a total tyranny and monopoly of wealth”
six days
The one thing I dislike about the new WUWT blog format is just how quickly it can go off the rails. This is a perfect case in point.
This site has had multiple formats over the years, and we’ve always gone off the rails quickly.
I miss the +1,-1 buttons.
Photios, you’re so right. Nearly every time I see this word in print, it’s misused.
My signature should be: it’s = it is, which is another of my pet peeves.
I guess 90+% the times you hear or read “decimate” it’s the wrong word.
… and a hot water heater heats cold water – not hot water…
The children won’t know what an apostrophe is.
I love that the final effect of this post is a conversation about proper use of “effect” and “affect”. Much better than ANY conversation about temperature change in the thermosphere, aka outer space.
How does the temperature of the thermosphere relate to surface temperature?
They should be able to observe that the changes are not uniform around the Earth so that they differ over the equator as compared to over the poles which would be implicated in changes in jet stream meridionality in the upper troposphere.
One way or another, solar variations alter global cloudiness for a net warming or cooling trend at the surface.
I’m pretty sure the shrinkage of the thermosphere is due to it having been in the pool.
Good one. Perhaps that’s why NASA wants to measure SL rise in millimeters.
Groan!
It shrinks? I don’t know how you planets orbit around with those things.
Showing yet again the qualitative importance of the UV spectrum, leading to an outsized influence on weather and climate beyond its small quantitative share of TSI. UV varies far more than does TSI at the top of the atmosphere, which absorbs all of UVC, most of UVB and little or no UVA.
UV also varies quite a bit at the surface. I sunburn very easily. Years ago and especially at high altitudes, no matter how much SPF-50 sunblock I would use, I still burned. Over the last few years, the UVA/UVB flux has been significantly reduced based on measurement by my own skin. I don’t think it’s properly accounted for by the official TSI measurements.
Good observation
Have you been recording this new UV data metric? I would like to see a graph.
You want to see a skin graph???
+1
Notevil, I think our skin ‘learns’ to produce melanin to absorb UV and tan over time. I (being a red-head) never tanned, only burned. At 20 years okd in India for 6 months I suffered a kind of trial-by-fire (or sun) and ever since I’ve tanned really easily.
co2isnotevil: Over the last few years, the UVA/UVB flux has been significantly reduced based on measurement by my own skin.
It takes less UV energy to damage a mass of live skin tissue than is required to heat equal masses of water and sand noticeably.
Incoming UV is like the voltage on the grid in a vacuum tube.
I think a great many people wont find that analogy useful 🙂 however good
According to the the feedback model of the climate, all forcing is like the voltage on the grid of a vacuum tube. This is why they have it wrong, as the amplifier model doesn’t conserve energy between the grid and the plate. The output power comes from an implicit power supply and not from the forcing and feedback connected to the grid. This is explicit in the first paragraph of the only reference used by any climate feedback paper as the source of the justification and math for a climate feedback model.
https://archive.org/details/NetworkAnalysisFeedbackAmplifierDesign
I have made the same point elsewhere. Most AGW acolytes have no idea of science except what they memorize from their catechisms. The ipcc_oven.png is one of my favorites.
I wonder how many readers out there even know what a vacuum tube is anymore.
A few decades back my then teenage daughter was nattering on about something. I told that she was starting to sound like a broken record. She of course, stormed off in a huff.
About 30 minutes later she poked her head out of her room and asked: “Daddy, what’s a broken record?”
My English language nit to pick for the day – It is one tenth the size, not ten times smaller!!!!!!!
I wish people would quit doing that.
(I know it is a quote and not the responsibility of this site. just one of my pet peeves.)
Why not? Everybody knows well what ten times smaller is. And nobody would say one time bigger… because it is a multiplication.
There’s even a scientific paper on this. It is not wrong, though many think so.
Hugs
It must be a pretty funny paper to read. To me, saying “ten times smaller” in in the same class as, “We are having a lot fewer rainfall this year” and “I would like to have a drink of a milk.”
If I have 100 and you have ten times less, you have -900.
I have no big problem with “ten times smaller” but
with “twice as small” my brain has car crush (with ‘twice as big’ or large I’m ok)
The amount (or size) was decimated. (Reduced to one-tenth of its original number.)
… or, reduced by one-tenth.
Decimation is an old Roman thing and refers to killing every tenth man in a legion to improve morale or something.
jorgekafkazar September 28, 2018 at 2:39 pm
Budget cuts in payroll?
Scipio used the survivors of Cannae for his army.
“It is the part of a fool to say, I should not have thought.”
https://nationalinterest.org/blog/hannibal-vs-rome-why-the-battle-cannae-one-the-most-18763
michael
Yeahbut its meaning is changed in modern times. Languages are fluid.
But should they be?
Years ago I heard a radio play about political correctness and the change of meaning of words. A classics schoolmaster was accused by a female modern studies mistress of sexism because he had used the word ‘rape’ in the classical sense of abduction or taking by force with no implied sexual connotations.
If the word had a single well defined meaning all would have been avoided.
Neither do we allow the meaning of terms like ‘second, metre, kilogram’ to ‘evolve naturally’
This is all guff by arts and humanities students who like fuzziness in everything because it means they have plenty of places to hide.
But in terms of making the world WORK we need exactitude and precision.
And this IS relevant to climate change where some terms as ‘acidification’ actually turn out to mean ‘reduction in alkalinity’. Indeed it has been my experience that the whole of the renewable/left leaning/climate change ‘movement’ is permeated by people who talk not in clear unambiguous mathematical or scientific terms, but in emotive hand wavy vague ones.
Yes, meaning does matter, meaning needs to be commonly agreed, so that miscommunication does not take place, and it needs to be exact in many cases, so uncertainty does not creep in.
Decimation is an old Roman thing and refers to killing every tenth man in a legion to improve morale or something.
Shaka of the Zulus did it better, when he disciplined a regiment he had one in ten stand out in front of the regiment’s battle-line. Needless to say they were the first to be killed by the enemy but they fought hard encouraged by their regiment and the rest of their regiment fought hard to avenge them. At Gqokli Hill if I recall correctly.
I don’t know what ten times smaller means without knowing what the initial “smaller” is. 10 times smaller than a number that isn’t changed is nonsensical. “Times smaller” could make sense if, for example, B is 20% less than A and C is 40% less than A then C is 2 times smaller than B. Anyway, it is fine for people to make the excuse that everybody knows what is meant by their sloppy usage except that when those same people try to express a complex idea, often it is impossible to know what they mean. Scientific writing is full of statements that have multiple meanings, or even worse, no discernible meaning.
OweninGA
Upvote!
I’m with you there, Owen. It is expressed as a mathematical relationship. In math there is no such thing as 10 X less. It is an invalid statement mathematically and clumsy and inarticulate.
Could agree more.
Okay, I’ll give you one tenth of an up vote.
There was a website to rant about that. Ah, I didn’t bookmark because I knew I could find it again, see http://timesless.com/
Department stores get it right, they never, ever say some clearance item is now five times less, they say 80% off. If a department store can get it right, scientists and engineers can get it right too.
Peeve on!!
If everyone is going to drag their pet peeves out, just make sure to dress them warmly, it’s getting cold out there.
Here’s my bundled-up pet peeve (one I’ve never brought outdoors before): Uses like “the below chart.” Until ten years or so ago, it was commonly written, “The chart below.” What was wrong with that usage? Why have so many writers abandoned it?
Simply because the concept of an adverb (or preposition) is now too hard, grammar no longer being taught, so an adjective is made of it.
Leo Smith, what you’ve written here makes sense to me. The more frequently people see an error in print, the more likely it is that they’ll assume the error is correct and repeat it. And thus, the language continues to be degraded.
degrade or simply evolves to new usages. Except for dead languages, languages change over the time to reflect the way they are used by the masses. That’s why, if you look at words in the dictionary, you’ll often find multiple definition for the same word. As usage changes, new definition arise and old definition fall into disuse.
Totally agree, the world of hyperbole.
I always say to people write the sentence as a math equation and it should be correct.
That ludicrous description of relative size simply does not work.
WUWT presenters do it more than I hoped.
A mistake the size of Manhattan!
It affects an effect greater than 200 Hiroshima bombs!
… but the 10 times smaller than an Olympic swimming pool of enriched Uranium-235 affecting effect.
that was hyphen-challenged!
[So, should the mods hyphen-aid it? .mod]
You just decimated Olympic swimming pools.
there is clearly a demand for english expression pedantry rant sites
[And capital letters. .mod]
Just ’cause their use of the language of English ain’t that more articulate than what you think it must be don’t make the meaning of that very obscure. If you gets how I mean.
Ten times small, simple that 1/10th. And verily it is not a good we should use ‘three times’ and not the proper term ‘thrice’?
Lots of scientist are both poor at articulating their point and many are dyslexic, these failings (IMO) do not make them poor scientists. Just a little harder to understand.
Good news for LEO satellite life-times
Nah, we always build them with excess margin just incase we may have miscalculated and the atmospheric drag snags us. When you get down to details like this you begin to notice things like how non-uniform earth’s gravitational field is, and how non spherically uniform our atmosphere is. Think of spring skiing when you pass from cold icy patches into soft slushy patches. Speed up…slowdown…
Tides are a reasonable indicator of Earth’s non-uniform gravitational field.
above graph
 ?w=768
requires an explanation of a link (if it indeed exists) between left hand scale (power 10^11W) and the sunspot count as shown, otherwise the it’s meaning may be highly misleading.
That is not the sunspot count, it’s the TCI.
For all practical purposes makes very little or no difference
http://www.vukcevic.co.uk/TCI.gif
If you want an explanation of the link I suggest you read
https://agupubs.onlinelibrary.wiley.com/doi/full/10.1002/2016GL070965
thanks, but I had already found the link by googling
Thermosphere Climate Index Mlynczak
Sadly, we sceptics require what the planet nor humanity needs to prove our point, global cooling.
I suspect humanity has wasted three or four decades on AGW when the money squandered could have been better spent elsewhere.
I have no doubt, however, that the hordes of green lunatics will lay claim to the success of their renewables initiatives as global temperatures drop until, that is, someone blames them for global cooling.
I’m not sure there will be many places the forkers can hide.
Not a hope, the dogma will be that a natural cooling is temporarily countering man made warming; when the natural cooling ends temperatures will skyrocket.
“…the money squandered could have been better spent elsewhere.” But where would all of those ‘Climate Scientists’ have gotten work. They’re not scientists since they don’t accept/believe in the scientific method, so scratch that. I guess they could maybe have gotten jobs as teachers, but that would have had an adverse effect on our education system. Porcelain Immaculation Specialist? Sanitation Engineer? Gee, maybe one one of those :<)
+10
Imagine your favorite alarmist saying “Do you want fries with that?”
You mean the cheif assistant to the kiosk?
[Or the chef assistant to the kook. .mod]
“97% of our customer want fries.” — Cook.
In China they’d be sent (during the Cultural Revolution) to the countryside to plant potatoes and learn from the People.
HotScot…
This will be their argument… “See, we were right! Our predictions of certain doom have been masked by this unusually weak solar cycle.”
“Abandon carbon now or all life on the planet will go extinct once the sun heats back up.”
I thought they were sent to the fields to be buried with the potatoes… Or was that in the Ukraine?
They will move to some other scam; possibly not yet invented.
Years hence, the “cooling” noted will be claimed by the same gang who claim their model “explains” AGW, or it will be decried by the same gang as not part of mainstream science, never widely accepted. Whatever happens, they were right and predicted it.
“I’m not sure there will be many places the forkers can hide”
We haven’t seen you at WUWT for very long, Hot Scot, so you may have missed the evolution of climate science over time. When the global warming thing started 20 years ago, the sun’s input was a constant and the earth’s climate hadn’t changed between the Big Bang and 1750. Sceptics started bringing up facts from geology and astronomy, to dispute the simplicity of the message. Look how they have managed to absorb orbital variations and glacial-interglacial cycles into the narrative, without breaking a sweat.
The CO2 story is going to mutate in ways we can’t imagine yet. It’s too valuable to those who want to control your life. The forkers aren’t encumbered with concepts like evidence.
That’s why talking about the science isn’t doing very much. We are dealing with climate science, where moving the goalposts is more than just a response to inconvenient facts presented by sceptics; moving the goalposts is fundamental to the “scientific” method. Along with adjusting the data to support the pre-determined conclusions.
I think your link to spaceweather.com should be this:
http://spaceweather.com/archive.php?view=1&day=28&month=09&year=2018
Right now it goes to a page to sign up for email alerts.
Hellooooo mods or Anthony. The link to the source of the story is still wrong.
(Added the link to the posted article, thanks for the help) MOD
Occam’s razor:
What is the logical explanation?
a) The atmosphere heated due to highly active sun.
b) The atmosphere heated due to increase of 0.01% of CO2 during the past century.
Maybe it is that the expanded atmosphere during a warm trend is the reason for the extra heat lingering in the atmosphere thus causing warmer temps overall. Then when the atmosphere shrinks heat then moves more quickly out to space. Last part to that is when solar conditions are such that the atmosphere remains at a lowered height for a longer period then just during the solar minimum, and that is where deeper cooling sets in.
“ The atmosphere heated due to increase of 0.01% of CO2 during the past century.”
More like 40%.
Yes, the sentence would be correct if it read “ The atmosphere heated due to an additional 0.01% of the lower troposphere being CO2 during the past century.”
The increase from 300 ppm to 400 ppm represents one more molecule of CO2 in every 10,000 molecules of atmosphere, from 3 in 10K to 4 in 10K.
This is indeed a 34% increase in the total CO2.
I don’t find that very impressive when properly placed into perspective.
“I don’t find that very impressive when properly placed into perspective.”
Yet you find it impressive that that extra “additional 0.01% of the lower troposphere being CO2” …. “greens the planet”?
Or that despite O3 being such a tiny proportion of the atmosphere, it stops us being fried by UV?
Pop Piasa
“I don’t find that very impressive when properly placed into perspective.”
Yet that unimpressive 3-4 parts in 10,000 are capable of supporting all life on earth.
But this has nothing to do with Eyal’s question. Is it logical that an increase in CO2 resulted in some warming? The implication was that a mere 0.01% rise was not likely to have caused the warming. But if you put this in the proper perspective of a 40% increase, it seems more plausible.
The peculiar “correlation is causation” basis for AGW alarmists has no way to explain that a 60% rise in CO2 (250-400) “caused” a 0.03% rise in global temp. Using USSA methods, I estimate CO2 as having a 0.014K effect as a part of the 32K global warming. This may actually overestimate CO2’s heat retention import.
Anthony suggested my article about the comparison of Mars data on the topic might be better placed as a reply:
MARS SHOWS NO GLOBAL WARMING WITH 9X EARTH MASSCO2, AND 15X EARTH
PPCO2
I decided to look up the comparison of black body vs actual temperature for Mars. Since Mars’ atmosphere is 95% carbon dioxide and not much else by way of “greenhouse” gas, I thought to examine the “greenhouse” effect on Mars. My own analysis showed that CO2 on Earth is unlikely to exceed 0.015K on the basis that it has too little heat capacity to make a significant difference at 400 parts per million by volume.
The site NASA maintains for Mars has the following address https://nssdc.gsfc.nasa.gov/planetary/factsheet/marsfact.html
The relevant data appear in two sections, “Bulk Properties” and “Martian Atmosphere”:
Black Body temperature 209.8K
Average temperature ~210K
From the same source, the mass of Mars’ atmosphere is roughly 2.5×10^16 kg and 95% of that is 2.38×10^16 kg of carbon dioxide. For comparison, Earth’s atmosphere is roughly 5.15×10^18 kg, but at 400 ppmv (~500 ppmw), the mass of Earth’s CO2 (2.5×10^15 kg) amounts to less than 11% as much as Mars’.
I thought it worth sharing here that NASA has data that contradicts the claim that CO2 is an important factor in heat retention. It has no appreciable effect on Mars, and there is less of it on Earth (where it’s more dilute).
The link cited broke and was down, though it’s been back (so I saved a copy):
Data from it Surface pressure: 6.36 mb at mean radius (variable from 4.0 to 8.7 mb depending on season) [6.9 mb to 9 mb (Viking 1 Lander site)]
Surface density: ~0.020 kg/m3 Scale height: 11.1 km Total mass of atmosphere: ~2.5 x 10¹⁶ kg Average temperature: ~210 K (-63 C)
Diurnal temperature range: 184 K to 242 K (-89 to -31 C) ( …Dec 23, 2016
NASA has a new site with less data.
Their BB results were 209.8K (no longer on the new site)
My own calculations showed BB 208K
Actual still shows avg 210K, so even if we use my BB vs NASA actual, 96% CO2 leads to a 2K change, at 9X mass of CO2!
Using 6.5mb for total Mars pressure, 96% makes PP CO2, ~6mb. Earth’s concentration of CO2 at 400ppmv allows calc’n of PP CO2 here to be 0.4mb, 1/15 that of Mars (NOT 15 times smaller! :))
What warms Earth? Water, in all its states.
Re my reply on Mars. I saw no way to edit what I posted, so…
Replace: “What warms Earth. Water in all its states.”
With: “What warms Earth? The Sun. What retains/distributes heat so we can live here? Water in all its states.”
“Yet that unimpressive 3-4 parts in 10,000 are capable of supporting all life on earth.”
Only by a slim margin. 2 or 3 less molecules per 10K of atmospheric molecules and everything dies.
I vote for a target of 0.1% of the atmosphere to be CO2, just as it is in the average grade school classroom where plants are flourishing by a sun-facing window.
I realize that a 40% increase in the size an amoeba still does not make it visible without a microscope, and also that a 40% increase in CO2 in the atmosphere (which only contains .1% of the planetary heat) would need eons to heat the oceans (holding 99.9% of the planet’s heat) by the slight increase in back-radiation.
Common sense points toward oceanic processes and atmospheric circulation phenomena governing climate just as they do the weather from day to day. The pause invalidated CO2 as the primary driver of global temperature. CO2 is not linked to weather and (in the long term) climate in any way. There is only a weak correlation of CO2 increase to historic temperature rise (as long as one ignores natural warming since the LIA), plus a laboratory-proven, molecular scale particle emission theory whose net effect in the atmosphere has never been empirically observed, only modeled.
Only by a slim margin. 2 or 3 less molecules per 10K of atmospheric molecules and everything dies.
Hence my point that a change of a few hundred parts per million can have a dramatic effect on the planet.
Thank you for the taxpayer funded data and tracking real information. Let’s make that the core mission.
So if the sun’s UV “has sharply dropped”, why did I get a sun burn at Hanauma Bay while using reef safe sunscreen?
Perhaps reef safe sunscreen is ten times less effective. 🙂
Ba-dum ding!
Sledge-o-matic, Ric!
according to their index graph it’s been gradually getting cooler
Which would explain remote stations showing a temp decrease
Global cooling is here.
Click on my name to read my final report.
I see nothing new here, just a rewording of what we already know about the thermosphere (aka “ionosphere”). Solar radiation (especially EUV during solar max) ionizes (“heats”) molecules, atoms and oxides of nitrogen and oxygen. During solar min, ionization decreases (“cools”), forming a virtually isomorphic relationship to the 11-year solar cycle.
So that’s why the so-called “TCI” (Thermosphere ‘Client’ Index) tracks solar activity almost well. So, yes, the TCI could easily be reconstructed from solar activity measurments, because they are essentially equivalent measurements of the same process (solar magnetic activity).
But it is very misleading to refer to this temperature regime in the thermosphere as “Thermosphere Climate”, because it seems to imply a connection to terrestrial climate, down in the oceans and biosphere below.
The mass of the atmosphere (5×10¹⁸ kg) is only 0.004% the mass of the oceans (1.35×10²¹ kg). And the thermosphere mass is only 0.0002% of the mass of the total atmosphere.
So I don’t care how hot or cold the thermosphere gets. It will have no significant effect on Earth’s proper climate. As proof, I claim that there is really no compelling evidence of the solar cycle 11-year signal in the Earth’s temperature record. Yes, there are many theories and conjectures on how solar magnetic activity can heat or cool the climate, but no one has yet presented a compelling demonstration of this relationship.
+100
5th grade science. The outer thermosphere layer is warmer and FAR MORE VAST than the colder mesosphere meaning that the temperature change to colder is on the outer thermosphere limits but still warmer than the next colder layer down. Hmm. Does warmer air, even if slightly cooler than before, sink through colder layers?
“So that’s why the so-called “TCI” (Thermosphere ‘Client’ Index) tracks solar activity almost well. So, yes, the TCI could easily be reconstructed from solar activity measurments, because they are essentially equivalent measurements of the same process (solar magnetic activity).”
Indeed, for all practical purposes there is very little or no difference between two
file:///C:/Users/MV/MAGNET/AA-Files-new/TCI.htm
link to a comparison graph is here
vukcevic,
I believe this should be “Thermosphere Climate Index,” no?
no, it was a quote from Johanus above, hence ” …… “.
vukcevic,
Yeah, but that doesn’t mean it’s right. I should have commented on his error, but I saw yours first. Sorry.
The atmosphere also shrinks going into the minimum from less surface heat leaving, ie OLR. My F10.7cm 120 sfu HadSST3 ocean warming/cooling threshold is just below their TCI “neutral” line.
Bob can you explain why the overall oceanic sea surface temperatures have risen of late in the face of low TSI values? Do you think it is just temporary? I am very surprised they have risen of late.
HadSST3 is following SORCE TSI at the roughly the same pace now as during the SC23 decline.
TSI has climbed slightly during the last 5-6 months (first data shown is through August), driving SST3 up with it:
The 90day trend can be seen here, following 90d trends in sunspot number and F10.7:
The sun is close to 2006-2007 solar indice levels now. TSI isn’t higher than last year as RMIB shows, nor is it below the SC23 minimum as PMOD shows. SORCE v17 is likely a little too high, but not unexpectedly, imo, as we haven’t seen the lowest of activity nor duration as in the SC23 minimum, and there is an unknown amount of degradation in the instrument.
We’re just now getting our first month straight of x-ray A0.0 days, ie, the solar min is young.
The TSI 90d trend will oscillate around the zero point until it minimizes as it did in late 2008 into 2009. It will continue it’s now present downward course as long as sunspot number is zero, until new active region(s) pump it up again, which is what has happened sporadically in the last 5-6 months. I expect SST3 to exhibit a similar short-term drop in the next year as happened in 2007.
Clear sky high insolation under low TSI low evaporation/clouds is becoming a big factor again, as in solar min El Nino genesis. For instance in the last month both the sub-solar point had moved southward away from the cloudier equatorial ocean into clearer skies, and TSI recently dropped into a lower range, causing evaporation/clouds to decline, allowing Nino 12 and Nino34 both to spike upwards, then the ocean reacted with more evaporation and more clouds!
This link was meant to be posted right after the second image link above:
Here’s Nino12 and Nino34 from tropical tidbits:
Now w/labels, the right side six are in 1 year running averages, the left three in days:
In summing this up yes I expect low solar to result in lower overall oceanic sea surface temperatures which was the case until a few weeks ago. Now maybe this is just a temporary rise in an other wise down trend which I think will be the case. Nevertheless the rise has occurred which is very surprising and not expected.
I go by the data namely ocean tid bits and as of now because of this rise we can’t say overall oceanic sea surface temperatures are cooler not yet.
Again I expect we will be able to say this again in the near future.
Sill overall oceanic temperatures have risen. Why?
HadSST3 is performing as I expected wrt SORCE TSI and the seasonal change.
The annual summer bump in AMO and HadSST3 are playing out now:
The chill is in the air at the 45th parallel, so this guy needs to go cut wood…
The bottom line is overall oceanic sea surface temperatures are still over +.3c above normal which means thus far there has been no solar effect. Until they drop to at least +.1c above 1980-2010 means or lower your claim Bob, of cooling oceanic temperatures is false.
Nicely put!
Let’s see now we have the sun doing its thing from above and the AMO and PDO temp indicators working from below and a lot of biased political PR people in between. Should I a) invest in more attic insulation and new winter tires or b) dispose of all the winter clothes because the UK media, UN, NYT said so? I’ll head to the stores with my wallet even though it will take time for the AMO to fully decline. Oh, and nuts to the headline spinners and climate rent seekers.
Invest in the attic insulation, it works both ways.
In The Netherlands the 11 City Skating races(200 km) were held in the years 47, 54, 56, 63, 85, 86, 97 , 2010 was cold but just not enough for a race. All at solar minimum, maybe 2019 or 2020 looks promising.
I just had a quick look, it appears than SSN was at the low end in 5 out of 7 years quoted (71% of the time) but in 1947 and 1956 index was high; good luck 2019 & 2020.
year annual SSN
1947 151.6
1954 4.4
1956 141.7
1963 27.9
1985 18.0
1986 13.4
1997 21.5
And also in the years 1909, 1912, 1917, 1929, 1933, 1940, 1941 and 1942.
33 billion watts. Earth’s surface is 510.1 trillion m^2. That’s 6.5e-5 W/m^2. Very interesting that we can see a signal, but really? That’s off the charts insignificant.
Yes..the heat from each human body is approx 100 Watts each. So 7.4 billion people x 100w each is equal to 740,000,000,000 watts (740 billion watts). More than 22 times as much thermal heat from all human bodies on earth than this 33 billion watts of thermosphere heating. Or even twice as many watts even if the thermosphere is 10 times as much heating in its warmer phase. I guess to be fair, the heat is in very different locations and is all net cumulative but is fairly insignificant in the scheme of things. Maybe the fact that the earth’s atmosphere actually grows and contracts with this little differential is interesting, but how does that transfer any heating or cooling to the surface of the planet?
Interesting comparison. Now we know: manmade global warming is caused by too many warm bodies on this planet – China, the leading cause!
TCI, yet another measure by which the activity of solar cycle 22 (1986-96, peaking 1989-91) was the second strongest of the 20th century’s 80 year grand solar maximum, further debunking the Lockwood and Frohlich claim that smoothed solar activity was going down since the mid 1980’s.
Of course that is not the worst scientific fraud in their 2007 paper: “Recent oppositely directed trends in solar climate forcings and the global mean surface air temperature”
The bigger fraud is their claim that an anomalously high temperature forcing becomes a cooling influence on climate starting when it passes its peak (starting right when it is at its very strongest). This was stated right in their abstract:
“Here we show that over the past 20 years, all the trends in the Sun that could have had an influence on the Earth’s climate have been in the opposite direction to that required to explain the observed rise in global mean temperatures.”
http://rspa.royalsocietypublishing.org/content/463/2086/2447.figures-only
You know, like the way the day starts cooling at noon and the first day of summer is the hottest day of the year. So we have a choice, these are either the two stupidest “scientists” on the planet or the two most dishonest “scientists” on the planet (well, along with Michael Mann and a bunch of others).
Solar cycle 23 was also well above average and in a solar accumulation model would still be strong enough to cause continued warming. In general, warming from an anomalously high forcing only stops when temperatures rise enough for the increase in outgoing longwave to cancel out the heightened forcing, regardless of whether that anomalously high forcing is near peak levels or not.
Remember that this entire discussion was in the context of an explicitly incomplete understanding of how solar activity might be affecting climate. Could it be seeding cloud formation? Or changing atmospheric circulation patterns (causing the polar jet to bring cloud formations down to latitudes that cover much more territory)? The question was whether there might there be relatively large solar-magnetic effects in play.
“No, because they would have been past their peak when warming was still occurring,” is a WRONG answer, but it is THE answer that the consensus came up with. It is in the IPCC reports, it has been repeated by numerous individual scientists, by numerous scientific groups. A partial list here:
http://www.crescentofbetrayal.com/ClimateEmai_citations.htm
Alec,
Why exactly do you think Lockwood and Froelich are stupid or dishonest? I’m curious.
I’m curious. Was this one of those imperatives like where somebody tells you off for five minutes and you reply, “Don’t hold back, tell me how you really feel.”?
BCBill,
No.
“Solar cycle 23 was also well above average and in a solar accumulation model would still be strong enough to cause continued warming.”
_____________________________
That’s fine if the heat has somewhere to accumulate. Where might that be though? We already know it wasn’t the oceans. If ocean-stored heat from past solar cycles was the cause of the recent observed surface warming, then we should have seen a concurrent reduction in ocean heat content. This didn’t happen. Oceans have continued to gain heat over the same period that the surface has warmed. So where did the heat in this “solar accumulation model” accumulate? How was it released?
There is a claim that the oceans have warmed.
However the claimed warming is so far below the resolution of the instruments being used that it is not credible.
Only someone interested in propaganda rather than science would make such a claim.
Ahhh! A front row seat to witness a deeper minimum solar cycle, with satellite instrumentation feeding us relevant information! Could it get any better? More popcorn, please! And another Killian’s Red!
Hmmmm. Wondering if 2.5 full cords of dry firewood is enough for this winter…..
Bingo!
Yes, it will be interesting…..
https://finance.yahoo.com/news/natural-gas-storage-deficit-5-143702182.html
it’s worse than we thought in the uk. 2 weeks seems to be the latest estimate. another winter like 2010 won’t be pretty.
Yes, weather predictors have seen American Indians stock piling more wood this year so that would indicate a colder winter on the way.
@JMac;
My in-laws have a place in Montana. Typical usage when they were there all year ’round was 4 or 5 cords in the winter.
J Mac September 28, 2018 at 1:07 pm
Mac I have 2 cord and I live in N.W. AZ.
I expect to use most of it.
michael
That’s not even enough power to activate one flux capacitor. Boo!
Thank goodness! I live in the National Capital Region and we are presently 1.8C above the 1980-2010 mean and this summer (and last summer, and the summer before) was _bloody_hot_! Add to that the prediction that we will have 30+ more days above 90F in 20 years and I was fixin’ to move to Canada!
Could be worse; I used to live in Phoenix. The day we arrived in 1979 it was an all-time high of 114F. Last year Phoenix broke its record of 110F+ days, and are predicted to have more than 240 days above 90 in 20 years.
I can now sleep soundly (with the windows open) from now on!
September in Calgary has been the coldest I can remember. I have lived here 54 years.
c’mon, folks… I doubt that the climate system would be any different if there was no thermosphere at all. The amount of mass at that altitude is vanishingly small… MUCH, MUCH smaller than would every show up on barometric pressure measurements if it suddenly disappeared. You might as well call it outer space.
Which is why, though a thermometer would show HOT HOT HOT temperatures, we would feel cold because air molecules are so far apart we would rarely run into one.
How much infrared would be around since we feel infrared (as anyone who has sat under the infrared heater at the hockey arena can attest to).
I’m not well versed in the science, but wonder how the shrinkage in total atmospheric volume dovetails with the current global atmospheric temperature, specifically the UAH satellite record.
Thank you, Dr. Spencer. You just fortuitously answered my question.
Even stock market crashes correlate with that graph of TCI minimas… except when they don’t.
As this is soposed to be the climate-wether sitre can we have less discussion about English grammer. For a start English is a mix of many different languages over its 300 year history, so odd things in grammer should be expected.
Re. the cooling of the upper atmosphere the Greenies will want it both ways. If it suits them then cooling simply proves that their measures were at last working, so keep up the anti this and anti that. But if warms just a little then even more effort is needed to save the planet.
MJE
Curmudgeon!!!
This is a pretty nice little review of the historical background of studies looking at the effects of sun on climate:
https://history.aip.org/climate/solar.htm
“The continuing satellite measurements of the solar constant found it cycling within narrow limits, scarcely one part in a thousand. Yet the global temperature rise that had resumed in the 1970s was accelerating at a record-breaking pace, chalking up a total of 0.8°C of warming since the late 19th century. It seemed impossible to explain that using the Sun alone, without invoking greenhouse gases.
…” Paleontologists’ studies of isotopes stemming from cosmic rays continued to show a rough connection with the Medieval and Little Ice Age climate anomalies. And an especially neat study of deposits in a cave in China found a solid correlation between weather and solar activity spanning the past two millennia. However, the correlation had broken down after 1960, just when greenhouse gases began to kick in — evidently overwhelming weaker influences. Painstaking studies simply failed to find any significant correlation between cosmic rays and cloudiness.”
…When Foukal reviewed the question in 2006, he found no decisive evidence that the Sun had played the central role in any climate change, not even the Little Ice Age. The cold spells of the early modern centuries, experts were beginning to realize, could be at least partly explained by other influences. For one, a spate of sky-darkening volcanic eruptions that had triggered a period of increased sea ice which reflected sunlight from the North Atlantic region. Even more striking was evidence that the CO2 level in the atmosphere had dipped during those centuries — perhaps because so much farmland had reverted to carbon-absorbing forest as a result of plagues, including the Black Death in Eurasia and smallpox in the Americas. The greenhouse effect, even back then, looked like the dominant influence. [Interesting hypothesis.]
“Still, many experts thought it likely that the Maunder Minimum of solar activity could have had something to do with the early modern climate anomalies, contributing perhaps a couple of tenths of a degree of cooling. One theory, for example, held that the changes in ozone (less ultraviolet=less ozone=less warming in the stratosphere) would have had a particularly strong effect on the Northern Hemisphere jet stream. This particularly affected the weather in Europe, the classic location of Little Ice Age cold spells: perhaps low solar activity did make for colder winters there. Whatever the mechanism, a group convened in 2012 concluded that solar ultraviolet variations had mainly regional effects and could “contribute very little to global temperature variations.”(57b*)
A few scientists persevered in arguing that much smaller solar changes (which they thought they detected in the satellite record) had driven the extraordinary warming since the 1970s. But even among these outlying groups, leaders admitted that in the future, “solar forcing could be significant, but not dominant.” Nevertheless the argument that solar activity was the true cause of global warming continued to circulate. It was one example of the indestructible “zombie” theories that plagued discussions. As it happened, solar activity sank to historic lows after 2005. Some prominent figures among the opposition to regulating greenhouse gases publicly predicted rapid global cooling.”
“Zombie” theories. Hadn’t heard that one before.
Where’s the cooling the “opposition” predicted?
But Kristi, you just copy/paste your selective bias, the same thing you accuse denialists of doing. The fact that we have been in a Pause the last 18-19 years whilst the CO2 accumulation has been the highest per annum in recorded history should have met some of the predictions made when this climate scare began in the late 1980’s. If you think GHG’s and CO2 in particular is the magic control knob for global warming and hence climate change, how do you account for no appreciable warming these last 2 decades. What has been reported as some of the highest ever record breaking temperature seasons the last 25 years have been calculated to the tenths or hundredth’s of a degree and then averaged over the planet. Hardly perceptible, let alone truthful, assuming the adjustments were even done honestly. We need to collect raw data on the weather and climate and ensure it is accurate, so that we can deduce climate behaviour and signals from the honest data. I am sure we can agree on that, although it is very apparent the cart is before the horse regarding the academic-political agenda and media coverage of said subject.
“If you think GHG’s and CO2 in particular is the magic control knob for global warming and hence climate change, how do you account for no appreciable warming these last 2 decades.”
I make that 0.2C increase (linear fit) in the last 20 years.
And that product is a cold outlier amongst the tropospheric temp products.
Which cannot take account of the extra warming over land due the GHE being greatest at night under low-lying inversions.
The answer to your incredulity is that until the 15/16 EN there was a prolonged -ve PDO/ENSO regime.
Natural variation that partially overcame the long-term GHE trend.
And it’s not “magic” – it’s basic physics. CO2 is a GHG and as such it provides an “impedance” to exiting LWIR. Same as water – the amount of which, as it condenses out and falls as rain/snow, is a function of atmospheric air temp. A CO2 does not condense and rising levels will raise tropospheric temps as its concentration does not meet a temperature limit as does water. That is why it is a control knob. The primary one is, however the earth’s eccentricity in orbit and orientation around the Sun.
Oh, and the “magic” also extends to “greening the Earth”.
That’s not hard for you believe is it?
‘That is why it is a control knob.”
No, CO2 is not a control knob. Look at a graph from 1945 to 1980, and there was cooling, while CO2 levels rose in earnest. Talk about selective graph bias, claiming a .2 increase in 18 years. Start that graph in 1998, two years earlier, and there was cooling. 1/5 a degree C increase in any event, taken out of context with regards to the industrial era years when the evidence says at best a .8 degree increase in 150 years is not a lot to bark about. This is all in the range of natural variability in any event.
But you are right about this…’The primary one is, however the earth’s eccentricity in orbit and orientation around the Sun.’ Obviously, as well as CO2 “greening the Earth”. You got 2 out of 3 right, but CO2 is not a control knob, albeit it has a very slight properties as a weak trace GHG, but a 2nd order magnitude effect as compared to water vapor.
Earthling2
“But Kristi, you just copy/paste your selective bias, the same thing you accuse denialists of doing.”
Baloney. I thought the whole article was an interesting history of the scientific research behind solar effects, and it shows that they have been studied for decades. I posted the excerpts I did because they seem most directly relevant.
“The fact that we have been in a Pause the last 18-19 years”
Are you dismissing the data from the last few years? And why would you start a trend line in 1998, a strong El Nino year?
“If you think GHG’s and CO2 in particular is the magic control knob for global warming and hence climate change, how do you account for no appreciable warming these last 2 decades.”
I don’t think there is a “magic control knob.” GHG levels are just one of the factors that influence climate. I’ve always admitted I don’t know how all the factors interact – I think it’s humanly impossible to conceptualize them along a space-time continuum, which is why models are valuable, even if they aren’t perfect; no one argues they are. And no climate scientist expects that temperature will increase in direct proportion to GHGs.
“We need to collect raw data on the weather and climate and ensure it is accurate, so that we can deduce climate behaviour and signals from the honest data”
I don’t know who you mean by “we.” Scientists have collected this data. Scientists have found errors in it, and either fixed them or deleted the data points. Scientists have found systemic biases and corrected for them. Scientists have looked at the statistical offset between data collected by different instruments, and accounted for them. Scientists have used statistical methods to infill missing data where there are no stations. Perfect? No, of course not. Adequate to estimate reality? I believe so. “Honest data”? Yes, I think so. I believe the vast majority of scientists do honest science. Since so much is replicated by different groups, they risk their careers by engaging in fraud.
Anthony has explained some of the physics better than I could. I add this graph looking at aerosols and temperature:

“I’ve always admitted I don’t know how all the factors interact” says Kristi.
I think thats a very wise position to take, as climate mechanics are exceedingly complex. Anyone who says they have the final answers are delusional. That is why climate science should never be consensus based, and that the Science should never be settled.
“I don’t know who you mean by “we.” says Kristi.
I mean human kind in general but science in particular. The human race needs to concentrate on collecting a lot more raw data and preserve it intact for present study and for future generations. Just think if we had more intact climate data that was accurate from all over the world for the last 4-5 centuries. We would be able to stitch together a much better understanding of long term climate history and understand present weather and climate much better which would assist us in better predictions into the future. The one thing I really do support is more scientific instrumentation and data collection from all over the planet. Data is the domain of science. More is better.
Earthling2,
” That is why climate science should never be consensus based, and that the Science should never be settled.”
Climate science is not consensus based. But the consensus is important. Agreement among many climate scientists is significant, it’s an indication that their is lots of evidence for AGW. That’s why people should listen and take appropriate action (what that action is, is a different question).
Science is never “settled.” It’s a tenet of science that it never “proves” anything. But that doesn’t mean it can’t be interpreted as extremely probably correct – that’s when it becomes a scientific “theory.” Evolution and relativity are good examples – they are theoretically sound and well-supported by a range of evidence. So is AGW. “C”AGW is a different matter. “Catastrophic” isn’t a scientific term.
Data is always good.
Earthling2,
Oops, I mean data are always good.
Michael,
” If it suits them then cooling simply proves that their measures were at last working,”
I doubt it. That could lead to complacency. Besides, when the surface temperature keeps warming, do you really think Greenies would care about what’s going on in the upper atmosphere?
Kristi What is happening in the upper atmosphere was predicted by climate models and is a clear signature of the GHE.
The troposphere is warming
http://images.remss.com/data/msu/graphics/TLT_v40/plots/RSS_TS_channel_TLT_Global_Land_And_Sea_v04_0.png
The stratosphere is cooling
http://images.remss.com/data/msu/graphics/C12/plots/RSS_TS_channel_C12_Global_Land_And_Sea_v03_3.png
Jack,
Thank you! Much better reply than mine!!!
Michael,
English of 300 years ago would be intelligible today. Most present English speakers could understand most English dialects of 500 years ago. Six hundred, not so much.
The Angles, and their Saxon, Jute and Frisian neighbors, speaking mutually intelligible dialects of the same language, left the Continent for Britain over 1500 years ago.
Earlier this year, I ran a Pearson product moment correlation of sunspots and temperatures from 2000 to 2016.
r = -0.11
The scattergraph
http://www.pbase.com/jackdale/image/168187280.png
Why is the TCI not indicating a warming earth if the energy loss now is only 10% of what it was at the solar peak?
The overall solar energy input to the earth changes very little, less than 1% as far as we know, so if the earth’s outflow declines, more energy must be getting absorbed by the earth.
Note the vertical scale on the “thermosphere climate index”. The change is a few 10^11 Watts…. emitted by the entire thermosphere. Total OLR emitted by the Earth: 240 W … W/m2. Radius of Earth 6.37*10^6 m. Surface Area. 510*10^12 m2. Total power emitted by Earth 173000*10^12. So the change in emission from the thermosphere is about 1/1,000,000 of the Earth’s entire emission. Really important to our climate.
CAGW sycophants will soon find it impossible to rectify record 21-century CO2 emissions with flat/falling global temp trends.
Already, CMIP5 average global temp projections have exceeded reality by over 2 standard deviations for almost 20 years, and when a Grand Solar Minimum starts from 2020, and the PDO/AMO/NAO are all in their respective 30-year cool cycles from the early 2020’s, global temps will fall.
Almost all the global warming recovery we’ve enjoyed since 1850 can be attributed to: the strongest 63-year string of solar cycles in 11,400 years (1933~1996), LIA recovery, and PDO/AMO/NAO 30-year ocean warm cycles.
It’s the sun, stupid…
By the end of 2021, I expect low solar activity, cool ocean cycles and a strong volcanic event to cause a 25-year global temp hiatus to reappear, which will be impossible for CAGW alarmist to logically explain.
I’m sure there will be a plethora of papers hypothesizing that global warming is causing global cooling, but these will be laughed at.
We’re definitely entering the beginning of the end phase of the biggest and most expensive Leftist hoax in human history…
SAMURAI,
I right with you there. Winters of the 1960-1970s again anyone?
What goes around, comes around. The weather and climate are no different. What scares me is whether this next cooling trend will be another Little Ice Age repeat, but only progressively colder with each major cooling event until all the conditions align to start another ice age. It probably takes 1000’s of years to do so, but just as we reached the azimuth of warming in the early Holocene 7000-8000 years ago, it seems every cooling trend such as the last LIA gets progressively colder. We are definitely on the far side of this Interglacial. Let’s hope the .8 C that has warmed up the last 150 years will assist in staying a warmish climate. The alternative is far worse.
With a weak solar wind, the level of galactic cosmic ray increases steadily. This radiation is concentrated in regions around magnetic poles and in regions of the Earth where the Earth’s magnetic field is weakened.


I don’t think the thermosphere affects the troposphere temperature. The thermosphere is already in “space” since ISS orbits at 400 km altitude in the thermosphere. Since gas density is very low, the kinetic temperature does not represent thermometer temperature, which varies from negative 150 C to 120 C. Direct exposure to sunlight has far greater effect on temperature than kinetic temperature of gases.
It’s not about the temperature, it’s about the waves that are in the whole atmosphere. They are particularly visible in the winter within the polar vortex.
Brief Introduction to Stratospheric Intrusions
Stratospheric Intrusions are when stratospheric air dynamically decends into the troposphere and may reach the surface, bringing with it high concentrations of ozone which may be harmful to some people. Stratospheric Intrusions are identified by very low tropopause heights, low heights of the 2 potential vorticity unit (PVU) surface, very low relative and specific humidity concentrations, and high concentrations of ozone. Stratospheric Intrusions commonly follow strong cold fronts and can extend across multiple states. In satellite imagery, Stratospheric Intrusions are identified by very low moisture levels in the water vapor channels (6.2, 6.5, and 6.9 micron). Along with the dry air, Stratospheric Intrusions bring high amounts of ozone into the tropospheric column and possibly near the surface. This may be harmful to some people with breathing impairments. Stratospheric Intrusions are more common in the winter/spring months and are more frequent during La Nina periods. Frequent or sustained occurances of Stratospheric Intrusions may decrease the air quality enough to exceed EPA guidelines.
http://www.cpc.ncep.noaa.gov/products/stratosphere/strat_int/
The stratosphere ends at 55 km altitude. The thermosphere begins at 80 km altitude. The mesosphere separates the two atmospheric layers. Do not confuse the two.
Waves run through all layers of the atmosphere.
http://www.cpc.ncep.noaa.gov/products/stratosphere/strat-trop/gif_files/time_pres_WAVE1_MEAN_ALL_NH_2017.png
Stratospheric intrusions in the period of low solar activity during the fall-spring period over North America are accordance with the geomagnetic cutoff.
http://sol.spacenvironment.net/raps_ops/current_files/Cutoff.html
Your chart shows up to 50 km height. That’s the stratosphere. It’s not all layers of atmosphere.
Can not you see that the wave is above the stratosphere? It does not start suddenly in the stratosphere. What’s more, it’s stronger in higher layers.
http://www.cpc.ncep.noaa.gov/products/stratosphere/strat-trop/gif_files/time_pres_WAVE1_MEAN_ALL_NH_2018.png
North America is not protected from stratospheric intrusion.

There is no “above the stratosphere” in your chart. It’s speculation.
I should have looked at this NASA graphics closely. My guess is correct. Thermosphere does not affect troposphere temperature. The solar max and solar min temperatures converge at the mesophere down to troposphere.
“We suggest that the TCI are valuable new solar-terrestrial indexes due to the information they contain about the global thermosphere and due to their ease of calculation from standard indexes. Specifically, given dynamic range of the TCI associated with NO cooling, and its significant dependence on both solar irradiance and geomagnetic processes, we recommend that it be included henceforth as a new, standard solar-terrestrial Index.”
https://www.sciencedirect.com/science/article/pii/S1364682618301354?via%3Dihub
Shrinking of the thermosphere during the weak solar wind must cause waves in the whole atmosphere. The solar wind is not constant and always creates waves in the atmosphere.
http://www.cpc.ncep.noaa.gov/products/stratosphere/strat-trop/gif_files/time_pres_TEMP_MEAN_JFM_NH_2018.png
I’m learning a lot from you, ren. 🙂 Keep up the good work.
I think the important part of this study has nothing to do with the temperature of Earth’s atmosphere, but rather that the shrinkage of the Earth’s atmosphere, caused by reduced solar activity, may be connected to the jet streams and how they behave, which definitely affects the Earth’s weather.
Thanks. Look at this page.

http://www.cpc.ncep.noaa.gov/products/stratosphere/strat_int/
“Stratospheric Intrusions are when stratospheric air dynamically decends into the troposphere and may reach the surface”
Stratospheric air is far from thermospheric gases. All the charts show up to 50 km height or 100 hPa pressure.
Six years ago, three studies linked the meandering of the jet stream to the loss of Arctic sea ice.
Francis, J.A., and S.J. Vavrus (2012), “Evidence linking Arctic amplification to extreme weather in mid-latitudes,” Geophysical Research Letters, 21 February, 2012.
Jaiser, R., K. Dethloff, D. Handorf, A. Rinke, J. Cohen (2012), Impact of sea ice cover changes on the Northern Hemisphere atmospheric winter circulation, Tellus A 2012, 64, 11595, DOI: 10.3402/tellusa.v64i0.11595
Liu et al. (2012), “Impact of declining Arctic sea ice on winter snowfall”, Proc. Natl. Academy of Sciences, Published online before print February 27, 2012, doi: 10.1073/pnas.1114910109
One of the et al’s in the last paper is Judith Curry.
“Our study demonstrates that the decrease in Arctic sea ice area is linked to changes in the winter Northern Hemisphere atmospheric circulation, said Judith Curry, chair of the School of Earth and Atmospheric Sciences at Georgia Tech, in a press release. “The circulation changes result in more frequent episodes of atmospheric blocking patterns, which lead to increased cold surges and snow over large parts of the northern continents.”
Jack
They did say that and I’ve pointed out repeatedly that the meandering began to increase around 2000 when the sun became less active.
Throughout the warming period up to 2000 Arctic ice decreased but the jets were more zonal. If they were correct the jets should have been meandering more since the early 1980s but they didn’t. Indeed, more zonal jets were supposed to be a result of man made warming and now they claim the opposite.
Those speculations by AGW believers are inconsistent.
There are been a dramatic decline in Arctic sea ice since 2000.
Curry would object to your characterization of her.
Nonsense. Your “2012 graph” cuts off the six last years of data from a total satellite record itself only 39 years long!
And it deliberately (dramatically) stops at the low point of 2012.
Worse, the NSIDC-GISS-NOAA extrapolate a simplistic straight line into the far future – starting at a point ABOVE the starting years of 1978-79-80-81-81! … ending WELL BELOW even the truncated final years’ of measured sea ice extents!
September minimum Arctic sea ice extents have NOT declined at all since 2007: for 12 years now the daily sea ice extents for the entire month of Sept have not only been steady, but for the recent 4 years (2015, 2016, 2017, and now 2018) they have been increasing slightly.
More recent data for you
On September 19 and 23, 2018, sea ice extent dropped to 4.59 million square kilometers (1.77 million square miles), tying for the sixth lowest minimum in the satellite record along with 2008 and 2010.
This year’s minimum extent ranked behind 2015 (fifth lowest), 2011 (fourth lowest), 2007 and 2016 (tied for second lowest), and 2012 (lowest). Moreover, the twelve lowest extents in the satellite era have all occurred in the last twelve years.
http://nsidc.org/arcticseaicenews/
Yeppers. Right in the middle of recent years’ sea ice minimum. Not “declining at all!
The average areas for the entire month of September show a slight increase since 2015.
Which is exactly what would be expected for a 60-70 year periodic Arctic Sea Ice oscillation.
Do we know the exact period and amplitude of that Arctic sea ice oscillation yet?
No. We have now accurate data for just over 1/2 the most likely period. Enough to prove it is NOT linear decline, but not enough to establish accurate cyclic values. Enough to estimate values? Probably. But the NSIDC cannot afford to admit that cycle.
Typical NSIDC linear graph from 2014, it continues the pattern you showed for 2012.
http://nsidc.org/arcticseaicenews/2014/10/2014-melt-season-in-review/
This year, 2018, the NSIDC graph prominently highlights the “higher year” of 2014, but excludes the “smaller” sea ice minimums of September 2007, 2008, 2010, 2011. Those are not the visuals they need to show/want to show the public.
http://nsidc.org/arcticseaicenews/2018/09/arctic-sea-ice-extent-arrives-at-its-minimum/
Typical NSIDC nonlinear graph:
Again: Nonsense.
That is a daily graphic of Arctic sea ice extents for only few months of only one year, with two selected years added. The “linear trend” used by NSIDC (and any others) to extrapolate CANNOT be shown on a graph with only one year’s data! All they are doing (all you are doing) is drawing lines stacked on top of one another.
Here add all the years you desire:
https://nsidc.org/arcticseaicenews/charctic-interactive-sea-ice-graph/
Yes. I read that chart every day. Did you notice the “default” Antarctic Sea Ice presentation very cleverly eliminates the record-high Antarctic sea ice extents – a year which recorded a positive sea ice anomaly in June for Antarctica LARGER than the entire area of Greenland! Removed from the record on opening the chart. As is 2010 (above average) 2011 (above average), 2012 (above average) ….
I prefer the Cryosphere graphs, been using them since 2007.
Guess what? These charts (and the daily spreadsheets you did NOT link to) are the source for the observation: Arctic Sea Ice Extents have been steady (not declining!) for 12 years now, almost 1/3 of the entire satellite record. 1978-1982 were increasing towards a maximum, 1982-83-84 were a high point, 1985-2006 saw a decline. Your straight line extrapolation is valid only for 21 years of the entire record – almost half of the sea ice record shows your straight line is wrong. (Even the Greek’s earth-centered solar model predicted planetary positions more accurately than that! )
What part of “line of best fit” do you not understand?
https://www.xkcd.com/2048/
“Look at me! I drew a straight line through the data!”
Ice volume decline
http://psc.apl.uw.edu/wordpress/wp-content/uploads/schweiger/ice_volume/SPIOMASIceVolumeAnomalyCurrentV2.1.png
You are proving your nonsense.
Another simplistic straight line PIOMASS (modelled values, based on assumed sea ice thickness) extrapolation – beginning ABOVE the first data poiints, drawn straight down to end BELOW the latest data points.
Actually, your PIOMASS extrapolation proves my point: A broad high period back between 1980-1984, a steady decline from 1985 to 2010, and now 8 years of a broad steady (not-decreasing!) valley!
RACoookPE1978 says: “September minimum Arctic sea ice extents have NOT declined at all since 2007”
..
September 2012 was below September 2007 (note words “at all” in quote)
..
https://www.bing.com/th?id=OIP.xHmjztOjm_5GlewpOhe4nAHaDt&pid=Api
True. And irrelevant at the same time.
In trend analysis, one year does not mark a trend. It does highlight a trend, just like the Arctic sea ice peak back in 1982-1983 cannot be used to show what sea ice used to be in the 1890’s, 1910’s, 1920’s, 1950’s, nor 1960’s. Climate trends need to come from longer periods than that – but cyclical climate trends for a 60-70 year phenomena CANNOT be based on a textbook “30 year average” either.
RACookPE`1978 says: “one year does not mark a trend.”
…
True.
….
But then when you say: ” but for the recent 4 years (2015, 2016, 2017, and now 2018) they have been increasing slightly.”
…
I say “FOUR YEARS DOES NOT MARK A TREND” (either)
To repeat, 12 years of data (now 1/3 of the 39 year record), DOES prove the negative: a linear extrapolation is wrong.
A simple question
Has there been a decline in Arctic sea ice extent and volume over the period during which data has been recorded?
BTW – The straight line is a line of best fit.
Yes. But you are “measuring” August temperatures based on a simplistic straight line extrapolation of the Sept-Oct-Nov-Dec “measured temperatures” – Obviously, the temperatures in July and August will be so cold nitrogen will thicken and CO2 will freeze!
You are afraid to ask (much less answer) the real question: Will there be a continuing decline in Arctic sea ice extent and volume over the next 38 years?
Many major shipping companies are counting on a decline in Arctic sea ice as they ramp up their plans to make extensive use of the Northern Sea Route and, to a lesser degree, the North West Passage.
https://thebarentsobserver.com/en/industry-and-energy/2018/08/80-increase-northern-sea-route
Again, nonsense.
The Northwest Passage – if it opens at all – will be open for navigation 3-4 weeks a year – and requires the shipping company to ACCURATELY and ABSOLUTELY be certain of getting their ships through the narrow, twisting island passages in those three-four weeks. If they miss by even one day, the ship (and its cargo are trapped up north for another year, or trapped for weeks trying to turn around and get out back to navigable waters to go around Cape Horn, the Panama Canal, or Cape of Good Hope. Voyages MUST be loaded 5-6 weeks ahead of time before ANY “weather” up north can be predicted. Voyages through the NorthWest Passage is committed as soon as the ship leaves the European ports and either “head north” or “turn south”. If they choose the wrong way, they lose everything – ship, cargo, time, and possibly the crew. The oil from a sunken ship represents hundreds of millions in pollution fines and bad publicity if spilled.
And for what gain? One week faster delivery is cheaper – but at what cost for failure?
Cruise ships and publicity? At $15,000.00 USD per person per room there’s a LOT of profit motive for enviro exploiters!
The link I provided was to the Northern Sea Route.
Yes, and the Northern Sea Route has definite commercial possibilities as long as that very narrow Bering Sea bottleneck is open – and the Northern Sea route was used during WWII at great hardship and expense, and as it was during the Soviet exploitation of their north Siberian coastal communities and their Siberian gulags and prisons.
But the “world” sees only the Northwest Passage over top of Canada. That is what they have been taught to consider.
This year the NWP was anomalous. The passage was closed by wind-driven ice.
Check out the trend in the number of yachts that have made the transit.
https://www.spri.cam.ac.uk/resources/infosheets/northwestpassage.pdf
Last year one yacht, Northabout, transited both the NSR and NWP in one season.
http://polarocean.co.uk/
Tell that to the company scheduling a 100 million dollars of unrecoverable cargo and profit it MUST SHIP, and which MUST LEAVE PORT weeks ahead of any “anomalous closings.” Commercial traffic through the NorthWest Passage – even as far back as the Manhattan icebreaking oil tanker modifications – is “barely possible” in a few recent years for small personal yachts, but not prudent in any year for any commerce.
Like the Nordic Orion?
https://nationalpost.com/news/canada/northwest-passage-crossed-by-first-cargo-ship-the-nordic-orion-heralding-new-era-of-arctic-commercial-activity
Jack Dale
You are making my point: From YOUR link, (cleverly not provided other readers …)
So, it will “save” $ 200,000.00 by using the NorthWest Passage to save 4 days of travel time, with the Canadian government absorbing the cost of $50,000.00 per day (Canadian) charges for the escorting icebreaker that are required FOR THE ENTIRE TRIP! Even if 4 days x 50,000.00 per day = $200,000.00 reduction in fuel cost, the full cost of the icebreak is picked up by Canada’s CAGW-publicity stunt politicians that added 12-20 days to the ice breaker to go north, cross the NW passage (one-way!) and then be on the “wrong coast” when the winter resumes. Now, how are you going to get the icebreaker home to their families and children? The passage is blocked up after one trip.
I asked the Canadian Coast about about the escort that was provided to the Nordic Orion. This is their response:
“Is record in the Operations Data Information System
He Escort/Assist trough ice covered waters the Nordic Dorion for 35h55min in the Parry Channel from sept 20 to sept 22 2013”
35h55min is not the entire voyage. The Parry Channel is a small portion of the voyage.
This is what the escort looked like:
http://www.nordicbulkcarriers.com/images/Media/NWP-Galleri/thumbs/thumb_4.jpg
Not much ice in the photo.
You should try doing some research before posting your baseless assertions.
Now, how many days did it take for the icebreaker to get to the Parry Channel?
How many days/hours did the icebreaker spend waiting for the (single) commercial ship to some up, form up, and begin the convoy operations?
How many days did it take for the icebreaker to get back from the Parry Channel to its home base?
How many years will that ” continuous escort requirement” be only needed for 35 hours?
Now, when two commercial ships require escort, how many days will be spent waiting for that convoy to form up and traverse?
I’ve escorted convoys and groups of ships before across oceans, in and out of close quarters. It is not like you apparently think from this one publicity stunt by an enthusiastic Canadian government in an economic war against the larger Russian north sea fleet and their far-easier Northern Route. Commercial ships are not the small yachts sailed by cruise lines sailing through here in easier times.
The Louis St Laurent was on station in the Arctic, as she usually is in the summer when she has many other duties.
Jack Dale (rejoinder about Northwest Passage, Northern Passage)
Jack Dale (original comment about Arctic Shipping.)
My replies remain as-stated.
Nordic Bulk Carriers are planning more extensive use of the NWP.
http://www.nordicbulkcarriers.com/services/nwp-project
A linear interpolation of a data set cannot be “wrong.” It is a mathematical operation on the data. What is wrong is you “seeing” a trend in 12 years of data.
Obviously Mr RACookPE1978, you are confusing “interpolation” with “extrapolation.” The presented graphics do not show “extrapolation.”
To the contrary. I am deliberately using “extrapolation” (of the NSIDC’s simplistic straight line “interpolation” of the data) BECAUSE they are the ones who are predicting “gloom and doom and disaster” IF their preferred straight line trend continues. The NSIDC MUST HAVE continually declining Arctic sea ice in the near future (before the 2020 presidential elections) and far future (for their future funding of more expeditions and labs and computer centers) because a continually declining Arctic sea ice trend now is the only thing can be used as “evidence” of their CAGW theory.
The NSIDC graphics do not show any extrapolation. The graphics do not predict anything. Please stop injecting your prejudices and politics into the actual data being displayed.
Then, stop “letting” the NSIDC and the entire CAGW catastrology community extrapolate the Sea Ice trend into the future for politics and funding and power. THEY are ones who are extrapolating a straight line. “I” am merely pointing out the fact that their favorite charts and your straight-line graphs are simplistic linear trends drawn with no more accuracy and forethought than 6 months of temperature data. (More likely, these simplistic straight-line graphs ARE drawn with deliberate foresight for funding and political purposes.)
The NSIDC does not extrapolate. The linear trends shown in the graphics are interpolations of the collected data. What people do with that data afterwords is beyond the control of the NSIDC.
Sereeze uses these straight-line extrapolations for profit and funding and publicity, doesn’t he? As do every other “arctic” or “climate research” group receiving federal, state, and foundation grant money. Name those NSIDC-NOAA-GISS-NASA-NSA outputs (paper or web-based product) that do not predict future sea ice loss, or predict future harm from continued sea ice loss.
RACookPE1978, this web based graphic from the NSIDC makes no prediction: http://nsidc.org/data/seaice_index/images/daily_images/N_stddev_timeseries.png
C. Paul Pierett
Nonsense.
To repeat, that is NOT a plot of sea ice trends. It is a daily plot of the sea ice, with an average and a single year plot added.
If you wish, even THAT PLOT “extrapolates” the “trend” for each day by superimposing an outdated (1980-2010 !) “daily average” as the baseline for calculating the standard deviation for each day’s sea ice extents, and plotting those false std deviations on top of the daily chart values. Thus, graphically “showing you” that sea ice has declined catastrophically since satellite measurements began, and sea ice extents “continue to remain below historical daily averages” for the year. Which is their intent.
RACookPE1978’s exact quote: “Name those NSIDC-NOAA-GISS-NASA-NSA outputs (paper or web-based product) that do not predict future sea ice loss, or predict future harm from continued sea ice loss.”
…
This is an NSIDC output (web based): http://nsidc.org/data/seaice_index/images/daily_images/N_stddev_timeseries.png
…
You can’t move the goal posts …..my link fulfills your request because your request does not mention anything about “trends.”
…
And no, that link has no “extrapolation” in it at all.
Wrong. On all counts.
“Declining arctic sea ice extents” IS a trend. By its very nature, it is a trend. The “threat” from continued arctic sea ice loss can ONLY BE in the future, IF the trend continues.
The link in question creates the “trend” (deliberately) by superimposing the 2018 arctic sea ice on the same graph as the 1981-2010 “daily average” arctic sea ice, and adding the two std deviation bands around that “average” as if the past std deviations were to be accurate today.
2 SD below the mean indicates that 97.8% of the historic records are above that data point.
Jack Dale
Your phrasing is poor, but can be interpreted to mean: “Today’s daily arctic sea ice values are more than 2 std deviations below the 40 year-old mean daily arctic sea ice values, therefore today’s Arctic Sea Ice values are abnormal, and therefore today’s Arctic sea ice values represent a “problem” that must be “solved”.”
Nice try. But again, nonsense. (More properly, “Not sense”.) Even your “definition” is incorrect: From Wikipedia:
We will assume you do mean “2 std dev” and thus 95% probability that any given data point likes within the +/- 2 std dev band.
In detail, for any measured value to fall out past the “two standard deviation” statistical “rule” means that several things HAVE TO BE fullfilled first.
And none of these prerequisites are met.
1. The “average” for the +/- 2 std dev band must be available, must be constant over the period, and must be correct.
2. Enough data must be measured for a valid calculation of the std deviation.
3. The measured values MUST BE randomly distributed around the mean of the data by a Guassian (random) distribution – If the data are perturbed about the mean, then the two std deviation rule is meaningless. Simply put, the data must be “standardly distributed” about a “standard mean” to have a “standard deviation” from that “mean” used as a metric.
Arctic Sea Ice extents, means, and the plotted arctic sea ice standard deviations meet none of these criteria. Worse, from your standpoint as an argument that CAGW is somehow a “problem/crisis/opportunity/catastrophe”, even the acknowledged “problem” of low Arctic sea ice values means the opposite of what you think it means. Less arctic sea ice from today’s sea ice extents means more heat is lost from the newly exposed Arctic Ocean over the course of 12 months of over an entire year than is gained in the 5 months of 24 hour sunshine.
The graphic in question does not show any “trend.” All it shows is that today’s level is below average. It doesn’t show anything about last year, nor the year before that.
Thermosphere is not the whole atmosphere
The air pressure at TOA (10 km height) is 23,000 Pa. The solar wind pressure is 0.000000006 Pa. It’s like a fly landing on the back of an elephant and the elephant falling on its knees.
@ Dr. Strangelove
“It’s like a fly landing on the back of an elephant and the elephant falling on its knees.”
Or maybe not at all!
Maybe it’s more like a small balloon with high pressure, inside a slightly larger balloon with slightly lower pressure, inside a slightly larger balloon with slightly lower pressure …. etc.
Now just slap the outer balloon slightly, don’t all the others inside move?
And if that slap is replace with lowering the outer balloon’s temperature a little so the outer balloon shrinks a little, does not that too affect (stress) all the other balloon layers.
Elephants be damned! Adjust your imagination.
And consider this. Infrared heaters do not heat air. They heat objects which then heats the air in a room because of conduction. All IR moves at the speed of light. The 18.5W/m^2 from the surface that crashes into the CO2 and the water vapour is moving at 186000 miles per second. Notice that this 18.5W/m^2 represents a little over 11% of the solar that actually hits the earth and oceans. After crashing into the radiant GHG’s, over 50% of it is directed upwards and outwards as the GHG’s are isotropic molecules which radiate in all directions. So the ~49% that heads downwards at 186000 miles per second either crashes into a radiant GHG on the way down or crashes into an O2 or N2 molecule, or else misses them all and makes it back to the earth’s surface. However there are 2457 of the O2 and N2 and H2O molecules for each CO2 molecule, so if it misses them all, the emitted IR then hits the surface and then the whole process starts all over again again at the speed of light. Without clouds, the air never gets warm at night anywhere. The IR seems to miss the 407ppm CO2 molecules on the way up. Don’t forget convection is always carrying hot air upwards. in another post i calculated that there were 9 CO2 molecules for every photon that is emitted from the earth’s surface. So there is certainly enough CO2 to theoretically catch them all, but CO2 doesnt trap in every wavelength and really only is important around 15 microns. Since nightime temperatures are really only affected when there are clouds, one wonders how much of the DWIR is from CO2. If each CO2 molecule is surrounded by 2457 N2 and O2 molecules, how does the vast majority of N2 and O2 get heated from collisions with CO2. If the alarmist are going to say that it is not the collisions but the DWIR back to the surface and up again in a continuous cycle THAT REALLY COUNTS, then you must realize that this continuous recycling of IR between the atmosphere and surface is happening at the speed of light with 51% of it being lost to upper atmosphere on each cycle.
Also, The visible part of the sun’s solar radiance is 36.661%. The part of the sun’s spectrum to the lower wavelength (UV, xray,… etc) is ~3.3% , so that leaves ~ 60% left which is the IR. However 22.5% (all of it being IR) of the incoming solar is absorbed by the atmosphere. That leaves 37.5% of the solar radiance (actual IR) hitting the oceans and land. It is the IR that you feel on the back of your neck when you are out in the sun. Depending where you are,and at what time of the year, at high noon you will receive anywhere from total irradiance of 1366 W/m^2 down to ( x amount of back radiation at nighttime. Actually back radiation operates 24 hours a day since the CO2 is always present. Therefore we have to add x amount to the 1366 at daytime as well.
However we have to take only 37.5% (see above) of it for the thermal IR. That leaves (.375 x 1366) = 512W/m^2 in the tropics) However because I live at 50 N latitude, I am probably getting around 1000 W/m^2 + x (back radiation) at high noon on a hot summer day. So that means I am feeling 375 W/m^2 + x back radiation. I think we can all agree that we dont feel any of the x amount of back radiation from the DWIR from CO2 at nighttime. But I certainly feel (375 + x) during the hot sun of the day. NASA’s energy budget diagram gives x = 340.3 W/m^2 DWIR as a constant. Therefore I am feeling (375 + 340.3) = ~ 715 W/m^2 on the back of my neck during the hot sun of the day in the summer time.
So If I compare the burning sensation on the back of my neck of 715 W/m^2 in the midday sun in the summer, to the 0 heat effect on the back of my neck of 340.3 W/m^2 at midnight in the summer, something doesn’t compute. NASA PRACTICES JUNK SCIENCE.
Okay I have to make a correction . We do feel the visible part of light from the sun. So that means the full 1000 W/m^2 + 340 back radiation = 1340 W/m^2 is hitting the back of my neck in the summer during the day. So that has to be compared to the 340 back radiation at nighttime in the summer. It is still 25%. At nighttime I dont feel any heat on the back of my neck. Compare that to the burning sensation in the summer time and NASA’s back radiation doesn’t compute.
“Depending where you are,and at what time of the year, at high noon you will receive anywhere from total irradiance of 1366 W/m^2 down to ( x amount of back radiation at nighttime. Actually back radiation operates 24 hours a day since the CO2 is always present. Therefore we have to add x amount to the 1366 at daytime as well.”
But no, you wont at all.
1366 W/m^2 is the irradiance of the Sun on a circular disk at the distance of the Earth from the Sun.
The Earth is not a disc.
It is a sphere.
Therefore that figure must be divided by 4, equaling 341 W/m^2.
Now rework your maths with that in mind
“If I compare the burning sensation on the back of my neck of 715 W/m^2 in the midday sun in the summer, to the 0 heat effect on the back of my neck of 340.3 W/m^2 at midnight in the summer, something doesn’t compute.”
It’s you that doesn’t compute (again) .
At night there isn’t 340.3 W/m2 “on the back of the neck” as that figure is a 24hr average for the whole Globe.
Not a local time-specific one.
“NASA’s energy budget diagram gives x = 340.3 W/m^2 DWIR as a constant.”
No as an average. There’s a difference. Again over 24 hours and over the whole Earth.
“NASA PRACTICES JUNK SCIENCE”
No it’s you that doesn’t know the science.
NASA got to the Moon without you my friend.
Anthony Blanton
Dead wrong. That mythical 341 watts/m^2 is a 24-hour “AVERAGE” value for one day IF the sun shown continuously 24 hours at 40 degree latitude.
And actually, it is ONLY a 24 hour average value for two days a year, near the spring and fall equinox when the TOA solar radiation is actually at 1362 watts/m^2 . Now, please show us (by calculation) what the actual hourly solar radiation is at sea level for each hour of the day. The NASA-Trenberth 341 watts/m^2 is a flat-earth fiction fit only for Washington bureaucrats talking to Washington politicians at 40 degree north latitude about mythical 24 hours of sunshine each day.
You are correct.
And the correction, of course, makes a vast difference (sarc).
I meant the 1362 was correct.
“That mythical 341 watts/m^2 is a 24-hour “AVERAGE” value for one day IF the sun shown continuously 24 hours at 40 degree latitude.”
That isn’t:
It’s the continuous average over the whole globe.
Which does not occur anywhere ON THE GLOBE . Except as a mythical day-long 24-average of all sunlight at latitude 40 twice a year.
The 341 watts/m^2 average is valid. For NASA’s flat-earth model, orbiting a constant sun at a constant average radius.
The rest of the scientific world got rid of that model in the 1600’s.
I should mention that near infrared heat does not heat air but far infrared heat does. If you are at the equator you are getting the full 1366W/m^2 during the day at high noon in the summer. At night you get nothing. So the average between those 2 is less than 1/4 of that assuming that the intensity of sunlight is only good for 6 hours of the day. And then you have to bring latitude and time of the year into the equation. So every number that you go lower, just bolsters my contention that the back radiation of NASA is bogus. However I am not considering averages when I talk about 12 noon on a sunny day in the summer at the equator or even at 50 degrees latitude. Whether you feel the burning sensation at 1700 W/m^2 or at 1340 W/m^2, the NASA numbers dont make sense unless you believe that you can’t feel IR on the skin.
Actually, his assumptions were very poor.
For 40 north Latitude, 22 June (with the “midday sun in the summer shining on my shoulders” for a clear day with a nominal mid-latitude 0.75 atmosphere transmission factor …
The sun is actually hitting his shoulder (Beam Direct Normal Irradiation (BDNI)) with more than 976 watts/m^2 at noon.
The sun is hitting the ground (Beam Horizontal Irradation – BHI) with 935 watts/m^2 at noon.
For the entire midday period (9:00 to 3:00) it is hitting his shoulder with 6600 watt-hours.
At night? Well, none. NASA’s 341 watts/m^2 hits the ground for a period of about 15 minutes at 7:20 in the morning. And again in the evening.
DOY = 173 22-Jun LAT Deg => 40.0 1317 <=TOA Rad - WIND=> 0 M/sec Hour Tau Decl-Rad Decl-Deg HRA SEA_Rad SEA_Deg Air Mass % Trans BDNI BHI 0.00 2.952 0.4094 23.455 -3.1416 -0.4633 -26.5 0.00 0.000 0 0 1.00 2.953 0.4094 23.455 -2.8798 -0.4367 -25.0 0.00 0.000 0 0 2.00 2.954 0.4094 23.455 -2.6180 -0.3605 -20.7 0.00 0.000 0 0 3.00 2.954 0.4094 23.455 -2.3562 -0.2435 -13.9 0.00 0.000 0 0 4.00 2.955 0.4094 23.455 -2.0944 -0.0957 -5.5 0.00 0.000 0 0 5.00 2.956 0.4094 23.455 -1.8326 0.0740 4.2 11.76 0.034 45 3 6.00 2.956 0.4094 23.455 -1.5708 0.2587 14.8 3.86 0.330 434 111 7.00 2.957 0.4094 23.455 -1.3090 0.4531 26.0 2.28 0.520 684 300 8.00 2.958 0.4094 23.455 -1.0472 0.6526 37.4 1.64 0.623 821 498 9.00 2.959 0.4094 23.456 -0.7854 0.8523 48.8 1.33 0.683 899 677 10.00 2.959 0.4094 23.456 -0.5236 1.0441 59.8 1.16 0.717 944 816 11.00 2.960 0.4094 23.456 -0.2618 1.2073 69.2 1.07 0.735 968 905 12.00 2.961 0.4094 23.456 0.0000 1.2820 73.5 1.04 0.741 976 935 13.00 2.961 0.4094 23.456 0.2618 1.2073 69.2 1.07 0.735 968 905 14.00 2.962 0.4094 23.456 0.5236 1.0441 59.8 1.16 0.717 944 816 15.00 2.963 0.4094 23.456 0.7854 0.8523 48.8 1.33 0.683 899 677 16.00 2.964 0.4094 23.455 1.0472 0.6526 37.4 1.64 0.623 821 498 17.00 2.964 0.4094 23.455 1.3090 0.4531 26.0 2.28 0.520 684 300 18.00 2.965 0.4094 23.455 1.5708 0.2587 14.8 3.86 0.330 434 111 19.00 2.966 0.4094 23.455 1.8326 0.0740 4.2 11.76 0.034 45 3 20.00 2.966 0.4094 23.455 2.0944 -0.0957 -5.5 0.00 0.000 0 0 21.00 2.967 0.4094 23.455 2.3562 -0.2435 -13.9 0.00 0.000 0 0 22.00 2.968 0.4094 23.455 2.6180 -0.3605 -20.7 0.00 0.000 0 0 23.00 2.969 0.4094 23.455 2.8798 -0.4367 -25.0 0.00 0.000 0 0 TOA (24 Hr) = 31,607 watt-hrs Totals: 10567 7556 TOA Avg/Hr BDNI Avg/Hr BHI Avg/Hr 1316.9 440.3 314.8Indeed I do not dispute that.
I dispute ….
“That mythical 341 watts/m^2 is a 24-hour “AVERAGE” value for one day IF the sun shown continuously 24 hours at 40 degree latitude.”
The sun does shine 24 hours per day. In certain places.
342 watts/m^2 are not measured there either.
Show me your calculations, for each hour of the day, for any spot on earth receiving that mythical 24 hours of sunlight.
“Show me your calculations, for each hour of the day, for any spot on earth receiving that mythical 24 hours of sunlight.”
The 341 W/m^2 is from an energy balance diagram.
Of the Earth’s Solar absobed vs LWIR emitted.
It IS therefore an average for the whole Earth on a continuous basis.
The solar wind plays a major role in thermosphere heating. Here’s an extreme example , the March 2012 CME.
https://www.nasa.gov/mission_pages/sunearth/news/saber-solarstorm.html
This blog entry reminded me of an earlier one from Anthony Watts on a similar vein
“A misinterpreted claim about a NASA press release, CO2, solar flares, and the thermosphere is making the rounds
Anthony Watts / March 28, 2013
I loathe having to write this story because I truly dislike giving any attention to the people who are known as the “slayers” from the “Slaying the Sky Dragon” book. They now operate under the moniker of “Principia Scientific”.
But, somebody has to do it because some really bad mangling of the intent of a NASA press release by the “slayers” group is getting some traction. They have completely misread the NASA study and reinterpreted it for their purpose, claiming in a story titled “New Discovery: NASA Study Proves Carbon Dioxide Cools Atmosphere””
https://wattsupwiththat.com/2013/03/28/a-misinterpreted-claim-about-a-nasa-press-release-co2-solar-flares-and-the-thermosphere-is-making-the-rounds/
About that Space Junk….
That is about like driving a car to Baltimore, and abandoning your car in the middle of the freeway.
Launchers of vehicles likely to become space junk should at least be required to send tow trucks out after them.
There is not much thermal energy in the very short ultraviolet wavelengths, but the question of when the lower troposphere and Earth’s surface will start to cool may soon be answered.
We presently see a concurrent decrease in the measured long (10.7 cm microwave) wavelength solar flux, even though Earth’s distance from the Sun is decreasing now. Earth will reach Perihelion on January 4, 2019. Earth reached Aphelion on July 6, 2018. Note that the measured F10.7 solar flux has stayed below 70 sfu throughout the month of September: http://www.solen.info/solar/
“When the thermosphere cools, it shrinks, literally decreasing the radius of Earth’s atmosphere. This shrinkage decreases aerodynamic drag on satellites in low-Earth orbit, extending their lifetimes. That’s the good news.
The bad news is, it also delays the natural decay of space junk, resulting in a more cluttered environment around Earth.”
__________________________________________________
Really. So we’re waiting on Gaia to
natural decay space junk
to clean “environment around Earth.”
__________________________________________________
Astounding Nature: will find a way.
287 thoughts on ‘affected’.
It is an affectation.