
Figure 1. The global annual mean energy budget of Earth’s climate system (Trenberth and Fasullo, 2012.)
Recently in a discussion thread a warming proponent suggested we read this paper for conclusive evidence. The greenhouse effect and carbon dioxide by Wenyi Zhong and Joanna D. Haigh (2013) Imperial College, London. Indeed as advertised the paper staunchly presents IPCC climate science. Excerpts in italics with my bolds.
IPCC Conception: Earth’s radiation budget and the Greenhouse Effect
The Earth is bathed in radiation from the Sun, which warms the planet and provides all the energy driving the climate system. Some of the solar (shortwave) radiation is reflected back to space by clouds and bright surfaces but much reaches the ground, which warms and emits heat radiation. This infrared (longwave) radiation, however, does not directly escape to space but is largely absorbed by gases and clouds in the atmosphere, which itself warms and emits heat radiation, both out to space and back to the surface. This enhances the solar warming of the Earth producing what has become known as the ‘greenhouse effect’. Global radiative equilibrium is established by the adjustment of atmospheric temperatures such that the flux of heat radiation leaving the planet equals the absorbed solar flux.
The schematic in Figure 1, which is based on available observational data, illustrates the magnitude of these radiation streams. At the Earth’s distance from the Sun the flux of radiant energy is about 1365Wm−2 which, averaged over the globe, amounts to 1365/4 = 341W for each square metre. Of this about 30% is reflected back to space (by bright surfaces such as ice, desert and cloud) leaving 0.7 × 341 = 239Wm−2 available to the climate system. The atmosphere is fairly transparent to short wavelength solar radiation and only 78Wm−2 is absorbed by it, leaving about 161Wm−2 being transmitted to, and absorbed by, the surface. Because of the greenhouse gases and clouds the surface is also warmed by 333Wm−2 of back radiation from the atmosphere. Thus the heat radiation emitted by the surface, about 396Wm−2, is 157Wm−2 greater than the 239Wm−2 leaving the top of the atmosphere (equal to the solar radiation absorbed) – this is a measure of ‘greenhouse trapping’.
Why This Line of Thinking is Wrong and Misleading
Short Answer: Greenhouse Gases Cannot Physically Cause Observed Global Warming. Dr. Peter Langdon Ward explains more fully in the linked text. Excerpts in italics with my bolds.
Key Points:
Thus greenhouse-warming theory and the diagram above is based on these mistaken assumptions:
(1) that radiative energy can be quantified by a single number of watts per square meter,
(2) the assumption that these radiative forcings can be added together, and
(3) the assumption that Earth’s surface temperature is proportional to the sum of all of these radiative forcings.
There are other serious problems:
(4) greenhouse gases absorb only a small part of the radiation emitted by Earth,
(5) they can only reradiate what they absorb,
(6) they do not reradiate in every direction as assumed,
(7) they make up only a tiny part of the gases in the atmosphere, and
(8) they have been shown by experiment not to cause significant warming.
(9) The thermal effects of radiation are not about amount of radiation absorbed, as currently assumed, they are about the temperature of the emitting body and the difference in temperature between the emitting and the absorbing bodies as described below.
Back to the Basics of Radiative Warming in Earth’s Atmosphere
What Physically Is Thermal Radiation?
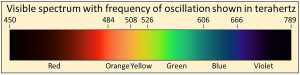
We physically measure visible light as containing all frequencies of oscillation ranging from 450 to 789 terahertz, where one terahertz is one-trillion cycles per second (10^12 cycles per second). We also observe that the visible spectrum is but a very small part of a much wider continuum that we call electromagnetic radiation. Electromagnetic continuum with frequencies extending over more than 20 orders of magnitude from extremely low frequency radio signals in cycles per second to microwave, infrared, visible, ultraviolet, X-rays, to gamma rays with frequencies of more than 100 million, million, million cycles per second (10^20 cycles per second).
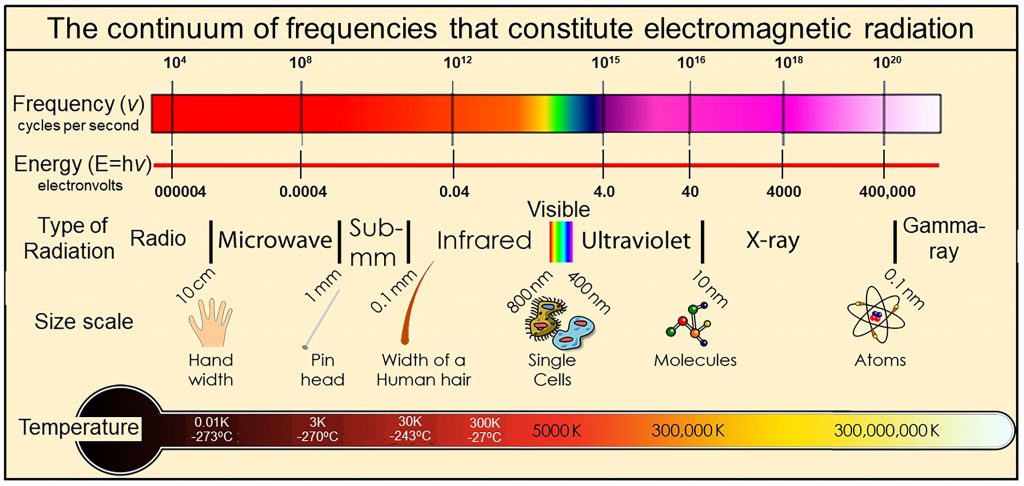 Thermal radiation is a portion of this continuum of electromagnetic radiation radiated by a body of matter as a result of the body’s temperature—the hotter the body, shown here at the bottom as Temperature, the higher the radiated frequencies of oscillation with significant amplitudes of oscillation.
We observe that electromagnetic radiation has two physical properties: 1) frequency of oscillation, which is color in the visible part of the continuum, and 2) amplitude of oscillation, which we perceive as intensity or brightness at each frequency. Planck’s law In 1900, Max Planck, one of the fathers of modern physics, derived an equation by trial and error that has become known as Planck’s empirical law. Planck’s empirical law is not based on theory, although several derivations have been proposed. It was formulated solely to calculate correctly the intensities at each frequency observed during extensive direct observations of Nature. Planck’s empirical law calculates the observed intensity or amplitude of oscillation at each frequency of oscillation for radiation emitted by a black body of matter at a specific temperature and at thermal equilibrium. A black body is simply a perfect absorber and emitter of all frequencies of radiation.
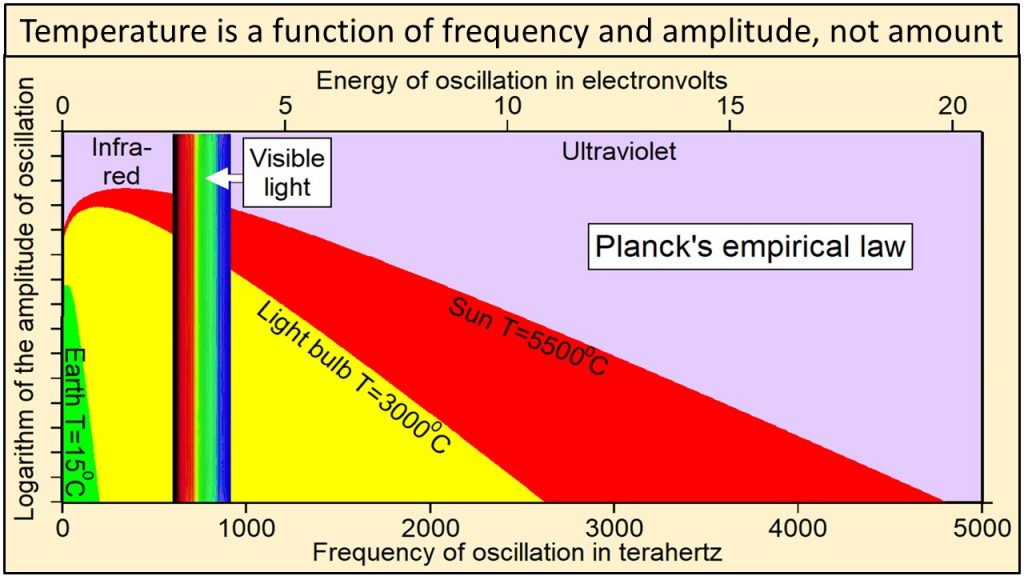
Thermal radiation from Earth, at a temperature of 15C, consists of the narrow continuum of frequencies of oscillation shown in green in this plot of Planck’s empirical law. Thermal radiation from the tungsten filament of an incandescent light bulb at 3000C consists of a broader continuum of frequencies shown in yellow and green. Thermal radiation from Sun at 5500C consists of a much broader continuum of frequencies shown in red, yellow and green.
Note in this plot of Planck’s empirical law that the higher the temperature, 1) the broader the continuum of frequencies, 2) the higher the amplitude of oscillation at each and every frequency, and 3) the higher the frequencies of oscillation that are oscillating with the largest amplitudes of oscillation.
Radiation from Sun shown in red, yellow, and green clearly contains much higher frequencies and amplitudes of oscillation than radiation from Earth shown in green. Planck’s empirical law shows unequivocally that the physical properties of radiation are a function of the temperature of the body emitting the radiation.
Heat, defined in concept as that which must be absorbed by solid matter to increase its temperature, is similarly a broad continuum of frequencies of oscillation and corresponding amplitudes of oscillation.
For example, the broad continuum of heat that Earth, with a temperature of 15C, must absorb to reach a temperature of 3000C is shown by the continuum of values within the yellow-shaded area in this plot of Planck’s empirical law.
Heat is, therefore, a broad continuum of frequencies and amplitudes of oscillation that cannot be described by a single number of watts per square meter as currently assumed in physics and in greenhouse-warming theory. The physical properties of heat as described by Planck’s empirical law and the thermal effects of this heat are determined both by the temperature of the emitting body and, as we will see below, by the difference in temperature between the emitting body and the absorbing body.
Greenhouse Gases Limited to Low Energy Frequencies

Figure 1.10 When ozone is depleted, a narrow sliver of solar ultraviolet-B radiation with wavelengths close to 0.31 µm (yellow triangle) reaches Earth. The red circle shows that the energy of this ultraviolet radiation is around 4 electron volts (eV) on the red scale on the right, 48 times the energy absorbed most strongly by carbon dioxide (blue circle, 0.083 eV at 14.9 micrometers (µm) wavelength. Shaded grey areas show the bandwidths of absorption by different greenhouse gases. Current computer models calculate radiative forcing by adding up the areas under the broadened spectral lines that make up these bandwidths. Net radiative energy, however, is proportional to frequency only (red line), not to amplitude, bandwidth, or amount.
Greenhouse gases absorb only certain limited bands of frequencies of radiation emitted by Earth as shown in this diagram. Water is, by far, the strongest absorber, especially at lower frequencies.
Climate models neglect the fact, shown by the red line in Figure 1.10 and explained in
Chapter 4, that due to its higher frequency, ultraviolet radiation (red circle) is
48 times more energy-rich, 48 times “hotter,” than infrared absorbed by
carbon dioxide (blue circle), which means that there is a great deal more energy packed
into that narrow sliver of ultraviolet (yellow triangle) than there is in the broad band
of infrared. This actually makes very good intuitive sense. From personal experience,
we all know that we get very hot and are easily sunburned when standing in ultraviolet
sunlight during the day, but that we have trouble keeping warm at night when standing
in infrared energy rising from Earth.

Ångström (1900) showed that “no more than about 16 percent of earth’s radiation can be absorbed by atmospheric carbon dioxide, and secondly, that the total absorption is very little dependent on the changes in the atmospheric carbon dioxide content, as long as it is not smaller than 0.2 of the existing value.” Extensive modern data agree that carbon dioxide absorbs less than 16% of the frequencies emitted by Earth shown by the vertical black lines of this plot of Planck’s empirical law where frequencies are plotted on a logarithmic x-axis. These vertical black lines show frequencies and relative amplitudes only. Their absolute amplitudes on this plot are arbitrary.
Temperature at Earth’s surface is the result of the broad continuum of oscillations shown in green. Absorbing less than 16% of the frequencies emitted by Earth cannot have much effect on the temperature of anything.
Summary
Greenhouse warming theory depends on at least nine assumptions that appear to be mistaken. Greenhouse warming theory has never been shown to be physically possible by experiment, a cornerstone of the scientific method. Greenhouse warming theory is rapidly becoming the most expensive mistake ever made in the history of science, economically, politically, and environmentally.
Resources: Light Bulbs Disprove Global Warming
CO2, SO2, O3: A journey of Discovery
Footnote:
This post is about the radiative properties of CO2 severely limiting its potential to cause global warming. A separate issue is the belief by warmists and some skeptics that humans are the primary cause of CO2 increases in the atmosphere. I have looked at this and concluded that natural sources and sinks are more likely responsible, as explained in the post What Causes Rising Atmospheric CO2?
A subsequent post updated the analysis of changes in CO2 and Temperatures Data Update Shows Orwellian Climate Science

Ron,
I have an alternative approach, which is preferring to point out how planetary climate actually works, including the small role of GHE that is an insulating effect of the Earth’s atmosphere, mostly from water vapour and just a part of the lapse rate to space, and very definitely NOT not what controls the climate. It seems there is a pointless obsession within academic realists in arguing what really doesn’t matter in terms of communicating reality to the general public, to the rather daft exclusion of making the key point of what does. That the dominant control of the oceanic evaporative response to SST change, the.natural control of climate, that takes care of all the major perturbations, including any SST variation due to a change in any “greenhouse effect” .
What is wrong with these clear facts, that I never hear argued when the effect of atmospheric CO2 is presented as the dominant control of climate it clearly cannot be in the most basic analysis of the global climate control science?
My point is simple and made below as an engineer and physicist, with experience of control systems that I extend to planetary control to answer the question of Earth’s clear long term stability and “how does it do that”, at a macro level..
1. The greenhouse effect is not a control, it’s just a heat transfer function within the overall lapse rate mechanism through the smart atmospheric lagging to space that can vary SST, BUT and effect within the system, not the overall dominant control that response to and equalises it.
POINT: When you insulate your house, you don’t need to change the setting on the thermostat, because the control turns the heating down. Same thing with GHE within the lapse rate and the oceanic control.
2. The climate is claimed to be a delicate balance that it very obviously isn’t to any systems engineer, being bashed around in space through all sorts of solar system and cosmic unpleasantness as well as the occasional super volcano/Caldera forming extinction events. We know this has gone on for 500 MIllion years while staying within a few degrees in the -273 deg C of space. So why should 1.6W/m^2 be a major problem?
This is robust system, with powerful controlling feedbacks relative to the small small perturbations such as GHE and WADDAYAGOT?
3. NUMBERS: The major control is the variation of the current 100W/m^2 of evaporative heat transport to space in response to change in SST, that increases exponentially as does evaporation with increasing SST, plus the cloud formation of a current 50W/m^2 of albedo that reflects solar radiation to maintain the narrow range of surface equilibrium. I don’t have a number for the actual response rate in W/m^2 per deg SST. It obviously increases with temperature, one author suggests the effect increases by 10% per deg at the tropics where it is most sensitive to temperature, so it is also weakest during glacial phases of the ice age, when the submarine volcanoes serve as an ocean winter heater. I have noted Roy Spencer quoting a response rate of 2.6 W/m^2 per degree SST. Which is adequate, but I am unsure if it is the total number relevant to this discussion – 10% per degree suggest 15W/m^2 response to a 1 degree rise, in the tropics, less away from them.
Whateveritis, this ocean evaporative control self evidently dominates and equalises any change in the lapse rate, and many other small effects such as asteroid strikes, super volcanoes, mass extinctions, while there are oceans we have stability…..
This dominant level of control also explains how Earth copes very well with stabilising a large range of regular change in solar activity and the 10 degree ice age range at the poles – for a start.
We know this dominant control has maintained the planet within a few degrees around 300 deg K for the 500 Million years, since there were oceans to deliver it. Because there isn’t an effect that compares to the scale of its known physical effect. Evaporation is our primary weapon in maintaining climate stability.
So it is a dumb distraction to argue about the tiny effect of a trace amount of CO2 on the atmosphere’s lapse effect on SST through the overall lapse rate, especially considering CO2’s already largely exhausted and exponentially decreasing effect on the overall lapse rate of Earth’s atmosphere, mainly due to natural water vapour, which dominates this effect in the tropics where it matters, where the CO2 effect is also lowest (temperature consequence if the gas laws).
BECAUSE: The other negative feedback effects of water vapour to change are the dominant control that maintains stability, including controlling negative feedback to SST change.
COMMENT WELCOME: What do you think of the statement arising from the above?
“Realists are allowing themselves to be trapped in the wrong argument in exposing the deceit of the climate change activists, leaving the dominant reality unspoken”.
”Planet Earth is not in a delicate climate equilibrium. The Earth’s dominant ocean surface delivers a strong, well measured and understood negative feedback control that maintains climate stability in a narrow range that rises and falls naturally over short centennial , multi millennial and longer cycles, driven by orbital forcings, that science knows from observation. Ocean evaporation changes in response to change in SST, that produces greater cloud cover reflecting the sun. Together these two massive effects provide the dominant controlling response to any small change in the lapse rate/GHE, and other perturbations to the planetary climate system.
The GHE/Lapse rate to space can temporarily change the surface temperature. However, such changes are easily restored in equilibrium within a narrow range by this far stronger control of Earth’s heat balance, that has controlled the effects of much larger perturbations and returned them quickly to equilibrium, over the last 500 Million years of records. Probably since there were oceans to do it, and regardless of atmospheric composition with far higher level of CO2 before plants and animals evolved to absorb it
As well as the relatively tiny effects of lapse rate on surface temperature variability, that may or may not be caused by CO2, plus the much greater GHE of water vapour, other perturbations range from significant solar activity change at the 100W/m^2 level to major exceptional events such as super volcanoes and asteroid strikes, with their accompanying extinctions of short term organic species but relatively fast recovery of established temperatures, also the regular short 41Ka and 100Ka interglacial warming events that punctuate the ice age climate we have enjoyed for most of the last 3.5 Million years.
It is self evident that none of these events have been beyond the power of the natural planetary control system, it’s oceans, to control. The satellite observations made to test the theory of climate change by human CO2 emissions have comprehensively disproven the predictions over 40 years, and it is also self evident from the global climate that there is no crisis, just weather, on human time scales. The dominant long term variability is cyclic and natural, a product of the solar system dynamics. Yet the constantly “delayed” predictions of catastrophe that self evidently do not, because they cannot, occur, based on partial models that rely on the assumptions programmed into them by activist scientists to justify the actions of politicians taken for reasons of power and profit, also some with a global agenda of reversing 10,000 years of civilisation to return to pre industrial levels of economic activity, food supply, energy use, and the consequences of that for Billions that would die. That is the real catastrophic danger, and why the deliberate deceit of paying pseudo scientists to support the linking of natural climate change to CO2 levels from energy use, also now disproven in fact, must be ended, and CO2 related cations removed from any laws regarding energy use,
LikeLiked by 1 person
Brian, thanks for that extended discussion. I have long maintained that H2O is the climate molecule, not CO2. Many posts here are on the theme “Oceans Make Climate.” And as you say, it is not just the radiative energy, but the larger, more powerful heat exchange processes of water phases changes and convection. You emphasize that negative internal feedbacks keep the temperature variation in a tight range; otherwise we wouldn’t even be here to talk about it. Three posts here may interest you.
Quantifying Natural Climate Change is an engineering analysis of earth temperature fluctuations
Earth Climate Layers describes the factors determining climate patterns
Bill Gray: H20 is Climate Control Knob, not CO2
discusses how water in all its phases determines all that we call weather and climate.
LikeLike
Ron, might I suggest that You read i.e “A First Course in Atmopsheric Radiation” by Grant W Petty. It gives a clear and precise descrption of the physics.
/Marcus
LikeLike
Marcus, thanks for the suggestion. I read and did a synopsis of Murry Salby’s Physics of the Atmosphere and Climate posted here as Fearless Physics from Dr. Salby. You might also consult William Happer on this subject. See Climate Advice: Don’t Worry, Be Happer.
LikeLike