Many primary schools use termly tests to track the attainment of pupils. Often these are created by commercial test providers.
Results tend to be reported as standardised (or age-standardised) scores.
But how much do results in these tests vary from term to term?
Data
To answer this question we’re going to use data that schools have loaded into the FFT Aspire Pupil Tracking system.
We use results in commercial tests from the 2021/22 academic year supplied by 700 primary schools who use the system regularly. We only consider results in tests that are reported as standardised scores.
We link pupils’ results to their result in the equivalent test in the previous term. In other words, tests in the same series created by the same test provider in the same subject.
In total we work with 203,000 pairs of results in reading and 193,000 pairs of results in maths. These cover Years 1 to 6 although roughly 75% relate to Years 3 to 5.
Standardised scores
Many commercial test providers convert raw test scores into standardised scores.
These are typically standardised with mean 100 and standard deviation 15. The scores give an indication of attainment for a given pupil relative to a historic sample on which the standardisation took place. 68% of pupils in the standardisation sample would have achieved scores between 85 and 115.
These will generally have been nationally representative at the time but standards may have improved, fallen, or stayed the same since.
As with results in end of Key Stage tests, results for summer born pupils tend to be lower.
To get around this, some test providers age standardise test results. This removes the effect of age.
The interpretation of standardised scores and age standardised scores is slightly different. Standardised scores give a sense of attainment relative to other pupils in the same year group. Age standardised scores give a sense of attainment relative to other pupils of the same age.
Standardised scores are sometimes confused with the scaled scores used by the Department for Education to report results in end of Key Stage 1 and end of Key Stage 2 tests.
Scaled scores look similar (they range from 80 to 120) but 100 denotes the expected standard rather than a hypothetical average. The mean scaled scores in reading and maths at Key Stage 2 were 105 and 104 respectively.
Correlation in termly test scores
First of all, let’s look at the correlation in test scores in reading and maths from term to term.
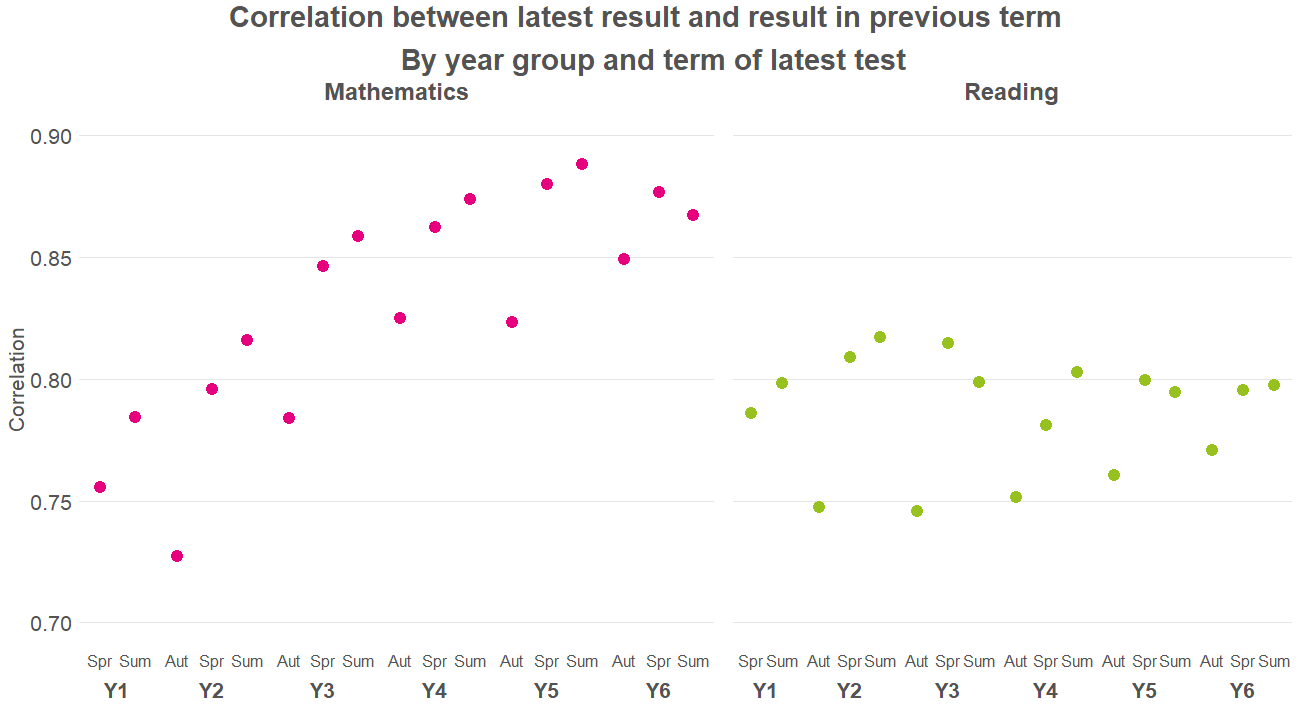
The closer to 1 the correlation between previous and latest test is, the closer the results are.
In general, the correlations range from 0.75 to 0.9. This indicates strong correlations and gives a sense that whatever the tests are measuring, they are measuring them fairly consistently.
Correlations tend to be higher in maths than in reading. We would probably expect this given that there is more scope for subjectivity in the marking of reading tests.
In both reading and maths, the correlation falls in the Autumn term across all year groups. This suggests that there is more variability in pupils’ results compared to the previous term. Perhaps the summer affects some pupils more than others.
The correlation in maths also appears to increase as pupils get older.
Variation from term to term
The correlations we saw in the previous section were strong but were below 1 indicating that there is some variability in results from term to term.
But by how much do pupils’ (age) standardised scores change?
In the table below, we report the change in test score from term to term. We have combined all year groups into a single table.

In general, Autumn term results tend to be lower than the previous Summer term. By contrast, Summer term results are, on average 3 points higher than Spring term results. As we would not expect the average standardised score to change from term to term, this might suggest that standardisation of the termly tests takes place at the same time.
As expected from the higher correlations in maths, results in maths are less variable than those in reading. The percentage of pupils whose scores change by less than 5 points (in either direction) tends to be higher in maths than in reading.
However, the scores of 50-60% of pupils change by more than 5 points from term to term. And 20-30% change by more than 10 points.
This raises the question of whether the changes represent genuine changes in attainment or whether they just represent uncertainty in measurement.
Changes in school averages
Although there is some degree of variation in pupils’ scores from term to term, we might expect these to cancel out to some extent when calculating the average score for a cohort at a school. Some pupils’ results might increase whilst others’ might fall.
The boxplots below show the spread of changes in the average score of school cohorts from term to term.
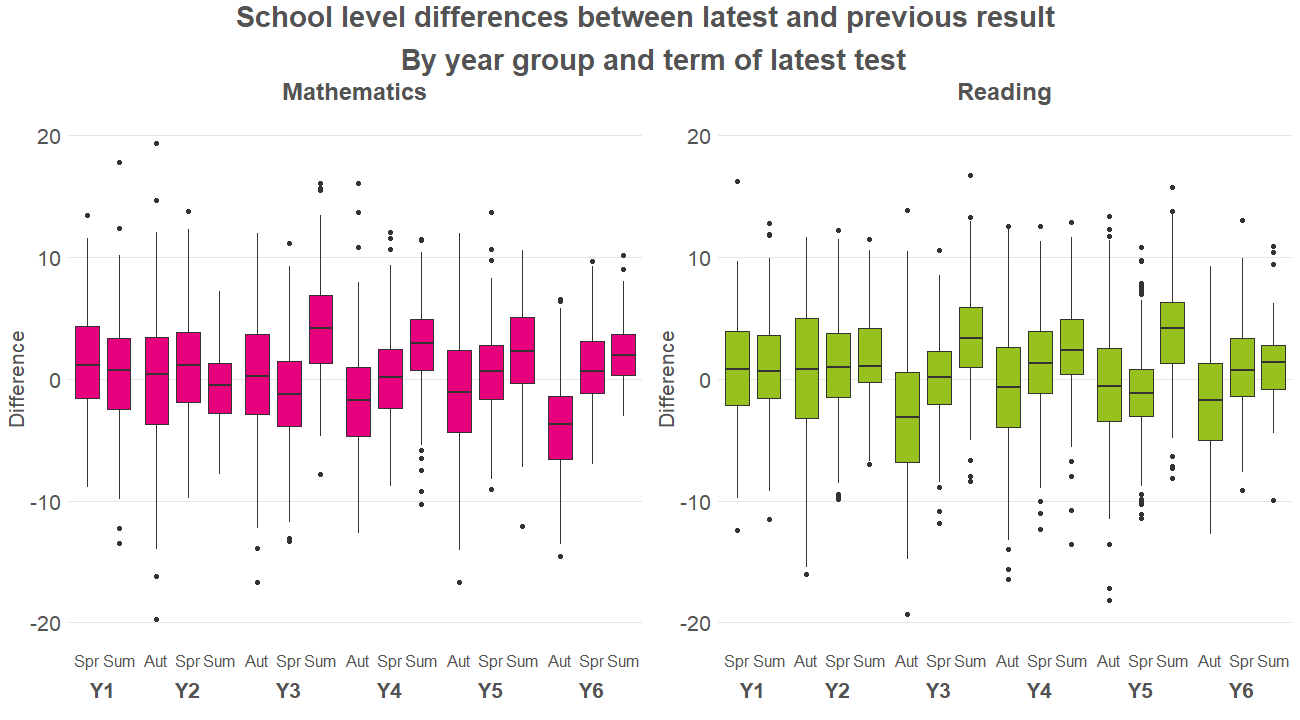
In general, the boxes (which represent the middle 50% of school cohorts) cover a range of 4 to 5 standardised score points.
But there are some schools where the scores change by a much greater margin.
We can only speculate why this happened. Did the tests cover some content that had not been taught? Or conversely cover content that had recently been taught? Did some schools administer a test out of sequence (e.g. a Year 2 test in Year 3)?
If we were to recalculate the table above showing changes in pupils’ scores but accounting for changes in school-level scores, then we see that more pupils achieve standardised scores within 5 points of their previous score. However, there is still notable variation indicating movement in the rank position of pupils within their cohort.

Sources of variation
To finish off, let’s take a look at the extent to which attainment varies between schools, between pupils and within pupils.
For this analysis, we change tack slightly and bring together all test results from 2018/19 onwards for pupils who were in Year 6 in 2021/22.
Clearly some of these results will have been affected by the COVID-19 pandemic.
But that notwithstanding, we try to split the variation in test results into 3 parts[1]:
- The part that represents the fact that attainment varies between schools
- The part that represents the fact that attainment varies between pupils
- The part that represents the extent to which results for pupils vary from test to test.
The results are displayed in the chart below.

In general, we see that the largest amount of variation is between pupils. 12% of the variance in reading and 17% in maths is between schools. Put another way, this shows that attainment does not vary much between schools compared to the variation between pupils. These figures are very similar to those we see at Key Stage 4, for instance.
But around a quarter of the variance is within pupils. In other words, and as we showed above, pupils’ results do tend to change from term to term.
Summing up
We’ve shown that pupils’ results in termly standardised scores are strongly correlated from term to term.
That said, there is still a fair amount of variation in pupils’ results from term to term, with most pupils changing by 5 or more standardised score points.
The inherent variability in results makes it more difficult for schools to make decisions about pupil attainment. If a pupil’s score increases (or decreases) is it a genuine change in attainment? Or nothing more than natural variation? Or a bit of both?
It may be the case that the average result across a number of tests (e.g. the average of all three termly tests taken in an academic year) might give a more reliable measure of pupil attainment than any individual test. But this needs further analysis.
- We nest test results within pupils within schools and run a null multilevel model to estimate the variance partition coefficient at each level.
Want to stay up-to-date with the latest research from FFT Education Datalab? Sign up to Datalab’s mailing list to get notifications about new blogposts, or to receive the team’s half-termly newsletter.


That was interesting thanks. Have you ever tracked attainment against attendance?