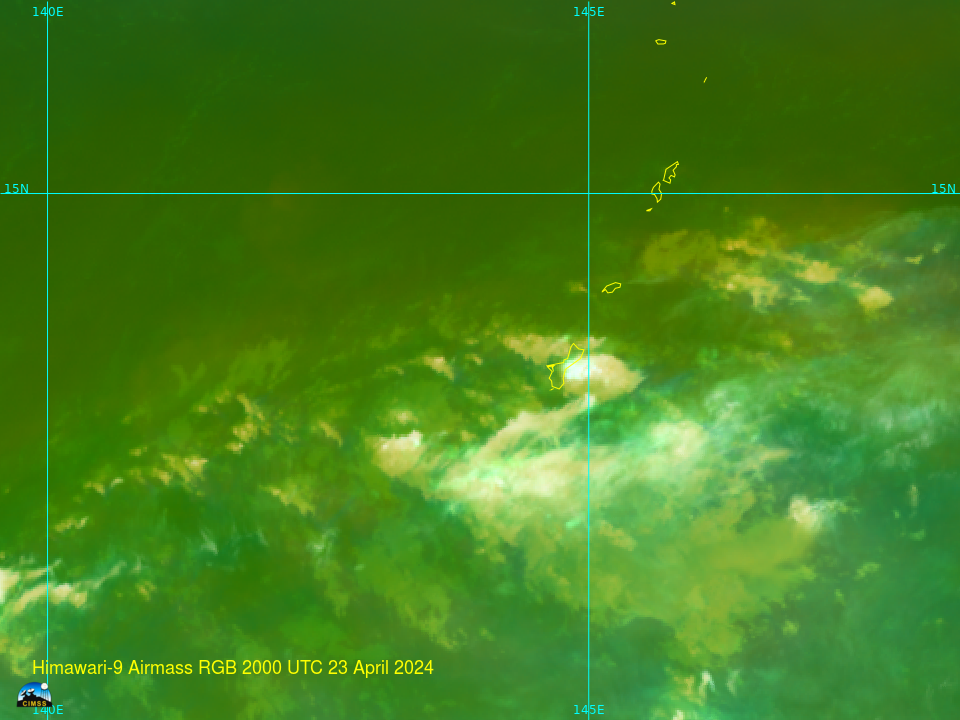
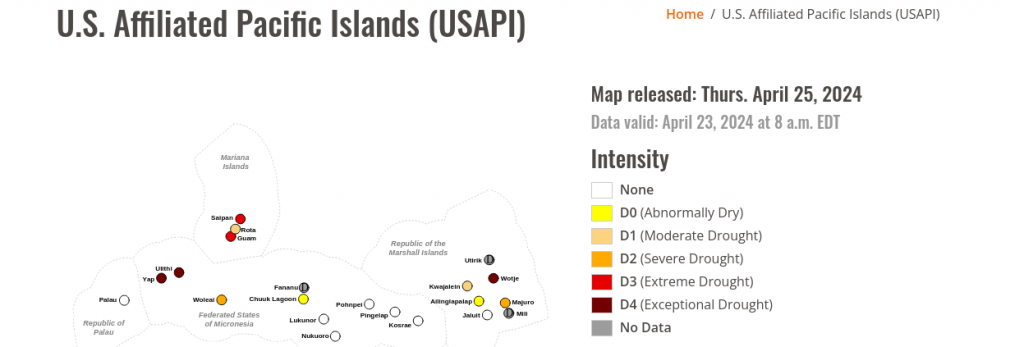
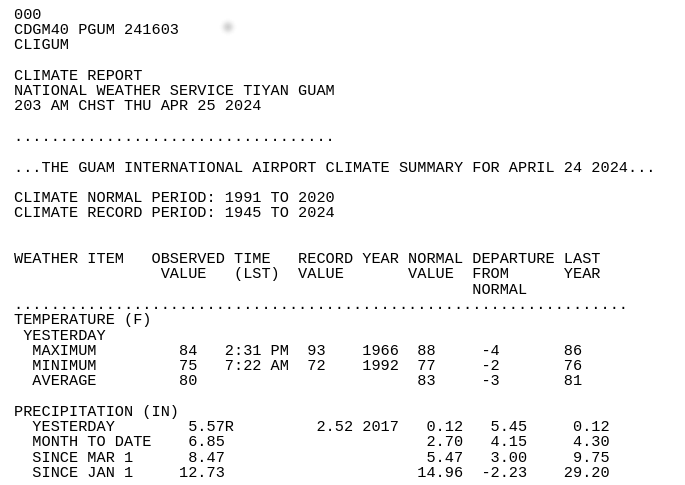
An extended dry period over the Marianas Islands was broken (at least temporarily) on 24 April when training thunderstorms dropped more than 5 inches of rain at the Guam airport. The US Drought Monitor data for the Marianas is shown below. Guam and Saipan both show extreme drought. Before the rain on 24 April, Guam year-to-date rains were 50% of normal. Persistent drought over the islands means that the heavy rains that fell likely did not percolate into the soil, instead becoming run-off. The airmass RGB above shows the evolution of the strong storms especially between 1800 and 2230 UTC. (Click here for a slower animation during that time). Visible imagery after sunrise (below) shows the strong thunderstorms as well.
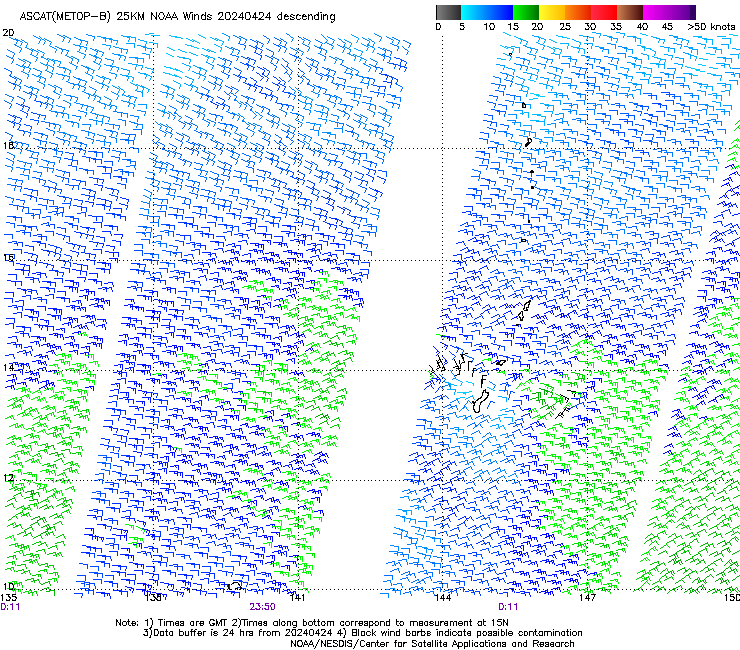
MetopB overflew Guam shortly after 0000 UTC on 24 April, as shown below. Surface winds at that time show stronger trades approaching from the east. Note that Metop-B viewed this region of the Pacific twice on 24 April, once at 0010 UTC, and once at 2350 UTC as shown in this image of the MetopB orbits on 24 April; (source) the left-most swath and the swath over Guam are from the early overpass; the other two swaths are from the later overpass.
Himawari-9 data are available in RealEarth. The loop below shows the clean window infrared imagery (Band 13, 10.4 µm) from 1800 to 2200 UTC on 23 April. The coldest cloud tops occurred around 2020/2030 UTC. Cloud-top warming was widespread after 2130 UTC.
View only this post Read Less


