Markets
These Five Cognitive Biases Hurt Investors the Most
There is no shortage of cognitive biases out there that can trip up our brains.
By the last count, there are 188 types of these fallible mental shortcuts in existence, and they constantly impede our ability to make the best decisions about our careers, our relationships, and for building wealth over time.
Biases That Plague Investors
In today’s infographic from StocksToTrade, we dive deeper into five of these cognitive biases – specifically the ones that really seem to throw investors and traders for a loop.
Next time you are about to make a major investing decision, make sure you double-check this list!
The moves that may seem instinctual for the average investor may actually be pre-loaded with cognitive biases.
These problems can even plague the most prominent investors in the world – just look at JPMorgan’s Jamie Dimon!
Biases to Avoid
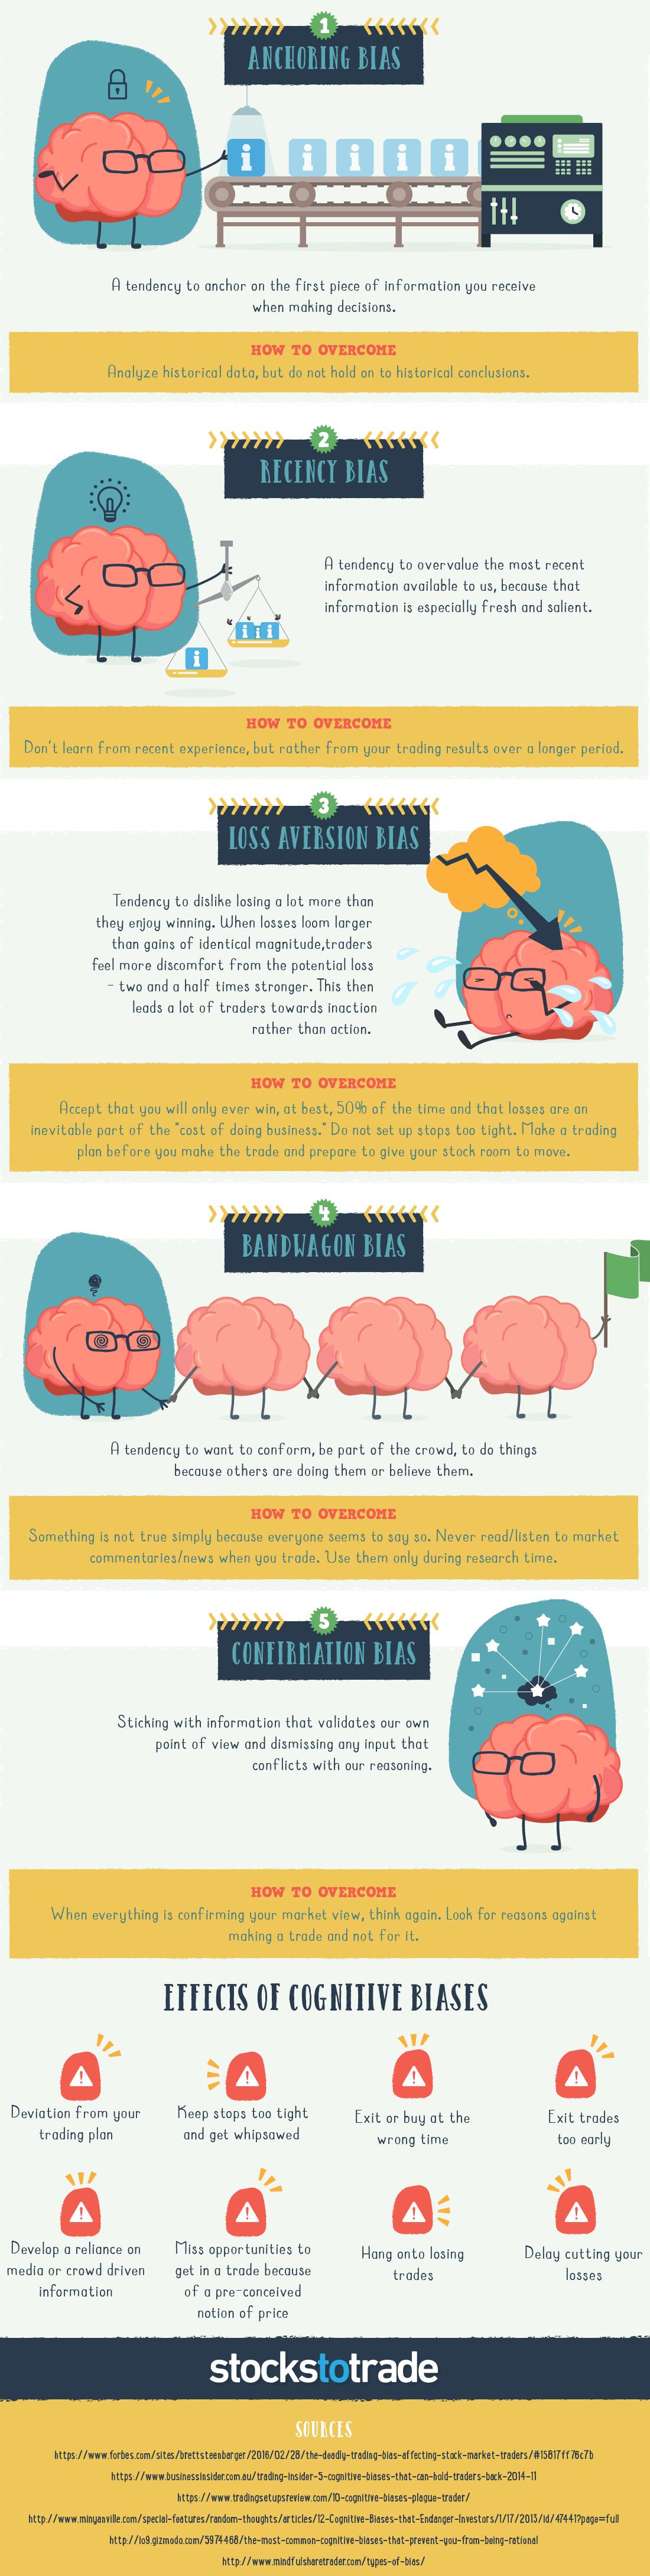
Here are descriptions and examples of the five cognitive biases that can impact investors the most:
Anchoring Bias
The first piece of information you see or hear often ends up being an “anchor” for others that follow.
As an example, if you heard that a new stock was trading at $5.00 – that is the piece of information you may reference whenever thinking about that stock in the future. To avoid this mental mistake: analyze historical data, but don’t hold historical conclusions.
Recency Bias
Recency bias is a tendency to overvalue the latest information available.
If you heard that a CEO is resigning from a company you own shares of, your impulse may be to overvalue this recent news and sell the stock. However, you should be careful, and instead focus on long-term trends and experience to come up with a more measured course of action.
Loss Aversion Bias
No one wants to lose money, but small losses happen all the time even for the best investors – especially on paper.
Loss aversion bias is a tendency to feel the effects of these losses more than wins of equal magnitude, and it can often result in a sub-optimal shift in investing strategy. Investors that are focused only on avoiding losses will miss out on big opportunities for gains.
Confirmation Bias
Taking in information only that confirms your beliefs can be disastrous. It’s tempting, because it is satisfying to see your previous conviction in a positive light – however, it also makes it possible to miss important findings that may help to change your conviction.
Bandwagon Bias
No one wants to get left out, but being the last one to pile onto an opportunity can also be cataclysmic. If you’re going to be a bandwagon jumper, make sure you’re doing it for the right reasons.


Markets
Mapped: Europe’s GDP Per Capita, by Country
Which European economies are richest on a GDP per capita basis? This map shows the results for 44 countries across the continent.


Mapped: Europe’s GDP Per Capita, by Country (2024)
This was originally posted on our Voronoi app. Download the app for free on iOS or Android and discover incredible data-driven charts from a variety of trusted sources.
Europe is home to some of the largest and most sophisticated economies in the world. But how do countries in the region compare with each other on a per capita productivity basis?
In this map, we show Europe’s GDP per capita levels across 44 nations in current U.S. dollars. Data for this visualization and article is sourced from the International Monetary Fund (IMF) via their DataMapper tool, updated April 2024.
Europe’s Richest and Poorest Nations, By GDP Per Capita
Luxembourg, Ireland, and Switzerland, lead the list of Europe’s richest nations by GDP per capita, all above $100,000.
| Rank | Country | GDP Per Capita (2024) |
|---|---|---|
| 1 | 🇱🇺 Luxembourg | $131,380 |
| 2 | 🇮🇪 Ireland | $106,060 |
| 3 | 🇨🇭 Switzerland | $105,670 |
| 4 | 🇳🇴 Norway | $94,660 |
| 5 | 🇮🇸 Iceland | $84,590 |
| 6 | 🇩🇰 Denmark | $68,900 |
| 7 | 🇳🇱 Netherlands | $63,750 |
| 8 | 🇸🇲 San Marino | $59,410 |
| 9 | 🇦🇹 Austria | $59,230 |
| 10 | 🇸🇪 Sweden | $58,530 |
| 11 | 🇧🇪 Belgium | $55,540 |
| 12 | 🇫🇮 Finland | $55,130 |
| 13 | 🇩🇪 Germany | $54,290 |
| 14 | 🇬🇧 UK | $51,070 |
| 15 | 🇫🇷 France | $47,360 |
| 16 | 🇦🇩 Andorra | $44,900 |
| 17 | 🇲🇹 Malta | $41,740 |
| 18 | 🇮🇹 Italy | $39,580 |
| 19 | 🇨🇾 Cyprus | $37,150 |
| 20 | 🇪🇸 Spain | $34,050 |
| 21 | 🇸🇮 Slovenia | $34,030 |
| 22 | 🇪🇪 Estonia | $31,850 |
| 23 | 🇨🇿 Czech Republic | $29,800 |
| 24 | 🇵🇹 Portugal | $28,970 |
| 25 | 🇱🇹 Lithuania | $28,410 |
| 26 | 🇸🇰 Slovakia | $25,930 |
| 27 | 🇱🇻 Latvia | $24,190 |
| 28 | 🇬🇷 Greece | $23,970 |
| 29 | 🇭🇺 Hungary | $23,320 |
| 30 | 🇵🇱 Poland | $23,010 |
| 31 | 🇭🇷 Croatia | $22,970 |
| 32 | 🇷🇴 Romania | $19,530 |
| 33 | 🇧🇬 Bulgaria | $16,940 |
| 34 | 🇷🇺 Russia | $14,390 |
| 35 | 🇹🇷 Türkiye | $12,760 |
| 36 | 🇲🇪 Montenegro | $12,650 |
| 37 | 🇷🇸 Serbia | $12,380 |
| 38 | 🇦🇱 Albania | $8,920 |
| 39 | 🇧🇦 Bosnia & Herzegovina | $8,420 |
| 40 | 🇲🇰 North Macedonia | $7,690 |
| 41 | 🇧🇾 Belarus | $7,560 |
| 42 | 🇲🇩 Moldova | $7,490 |
| 43 | 🇽🇰 Kosovo | $6,390 |
| 44 | 🇺🇦 Ukraine | $5,660 |
| N/A | 🇪🇺 EU Average | $44,200 |
Note: Figures are rounded.
Three Nordic countries (Norway, Iceland, Denmark) also place highly, between $70,000-90,000. Other Nordic peers, Sweden and Finland rank just outside the top 10, between $55,000-60,000.
Meanwhile, Europe’s biggest economies in absolute terms, Germany, UK, and France, rank closer to the middle of the top 20, with GDP per capitas around $50,000.
Finally, at the end of the scale, Eastern Europe as a whole tends to have much lower per capita GDPs. In that group, Ukraine ranks last, at $5,660.
A Closer Look at Ukraine
For a broader comparison, Ukraine’s per capita GDP is similar to Iran ($5,310), El Salvador ($5,540), and Guatemala ($5,680).
According to experts, Ukraine’s economy has historically underperformed to expectations. After the fall of the Berlin Wall, the economy contracted for five straight years. Its transition to a Western, liberalized economic structure was overshadowed by widespread corruption, a limited taxpool, and few revenue sources.
Politically, its transformation from authoritarian regime to civil democracy has proved difficult, especially when it comes to institution building.
Finally, after the 2022 invasion of the country, Ukraine’s GDP contracted by 30% in a single year—the largest loss since independence. Large scale emigration—to the tune of six million refugees—is also playing a role.
Despite these challenges, the country’s economic growth has somewhat stabilized while fighting continues.

-

 Mining6 days ago
Where the World’s Aluminum is Smelted, by Country
-

 Markets2 weeks ago
Visualized: Interest Rate Forecasts for Advanced Economies
-

 Economy2 weeks ago
The Most Valuable Companies in Major EU Economies
-

 Markets2 weeks ago
The World’s Fastest Growing Emerging Markets (2024-2029 Forecast)
-

 Markets2 weeks ago
Visualizing Global Inflation Forecasts (2024-2026)
-

 Misc1 week ago
Charted: What Southeast Asia Thinks About China & the U.S.
-

 Misc1 week ago
The Evolution of U.S. Beer Logos
-

 Healthcare1 week ago
What Causes Preventable Child Deaths?