October 2017 ENSO update: Still watching for La Niña
The task of a climate forecaster is to see the forest, and not get hung up on the individual trees. Especially that extra tall one over there, with the gnarl that looks like a face, and the low branches that would be so easy to climb, and… uh, right. My point is that we try to look beyond shorter-term weather to see longer-term monthly and seasonal patterns. After all, a particular winter can have several colder-than-average days and still be warmer than average overall.
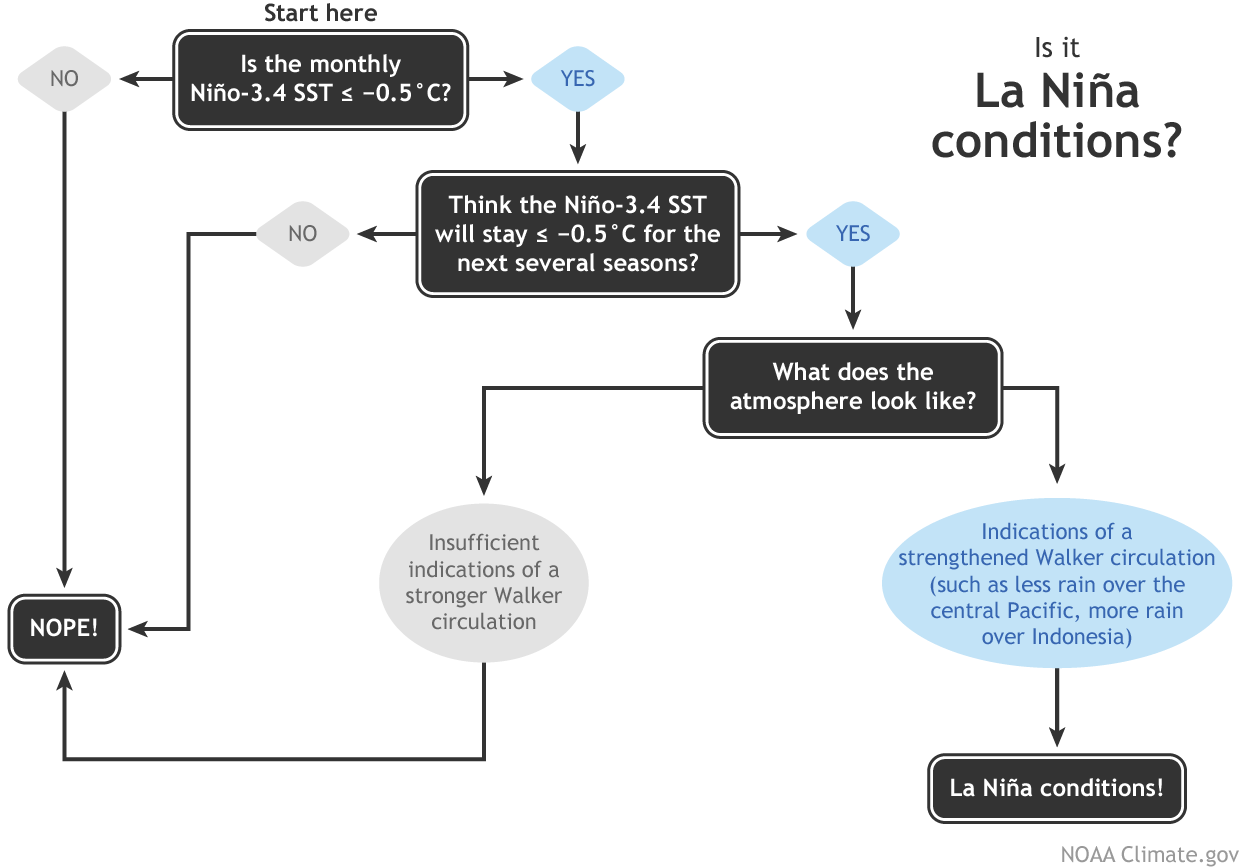
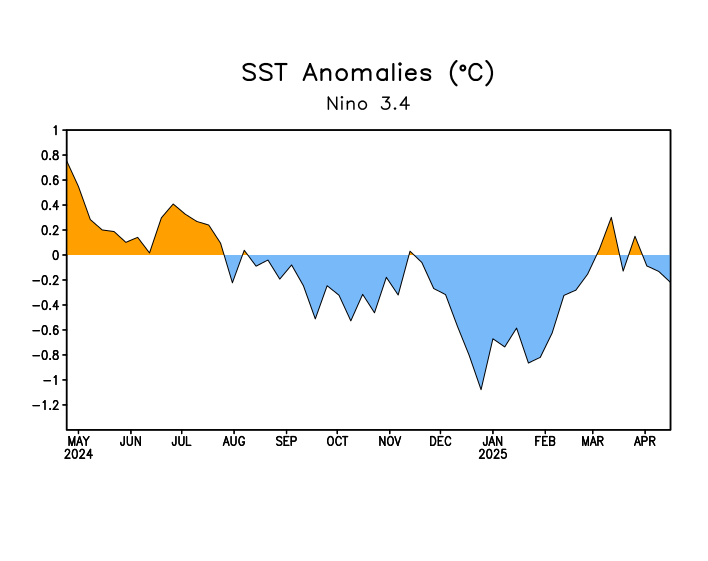
Which brings me to the current situation in the tropical Pacific! The October ENSO forecast says La Niña conditions are favored during the fall and winter 2017-18, but at press time the ocean-atmosphere system didn’t quite meet the criteria for a La Niña Advisory. Specifically, while the atmosphere is generally consistent with La Niña, the sea surface temperature in the Niño3.4 region has been volatile, recently edging up close to average following several weeks near or below the La Niña threshold (0.5°C colder than average).

Animation showing sea surface temperature departure from the 1981-2010 average from early August through early October 2017. Graphic by Climate.gov; data from NOAA’s Environmental Visualization Lab.
Is the overall pattern truly La Niña, with some short-term fluctuations temporarily obscuring the pattern? Or has the atmosphere-ocean system really not settled down into a consistent pattern at all? The difference between these two scenarios is subtle, and the ENSO forecast team is maintaining the La Niña Watch as we wait for a clearer picture. The forecast is for that picture to become clearer soon, with La Niña conditions 55-65% likely during this fall and winter.
The devil’s in the details
The average wind and cloud pattern over the equatorial Pacific during September looked a fair bit like what we’d expect during La Niña, including stronger near-surface east-to-west winds and upper-level west-to-east winds over the western tropical Pacific. The pattern of greater-than-average clouds and rain over Indonesia and less over the central Pacific is also typical during La Niña. The Southern Oscillation Index and Equatorial Southern Oscillation Index were both weakly positive during September, another indicator of a stronger-than-average Walker Circulation.

Places that were more (purple) or less (orange) cloudy than the 1981-2010 average during September 2017, based on satellite observations of outgoing longwave radiation (heat). Thick clouds block heat from radiating out to space, so less radiation = more clouds, and more radiation = clearer skies. Climate.gov map from CPC data.
All those atmospheric bits sound like La Niña. But the first criteria for La Niña is a monthly average Niño3.4 index more than half a degree below the long-term average. Which we had! The September Niño3.4 average sea surface temperature anomaly (departure from long-term average) was -0.5°C. For NOAA to declare La Niña, though, we need the expectation that it will stay there for five overlapping 3-month periods.
Instead, we saw the surface temperatures warm substantially over the last half of September. The warming wasn’t enough to wipe out the whole-month cool anomaly, but it was enough to undermine—at least a little—forecasters’ confidence that the pattern is solidly established and will last for the required five overlapping seasons. So…no La Niña yet.
Diagnosing exactly why the surface temperatures warmed over a few weeks is difficult. One possibility is the tropical instability waves that have been active in the east-central tropical Pacific over the past month. These waves can mix warmer surrounding water into the cooler waters right along the equator and cause sea surface temperatures in the Niño3.4 region to rise.
It seems likely that the surface waters will tend cooler again, as those stronger-than-average surface winds I mentioned above work to cool the surface and keep the warmest Pacific waters trapped in the far western Pacific. Also, we still have a substantial amount of cooler-than-average water below the surface. The cool subsurface waters increased during September, and will likely provide a source of cooler waters to the surface over the next few months.
The dynamical computer models are not very clear on which way sea surface temperatures will go for the next month or so. As you can see here, there is a very large range of potential outcomes for October, including well above and below the La Niña threshold. However, the models are more consistent after October, predicting that the most likely outcome for the late fall and early winter is sea surface temperatures below the threshold for La Niña.

Climate model forecasts for the Niño3.4 index, from the North American Multi-Model Ensemble (NMME). Darker purple envelope shows the range of 68% of all model forecasts; lighter purple shows the range of 95% of all model forecasts. NOAA Climate.gov image from CPC data.
Usually, we wouldn’t focus that much on a short-term change in one of the physical signs we monitor. (For example, we’ve cautioned our readers against using a single weekly anomaly to conclude that the El Niño of 2015-16 was the Most Powerful Ever.) But the sea surface temperature anomaly is essential to the ocean-atmosphere system that is ENSO. If it doesn’t return to cooler-than-average territory soon, it could leave the whole system looking more like a bunch of random trees than a forest… that is, more like random climate variability than La Niña.
If that favored La Niña develops…
Fun fact time! My blog-brother Tom has spent a lot of time studying the historical record of ENSO. He discovered that if La Niña develops this year, it will be the only La Niña on record where the Niño3.4 sea surface anomaly increased for several months, nearing the El Niño threshold, before diving into La Niña territory. Said another way, all the other 21 La Niña events followed a steady decline from warmer-than-average or followed consistently below-average sea surface temperatures. This year would follow cooler, then warmer, then cooler again sea surface conditions.

Monthly sea surface temperature in the Niño 3.4 region of the tropical Pacific compared to the long-term average for all years when La Niña developed, showing how 2017 (purple line) compares to other events. Climate.gov graph based on ERSSTv5 temperature data.
That’s kind of interesting, but would it be significant in some way? Maybe. Or maybe Tom should get a new hobby…
Comments
Inter-decadal Pacific Oscilation
RE: Inter-decadal Pacific Oscilation
Hi- I'm not an expert in the topic, but I know that the IPO is strongly related to the PDO. The PDO is, in turn, significantly related to ENSO. Tom wrote a nice blog post here describing the PDO and what influences it:
https://www.climate.gov/news-features/blogs/enso/going-out-ice-cream-first-date-pacific-decadal-oscillation
As for which PDO state we are in now, it's uncertain. Time series of the PDO show that we've recently returned to a slightly cooler-than-average state (it was warmer during 2015-16), but that could be because we had a La Nina last winter and we appear to be on the cusp of a La Nina this winter as well.
My take on the warming blip
the warming blip inducer
Add new comment