Revisiting a Major Methane Study
More on:
The ongoing fight over whether shale gas operations are leaking dangerous amounts of methane – a question that many have called critical to determining whether shale gas is good or bad – has suffered from a paucity of data. That’s why a much talked about study, authored by thirty scientists (mostly from NOAA) and published in early February, made such big waves: it was the first (and remains the only) study to estimate shockingly high emissions based on actual observations in the field (data was collected in Colorado in 2008).
In a new paper in press at the Journal of Geophysical Research (preprint here), the same journal that published the NOAA results, I explain why the NOAA estimates are unsupportable. (Short version: great data; wrong interpretation.) I then exploit some data that the NOAA team reported but did not use in their calculations to re-estimate methane leakage rates. I find methane leakage rates that are most likely between 1 and 2 percent, very similar to what previous careful estimates have consistently indicated, but far lower than the rates -- as high as 7.7 percent -- that the NOAA study claimed.
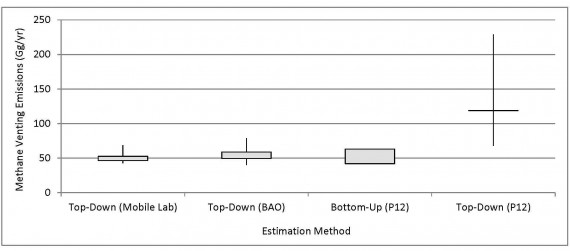
I might try to explain the technical issues involved in the analysis in a future blog post. (Summary: The original paper relied on a critical but flawed assumption; my paper does away with it.) For now, though, I want to focus on the big picture. It’s summed up in the figure below, which is taken from my paper.
The NOAA authors estimated emissions in two ways. The first was a traditional “bottom-up” method (second from the right) based on past observations of emissions from various gas-related processes. That yielded an estimate that about 1.7% of total production was leaking, with a possible range of 1.3-2.0%, similar to previous analyses. The second was the “top-down” method that generated such alarm (far right), which took observations of methane in air and used some simple calculations to infer estimates of how much methane was leaking from natural gas systems. That approach implied that 2.3-7.7% of produced gas was leaking, with a best guess of about 4.0%. Those are indeed massive numbers.
My new analysis of the top-down numbers paints a far less shocking picture. My paper reports its results in terms of absolute leakage, as the original paper does, but since people are more used to thinking about leakage rates, I’ll use those here. Using the same method for converting absolute leakage to percentage rates that the NOAA authors used, I find that leakage is most likely 1.5-1.7%, with a possible range (using a very conservative estimate of uncertainty) of 1.3-2.3% (far left in the figure). This is similar to what bottom-up estimates, not only from the NOAA authors but from places like the EPA, have found.
There are, of course, big limits to my own analysis. That’s in part because I’ve kept much of the original paper’s methodology (which that paper and mine both point out has limitations) intact. It’s in part because the underlying data that I’ve analyzed comes from only one region at one point in time. (Among other things, Colorado has imposed tough rules on methane emissions since the NOAA data was collected in 2008.) I’d still like to see more data, and am glad that people appear to be hard at work collecting it (kudos to EDF), but for now, I’m deeply skeptical of claims that massive amounts of methane are leaking.
More on:
 Online Store
