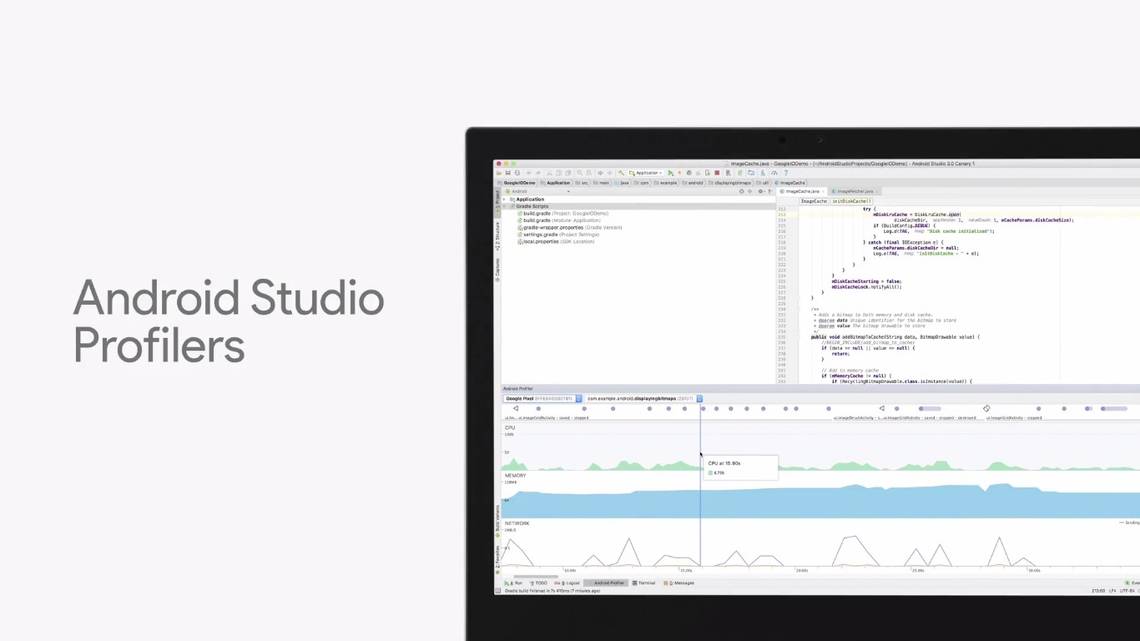
Google is adding a new tool for developers in the form of the Android Studio Profilers, which allow for quick visual interpretation of an app's operations. Recently announced at I/O, the feature is already part of Studio 2.4 Preview as well as 3.0, and replaces the Android Monitor. The new tools allow you to visually monitor the network, CPU, and RAM use of an app on a timeline graph, along with pertinent info like interaction events. Android Developers everywhere will have a slightly easier time, now, finding and fixing weird stutters and slowdowns in their apps.
Now developers can check and see all the minutiae of how their app is performing visually, without having to rely on other tools. They can monitor things like CPU usage and time down to the thread and call level to see what might be hanging or delaying an operation. When they see something behaving a bit janky, it will be much easier to spot, and they can immediately jump to the relevant line of code to try and figure out what might be going on. Keep in mind that for non-O based emulator images or devices, you have to enable advanced profiling in the run configuration window in order to use all the features in the new tools. It's going to be a big help debugging in the future, and I'm sure developers will appreciate it.
Source: Android Studio Project Site