Review: Tableau takes self-service BI to new heights
Tableau strengthens its case with cross-database joins, browser-based authoring, and geo-analysis improvements


Contributor, InfoWorld |

-
Tableau 10.2
Since I reviewed Tableau, Qlik Sense, and Microsoft Power BI in 2015, Tableau and Microsoft have solidified their leadership in the business intelligence (BI) market: Tableau with intuitive interactive exploration, Microsoft with low price and Office integration. Qlik is still a leader compared to the other 20 vendors in the sector, but trails both Tableau and Power BI.
 InfoWorld
In addition to new analytics, mapping, and data connection features, Tableau has added better support of enterprises and mobile devices in the last two years. In this review, I’ll give you a snapshot of Tableau as it now stands, drill in on features new since version 9, and explore the Tableau road map.
Tableau describes its products as offering “analytics that work the way you think” and says these tools harness “people’s natural ability to spot visual patterns quickly, revealing everyday opportunities and eureka moments alike.” There’s a certain amount of truth in that, although you could say almost the same thing about at least five other BI tools. The self-service visual analytics approach is becoming mainstream.
The visual discovery phase of the analysis workflow is the sexy part, but it’s not where most people spend most of their time. In my experience, importing and conditioning the data can easily consume 80 percent of the time you spend with a BI product. The same is more or less true for the more complicated workflow needed for machine learning (to make predictions), although when you get to deep learning the time needed to train models starts to dominate the workflow.
Tableau authoring unleashed
Tableau ships in three major forms: Tableau Desktop (Personal and Professional), Tableau Server (deployable on-premises or in your cloud instance), and Tableau Online (Tableau Server hosted in the cloud). Tableau Desktop can act as a client to Tableau Server and Tableau Online, but so can browsers, as well as Tableau Mobile for Android and iOS phones and tablets. Tableau Public, which is free, can be used to publish interactive data on websites. Tableau Reader, which is also free, can read packaged Tableau Desktop files.
It used to be necessary to have Tableau Desktop Professional to author analyses. That is no longer the case. You can manage fine with a browser or mobile client to Tableau Server or Tableau Online. Certain operations may be faster on the desktop, but with a good internet connection the difference is small. The location of the data matters a lot. For example, if you’re joining a table from an Amazon Redshift database with a table residing on your desktop, the join operation may well drag out for a few minutes. If you upload the table data source to Tableau Online, which resides on Amazon, the join will complete much faster.
You would expect to see Tableau Online and Tableau Server incorporate management features for enterprises, such as the ability for IT to certify data sets or define joins, standard calculations, and performance optimizations that users can draw on. These are coming along with each quarterly release, but as of right now there are still gaps to be filled.
Tableau is now priced on a subscription basis; it used to be priced as perpetual licenses plus annual maintenance. The company claims that the subscription pricing lowers the up-front cost to customers and increases flexibility. That might be true, but I have to observe that Tableau is facing heavy competition from the much lower-priced Microsoft Power BI. I would estimate that Power BI provides roughly 80 percent of Tableau’s functionality at roughly 25 percent of its price.
Tableau workflow
How does the BI workflow look in Tableau? It starts with data, of course. Now that Tableau can do cross-database joins, you’re likely to import multiple data sources and join them, although you might have most of them hosted in your data warehouse, if your company is big (or rich) enough to have one.
Then you’re going to want to filter and condition your data on a row-by-row basis. Depending on your analysis goals, you may want to, for example, remove rows with null fields, convert different date and time formats to a single common format, and bin ranges of some fields into categories (such as ranking incomes below the federal poverty level for the family size as “low income”).
 IDG
IDG
This sample of sales data in Tableau Online shows a profitability analysis broken down geographically and by segment. In the charts below the map, blue areas are profitable sales and orange areas are unprofitable.
Finally you’ll get to the point where you can actually start creating visualizations such as the screenshot above, although it’s not unusual to have to perform additional data transformations while you’re trying to do your exploration. But data conditioning and transformation are easily accomplished in Tableau, certainly as easily as they would be in Excel. There is no need to go back to the import stage to add computed fields or filter the data.
 IDG
IDG
Analyzing Case-Schiller Housing Price Index (HPI) data for 18 U.S. cities. The data shown on the map is filtered to show only 2014 data.
Visual discovery, as in the screenshot above, is quite powerful, despite all the hype, and Tableau has set the bar for its good, easy-to-use implementation and for its fine control of the chart display. You build a Tableau visualization by clicking on or dragging the dimensions (typically discrete categories or characteristics) and measures (numeric values) of interest, and either choosing a mark (the type of display, such as bars, lines, and points) yourself, or using automatic mark selection, or using the “show me” method for selecting the visualization seen at the top right of the screen above. The green box around the symbol map icon in the "show me" drop-down indicates that Tableau recommends it as the best practice for your data.
For more control, you can drag dimensions and measures onto specific mark characteristics or “shelves.” In the visualization above, I dragged HPI onto color and selected the average (mean) aggregate, then dragged HPI onto size and selected the median aggregate. You’ll note that in this example the latitude and longitude measures were generated from the state and city names, which are dimensions.
When you understand what’s happening in your analysis, you can share dashboards and stories with others. That’s easily done by publishing to Tableau Server or Tableau Online, whether you’ve been working in Tableau Desktop and need to upload, or you were already doing your analysis online.
Tableau 10.2 overview
Arriving in August of last year, Tableau 10 introduced cluster analysis, custom territories, cross-data-source filters, and interactive highlighting in analytics. In data access, it introduced cross-database joins, connectors for Google Sheets and QuickBooks Online, the use of Oracle Database stored procedures, and more maps data. Additionally, Tableau 10 introduced mobile support for Android, a device-aware designer for dashboards, mobile device management support for Tableau Mobile, web authoring (see screenshot below), and enterprise governance and extensibility.
 IDG
IDG
Superstore analysis in edit mode in Tableau Online. Tableau Server and Tableau Online now do as good a job of authoring as the Tableau Desktop version, as long as you have a fast connection to the server.
Version 10.1 added JSON file support, wild card unions, a Marketo connector, and better support for BigQuery in data. Enterprise and web authoring features were improved, and geocoding support for airport codes was added.
Version 10.2 adds spatial file connectors, more mapping data, Python integration, union support for SQL databases, join calculations, and export of transformed data sources as CSV files. It also adds improved web authoring; security, governance, and extensibility features; and legend options and formatting controls for visualizations and stories.
I consider the geographic analysis to be one of the key differentiators of Tableau, so it’s really good to see it becoming even more useful than it was two years ago. As an example, let me present the National Parks of the United Kingdom, with the data for the Peak District National Park shown. The polygon files used came from the Tableau Mapping public repository.
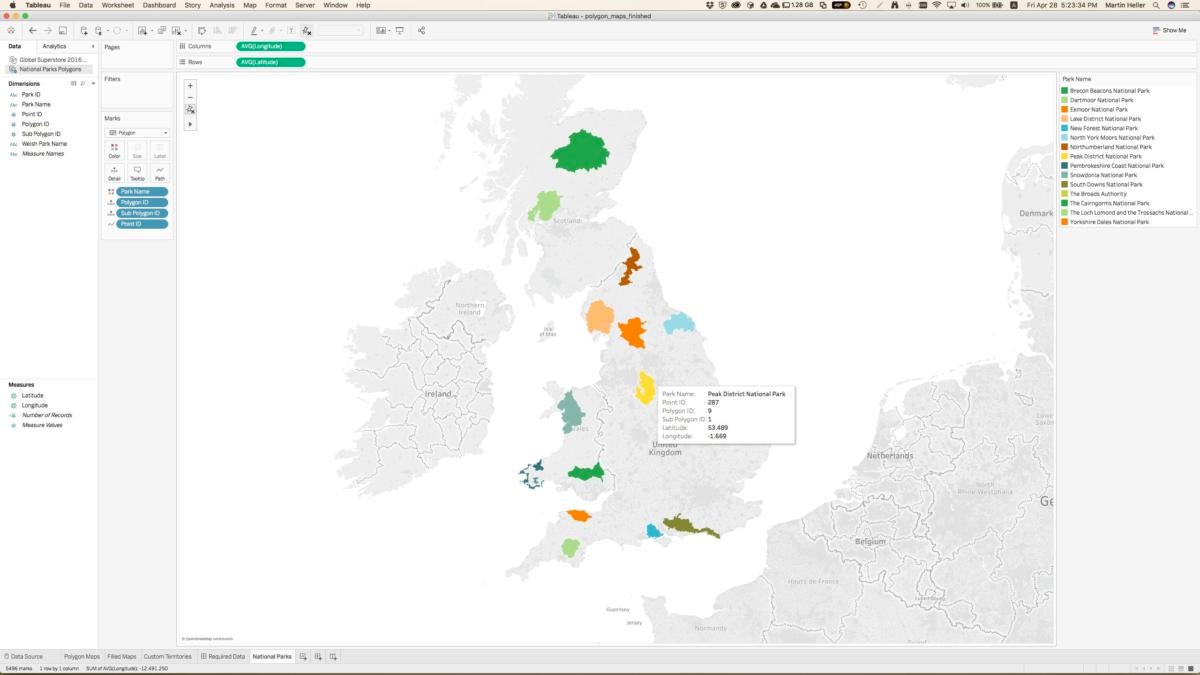 IDG
IDG
This Tableau workbook shows the parks in the U.K. using polygon outlines from Tableau Mapping, a public repository of Tableau mapping data sets. The workbook demonstrates how Tableau can join its own maps with polygon data to show arbitrarily complex regions of interest, including voting districts and city building footprints.
Tableau 10.3, Tableau Services Manager, new versions of Tableau Mobile for Android and iOS, and Tableau Server for Linux are now in pre-release testing. Upcoming pre-release programs include Project Maestro, a standalone visual data preparation suite, and Tableau with Hyper, an improved in-memory database that should handle larger data sets. The road map for future development, which was publicly discussed during the keynote of Tableau’s 2016 conference, shows the product moving to improve data import and analysis performance.
More better BI
The point releases since my review of Tableau 9 two years ago may sound like only modest improvements taken by themselves, but the overall difference between version 9 and the current version 10.2 is substantial. Specific improvements jump out at me as having significant impact for analysts.
For example, cross-database joins with visual design support mean that analysts can combine data sets in Tableau’s internal store without doing a lot of database work ahead of time or asking a DBA to prepare new database tables. Cross-database joins in Tableau Desktop don’t necessarily perform wonderfully if your data sources are geographically distributed (say, one on your desktop and another in a remote cloud zone), but you can fix that easily by publishing local files to Tableau Server or Tableau Online.
Being able to author analyses in your browser or on your tablet is also huge, both for analyst flexibility (you don’t have to be at your desk to explore your data) and for the company bottom line. The cost savings come from not having to buy every author a desktop license, which was previously necessary no matter how rarely that analyst did any authoring.
Two years ago I noted that companies that need periodic reports generated automatically might need to look elsewhere. It appears that Tableau has addressed that issue, as well as most of the security and management issues that became important as the product moved into large enterprises.
Finally, I consider the ability to incorporate spatial files (polygon files) from other sources huge. The UK National Parks map I showed earlier is a good example, but this biomes map is even more impressive. What Tableau has done is to support ESRI Shapefiles, KML, MapInfo tables, and GeoJSON files—in other words, all the most common spatial file formats. Once you can import these formats you can use public data from around the world, including sources like Data.gov (U.S. Open Data), HDX (the Humanitarian Data Exchange), and the EEA (European Environment Agency), and combine them with maps.
Tableau is an Editor’s Choice for its capabilities and ease of use. You’ll notice that none of its scores has reached a perfect 10, however. There is still room for Tableau to improve in every area.
At the same time, I have to stress that Microsoft Power BI offers something like 80 percent of Tableau’s features for about 25 percent of its price. In the past I have seen Microsoft smother better products by, for example, bundling its somewhat inferior product with Office and giving purchasing departments an offer they can’t refuse. It’s awfully hard for a company like Tableau to keep market share in the face of that kind of competition, but I hope it will. It makes a terrific product.
---
Cost: Personal edition: $35 per user per month; Professional edition: $70 per user per month; Tableau Server: $35 per user per month; Tableau Online (fully hosted): $42 per user per month. All prices shown are billed annually. Call for Enterprise subscription pricing.
Platform: Windows 7 or later, MacOS 10.10 or later, and web browsers (as clients to Tableau Server and Tableau Online). Tableau Server runs on-premises or on AWS, Azure, and GCE, and requires Windows Server 2008 R2 or Windows 7 or later.
Copyright © 2017 IDG Communications, Inc.