It’s not always a simple task to compare the value of electricity generation resources. Coal, natural gas, solar, wind, and so on have different strengths and weaknesses, so when it comes time to build or replace energy capacity, economists look at the Levelized Cost of Energy (LCOE), which divides the total cost of an installation or plant by the kilowatt-hours it produces over its lifetime.
While private financial firms like Lazard calculate their own LCOE figures, the Energy Information Administration (EIA) also puts together an annual report projecting the LCOE for various generation resources. The report, released this month, looks at the cost of generation resources if they were to come online in 2019, 2022, and 2040.
The latest numbers seem to confirm trends that have borne out recently in energy markets—overall, some renewables are getting more attractive, others are struggling, and coal has definitely been unseated as king.
The EIA calculated LCOE for generation resources in 22 regions in the US and then took the simple average of those regions for a national number. Once federal tax credits and energy regulations are factored in, a rough estimate of cost per unit of energy produced is possible. In general, the lower your LCOE, the better, because it usually means you’re getting more kWh for your dollar. (There are exceptions, though. If the LCOE analysis is being applied to, say, a solar installation on a building, investing in efficiency upgrades for your building before installing a solar array is undoubtedly the right move, even though it will increase your cost marginally and reduce the amount of kWh you need. More on the limitations of the LCOE are below.)
Cost of energy 101
The EIA's 2017 projections (PDF) show how pricey each kind of energy will be for plants that go online in 2019, 2022, and 2040.
EIA’s 2019 analysis is limited, because plants that will be deployed by then are already underway. Coal plants, offshore wind, geothermal energy, and nuclear power are not represented in the 2019 data. Because builders can still take advantage of federal tax credits, onshore wind, and solar photovoltaic (PV) resources are dirt cheap, at $39.30/MWh and $58.80/MWh respectively.
The more interesting figures are found for 2022 and beyond. Five years in the future, the EIA thinks the most expensive energy resources will include:
- Solar thermal plants at $184.40 per MWh
- Offshore wind at $145.90 per MWh
- Coal plants with 30 percent carbon removal capability at $140 per MWh
- Coal plants with 90 percent carbon removal at $123.20 per MWh
The EIA only found LCOE numbers for coal plants with some degree of carbon capture because of recent updates to the Clean Air Act which require plants to meet specific CO2 emission standards. Coal plants that can't meet those emissions standards can't be built currently.
On the other hand, electricity generation resources that will be on the cheaper end when they go into service in 2022 include:
- Geothermal: $43.30 per MWh
- Onshore wind: $52.20 per MWh
- Advanced combined-cycle natural gas-burning plants: $56.50 per MWh
- Solar PV: $66.80 per MWh
Geothermal was the cheapest of all resources in the EIA's analysis after factoring in tax credits that are expected to extend until 2022.
Advanced nuclear plants being deployed in 2022 hit squarely between the low end and the high end, at $99.1 per MWh.
Fast forward to 2040, and the EIA thinks that prices aren't going to change much from the 2022 projections. There are a few exceptions, of course. Some of the energy that gets cheaper includes:
- Coal with any amount of carbon capture drops by $10 to $20 per MWh due to falling capital costs (meaning perhaps it will get easier and cheaper to build carbon removal technology).
- Nuclear projects, whose cost decreases $10 per MWh because of a considerable decrease in capital costs, despite the EIA projecting that variable costs for nuclear energy, including fuel, will go up.
- Offshore wind also decreases by $20 per MWh due to falling capital costs—a trend we’re already seeing today as the cost to install offshore wind facilities is getting cheaper and cheaper with expertise and investment developed in Europe, where offshore wind is more prevalent.
On the other hand, the cost of geothermal energy increases by about $10/MWh due to an increase in fixed maintenance costs.
But this is hardly the whole story
But, of course, comparing electricity-generation resources is not quite that simple if you want the most compelling and full story on which resources are better deployed in any given region of the US.
The EIA says that looking at the LCOE alone is an imperfect way to study energy-generating plants because it doesn’t directly compare the cost of each kilowatt-hour from a new plant with the cost of kilowatt-hours being displaced.
This comparison, found in what's called the Levelized Avoided Cost of Energy, or LACE, can help economists and analysts make decisions if, say, a resource like solar can only operate during the day or a resource like wind sees fluctuations based on the seasons. A solar installation's usefulness is subject to the availability of sunlight in a given region and might not be able to compete with a more reliable natural gas plant, but solar electricity can also be less expensive to produce during the middle of a hot August day than electricity from a fossil fuel-burning peaker plant that requires a startup period and cooling. If a resource is displacing power that’s more expensive to run when that first resource would run, that will be reflected in a LACE analysis.
The EIA said it looked at 22 different regions in the US and drew up LACE values for each type of energy by comparing that generation project with a new generation project that would be most likely to be built given the existing energy mix in that region.
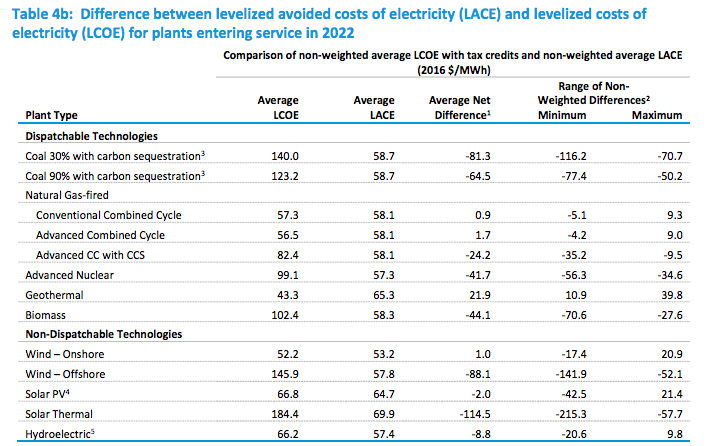
Once LACE values are drawn up, the EIA says it’s instructive to compare the LACE and the LCOE of a project. If the avoided cost is greater than the levelized cost (LACE - LCOE > 0), then that resource is attractive for an energy company to build.
The EIA writes that the “net difference between LACE and LCOE provides a reasonable point of comparison of first-order economic competitiveness among a wider variety of technologies than is possible using either LCOE or LACE tables individually.”
Here, LACE-LCOE values provide interesting insight into what might get built in 2022 and 2040 (2019 was left out of this calculation).
We'll start with the projected losers for whom the average LACE does not exceed the LCOE in 2022. These include:
- Coal with 30 percent carbon removal: -81.3
- Offshore wind: -88.1
- Solar thermal: -114.5
The EIA projects that, in most regions, these forms of energy won't be attractive to build without some other outside factor being present.
Winners are energy resources with a LACE that's greater than their LCOE. Geothermal appears to be the most attractive energy generation to build with a LACE-LCOE difference of 21.9.
Other technologies toe the line between favorable and unfavorable, likely reflecting some considerable regional variation for whether that resource is attractive to build or not.
- Advanced combined cycle natural gas plants have a LACE - LCOE of 1.7, with a range of difference between -4.2 and 9.
- Onshore wind has an average net difference of 1, but the regional range in differences is larger, between -17.4 and 20.9.
- Solar PV, with an average net difference of -2, has an even wider range, between -42.5 and 21.4, meaning that some areas of the country will really want to build out more solar, and others really won't.
The EIA's projections for 2040 seem to narrow: coal with 30 percent carbon removal has an average net LACE-LCOE difference of -56.1, so it's unattractive to build, but less so than 18 years prior. Offshore wind is at -63.3, and solar thermal is at -112, but onshore wind’s average net difference comes up to 3.3 and solar PV’s hits 8.2. Advanced combined cycle natural gas plants are, apparently, still attractive to build that far out in the EIA’s projection, coming in at 7.8.
The future can be guessed at, not known
There are some obvious winners and losers: geothermal, natural gas, onshore wind, and solar PV in the former, and coal, nuclear, solar thermal, and offshore wind in the latter. But all of these estimates are projections, and they all factor in tax credits that are set to expire in five years or less.
It's hard to tell exactly what will happen by 2022—we know that the EIA's projections about wind and solar were too conservative even a couple of years back. Already we know that advances in offshore wind turbines and wind pattern projection could make that form of energy much cheaper than it is now. And if removing carbon from a coal plant's emissions becomes more economical, that could change the LACE-LCOE divide, too. For now, however, the EIA's analysis is a good way to get a broad overview on future investment in the US energy mix.
Listing image by SolarReserve
reader comments
88