
The pair takes out the year's high and hit 134.88 today
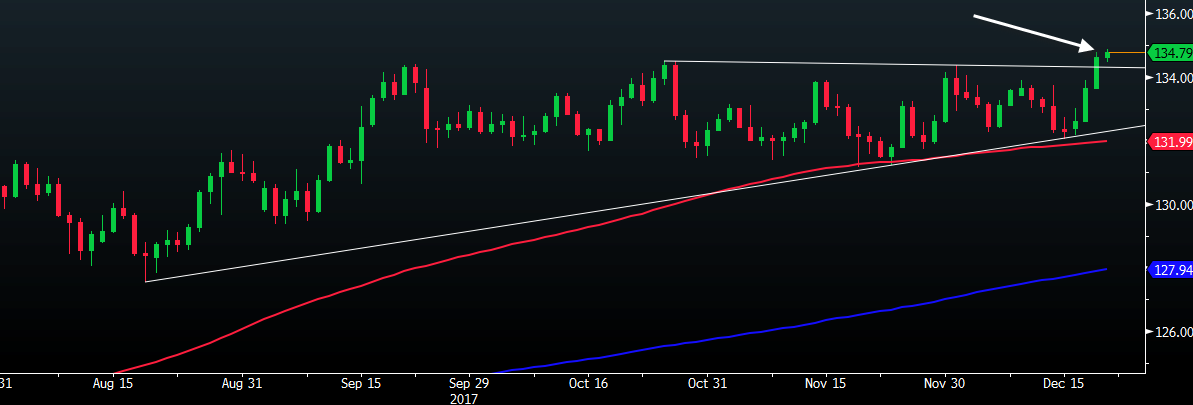
I warned about this move here yesterday. As the JPY continues to slump on the back of falling bonds and EUR sentiment remains underpinned, this could be one that breaks out rather fiercely.
But just take note on year-end liquidity, spikes and spurts are not uncommon. As traders, we just try to keep that in mind and trade what we see.
A break out of its recent range has sent the pair to the highest level since 2015. What levels are there to look out for on the topside?
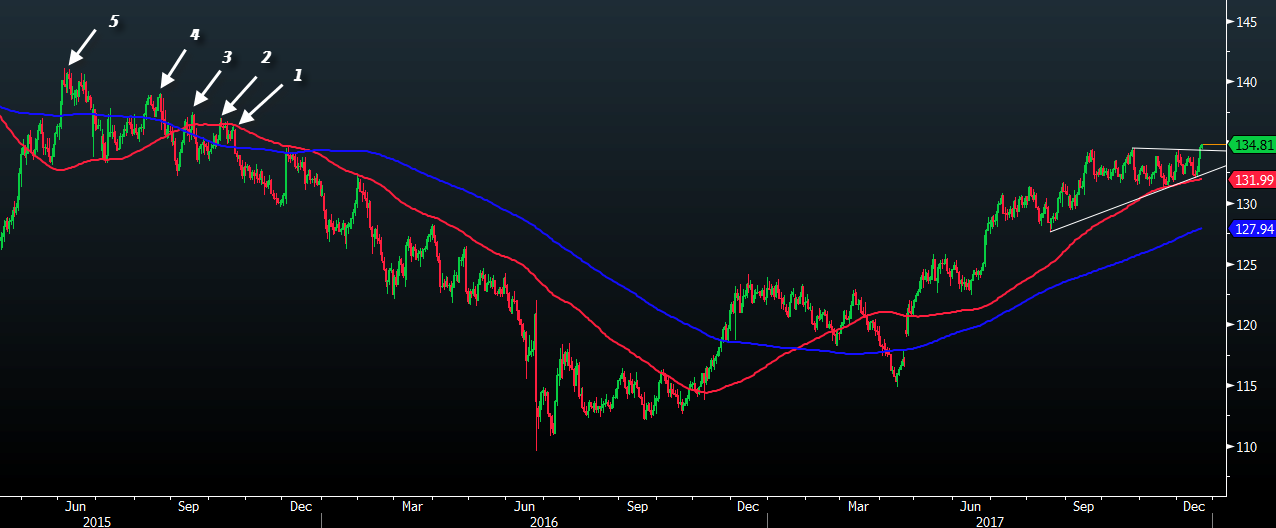
1. 1.3639 - 21 Oct high
2. 1.3696 - Oct 2015 high
3. 1.3745 - Sept 2015 high
4. 1.3900 - Aug 2015 high
5. 1.4106 - June 2015 high
In general, there are many spikes along the daily chart as you can see here. They're all fairly decent resistance levels for sellers to lean on but how can we tell?
Well, if you notice most of the highs usually coincide with somewhere near the figure level. Usually, figure levels are also psychological levels that traders lean on for support/resistance. If you include July 2015's high of 1.3780, you can see that most of the monthly highs are quite sticky to the figure level in some way.
I'd rather use the monthly chart to give me more clarity on the levels.
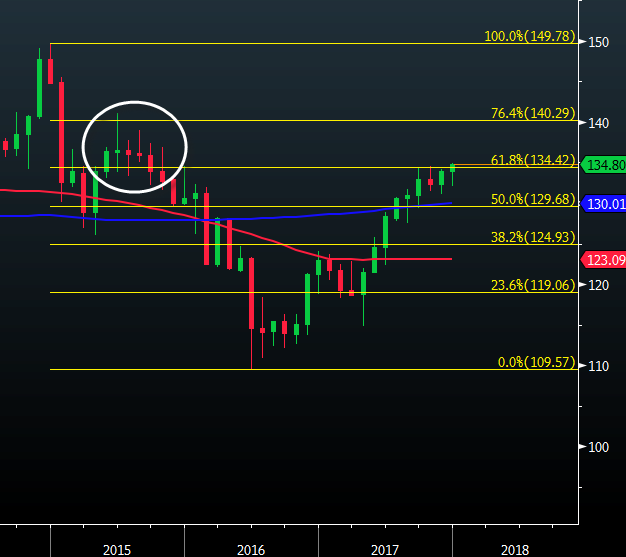
Despite the pair touching a high of 1.4106 in June 2015, the highest monthly close in 2015 is 136.54. Remember how I talked about scale trading here? A pair like this would be perfect if you're that type of trader.
If anything, it looks like sellers would lean on heavily on the figure levels or thereabouts to come in with figure levels after 1.3700 being key. Though there could be some resistance along the way, you wouldn't want to be betting against a pair that's gone up 8 out of the last 9 months, would you?
Buyers are firmly in control of the pair, but do take note of key resistance on the way up - though it's a bit less clear when it comes to a pair like this when the next Fib level is almost 600 pips higher (when you look at the monthly chart).

